Nicola Dickmann: - LIS
Nicola Dickmann: - LIS
Nicola Dickmann: - LIS

You also want an ePaper? Increase the reach of your titles
YUMPU automatically turns print PDFs into web optimized ePapers that Google loves.
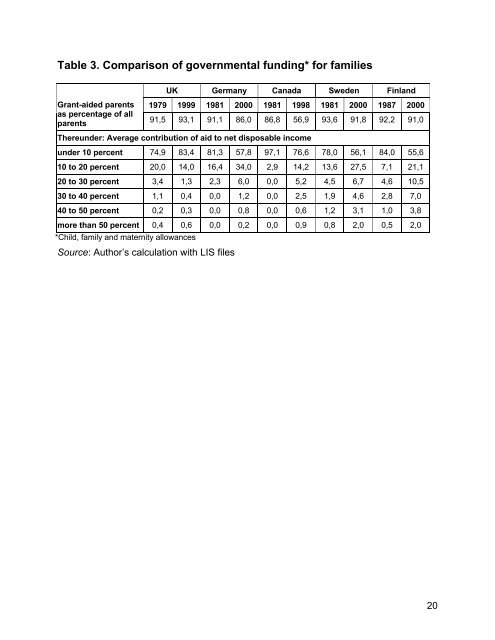
Table 3. Comparison of governmental funding* for familiesUK Germany Canada Sweden FinlandGrant-aided parentsas percentage of allparents1979 1999 1981 2000 1981 1998 1981 2000 1987 200091,5 93,1 91,1 86,0 86,8 56,9 93,6 91,8 92,2 91,0Thereunder: Average contribution of aid to net disposable incomeunder 10 percent 74,9 83,4 81,3 57,8 97,1 76,6 78,0 56,1 84,0 55,610 to 20 percent 20,0 14,0 16,4 34,0 2,9 14,2 13,6 27,5 7,1 21,120 to 30 percent 3,4 1,3 2,3 6,0 0,0 5,2 4,5 6,7 4,6 10,530 to 40 percent 1,1 0,4 0,0 1,2 0,0 2,5 1,9 4,6 2,8 7,040 to 50 percent 0,2 0,3 0,0 0,8 0,0 0,6 1,2 3,1 1,0 3,8more than 50 percent 0,4 0,6 0,0 0,2 0,0 0,9 0,8 2,0 0,5 2,0*Child, family and maternity allowancesSource: Author’s calculation with <strong>LIS</strong> files20