Create successful ePaper yourself
Turn your PDF publications into a flip-book with our unique Google optimized e-Paper software.
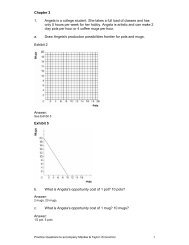
a. Plot the supply <strong>and</strong> dem<strong>and</strong> curves for bicycles in Exhibit 3. On thegraph, impose a tax of €300 per bicycle to be collected from the sellers.After the tax, what has happened to the price paid by the buyers, theprice received by the sellers, <strong>and</strong> the quantity sold when compared tothe free market equilibrium?Exhibit 3Answer:See Exhibit 7. The price buyers pay rises to €700, the price sellers receive falls to €400, <strong>and</strong>the quantity sold falls to 40 units.Exhibit 7Practice <strong>Questions</strong> to accompany Mankiw & Taylor: Economics: Special Edition