Chapter 13 Questions and answers
Chapter 13 Questions and answers
Chapter 13 Questions and answers

You also want an ePaper? Increase the reach of your titles
YUMPU automatically turns print PDFs into web optimized ePapers that Google loves.
<strong>Chapter</strong> <strong>13</strong>1. Joe runs a small boat factory. He can make ten boats per year <strong>and</strong> sellthem for €25,000 each. It costs Joe €150,000 for the raw materials(fibreglass, wood, paint, <strong>and</strong> so on) to build the ten boats. Joe hasinvested €400,000 in the factory <strong>and</strong> equipment needed to produce theboats: €200,000 from his own savings <strong>and</strong> €200,000 borrowed at 10percent interest. (Assume that Joe could have loaned his money out at10 percent, too.) Joe can work at a competing boat factory for €70,000per year.a. What is the total revenue Joe can earn in a year?Answer:10 x €25,000 = €250,000b. What are the explicit costs Joe incurs while producing ten boats?Answer:€150,000 + (€200,000 x 0.10) = €170,000c. What are the total opportunity costs of producing ten boats (explicit <strong>and</strong>implicit)?Answer:€150,000 + (€400,000 x 0.10) + €70,000 = €260,000d. What is the value of Joe's accounting profit?Answer:€250,000 – €170,000 = €80,000e. What is the value of Joe's economic profit?Answer:€250,000 – €260,000 = –€10,000f. Is it truly profitable for Joe to operate his boat factory? Explain.Answer:No. Joe could make €70,000 plus 10 percent interest on his €200,000 financial capital for atotal of €90,000 if he worked for the competition instead of running his own factory. His factorymakes an accounting profit of only €80,000 per year so it costs him €10,000 to run his ownfactory (the size of the economic loss).Practice <strong>Questions</strong> to accompany Mankiw & Taylor: Economics: Special Edition
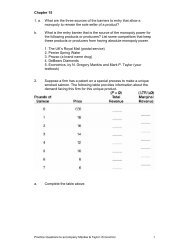
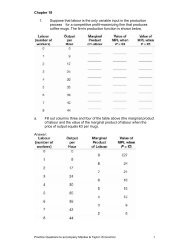
2. Complete the following table. It describes the production <strong>and</strong> cost ofhamburgers at a roadside st<strong>and</strong>. All figures are measured per hour.Answer:a. Plot the production function in Exhibit 1.Exhibit 1Practice <strong>Questions</strong> to accompany Mankiw & Taylor: Economics: Special Edition
Answer:See Exhibit 4.Exhibit 4b. What happens to the marginal product of labour as more workers areadded to the production facility? Why? Use this information about themarginal product of labour to explain the slope of the productionfunction you plotted above.Answer:It diminishes because additional workers have to share the production equipment <strong>and</strong> thework area becomes more crowded. The slope of the production function is the change inoutput from a change of one unit of input, which is the marginal product of labour. Since it isdiminishing, the slope of the production function gets flatter as a greater number of inputs areused.c. Plot the total-cost curve in Exhibit 2.Exhibit 2Answer:See Exhibit 5.Practice <strong>Questions</strong> to accompany Mankiw & Taylor: Economics: Special Edition
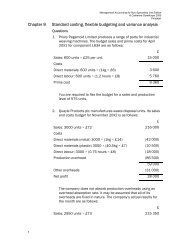
Exhibit 5d. Explain the shape of the total cost curve.Answer:The total cost curve gets steeper as the quantity produced rises due to the diminishingmarginal product of labour. That is, in order to produce additional equal increments of outputthe firm must employ ever greater amounts of inputs <strong>and</strong> costs rise at an increasing rate.3. The information below is for Bob's blue jeans manufacturing plant. Alldata is per hour. Complete the table. Note the following abbreviations:FC (fixed cost), VC (variable cost), TC (total cost), AFC (average fixedcost), AVC (average variable cost), ATC (average total cost), MC(marginal cost).Practice <strong>Questions</strong> to accompany Mankiw & Taylor: Economics: Special Edition
Answer:a. Plot AFC, AVC, ATC, <strong>and</strong> MC in Exhibit 3.Exhibit 3Answer:See Exhibit 6.Practice <strong>Questions</strong> to accompany Mankiw & Taylor: Economics: Special Edition
Exhibit 6b. Explain the shape of each of the curves you plotted in part (a) above.Answer:AFC declines as the quantity goes up because a fixed cost is spread across a greater numberof units. MC declines for the first four units due to an increasing marginal product of thevariable input. MC rises thereafter due to decreasing marginal product. AVC is U-shaped forthe same reason as MC. ATC declines due to falling AFC <strong>and</strong> increasing marginal product.ATC rises at higher levels of production due to decreasing marginal product.c. Explain the relationship between ATC <strong>and</strong> MC.Answer:When MC is below ATC, ATC must be declining. When MC is above ATC, ATC must berising. Therefore, MC crosses ATC at the minimum of ATC.d. Explain the relationship between ATC, AFC, <strong>and</strong> AVC.Answer:AFC plus AVC equals ATC.e. What is Bob's efficient scale? How do you find the efficient scale?Explain.Answer:Six pairs of blue jeans. Efficient scale is the output that minimizes ATC. It is also the placewhere MC crosses the average total cost curve.Practice <strong>Questions</strong> to accompany Mankiw & Taylor: Economics: Special Edition