Create successful ePaper yourself
Turn your PDF publications into a flip-book with our unique Google optimized e-Paper software.
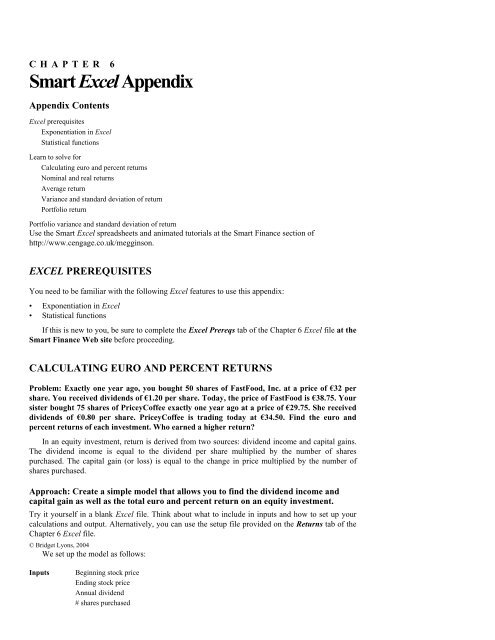
<strong>CHAPTER</strong> 6Smart Excel AppendixAppendix ContentsExcel prerequisitesExponentiation in ExcelStatistical functionsLearn to solve forCalculating euro and percent returnsNominal and real returnsAverage returnVariance and standard deviation of returnPortfolio returnPortfolio variance and standard deviation of returnUse the Smart Excel spreadsheets and animated tutorials at the Smart Finance section ofhttp://www.cengage.co.uk/megginson.EXCEL PREREQUISITESYou need to be familiar with the following Excel features to use this appendix:• Exponentiation in Excel• Statistical functionsIf this is new to you, be sure to complete the Excel Prereqs tab of the Chapter 6 Excel file at theSmart Finance Web site before proceeding.CALCULATING EURO AND PERCENT RETURNSProblem: Exactly one year ago, you bought 50 shares of FastFood, Inc. at a price of €32 pershare. You received dividends of €1.20 per share. Today, the price of FastFood is €38.75. Yoursister bought 75 shares of PriceyCoffee exactly one year ago at a price of €29.75. She receiveddividends of €0.80 per share. PriceyCoffee is trading today at €34.50. Find the euro andpercent returns of each investment. Who earned a higher return?In an equity investment, return is derived from two sources: dividend income and capital gains.The dividend income is equal to the dividend per share multiplied by the number of sharespurchased. The capital gain (or loss) is equal to the change in price multiplied by the number ofshares purchased.Approach: Create a simple model that allows you to find the dividend income andcapital gain as well as the total euro and percent return on an equity investment.Try it yourself in a blank Excel file. Think about what to include in inputs and how to set up yourcalculations and output. Alternatively, you can use the setup file provided on the Returns tab of theChapter 6 Excel file.© Bridget Lyons, 2004We set up the model as follows:InputsBeginning stock priceEnding stock priceAnnual dividend# shares purchased
CalculationsOutputFunds investedCapital gain/lossTotal € dividendsEuro returnPercent returnCalculate funds invested by multiplying the beginning price by the number of shares purchased.You should find that your euro returns was €397.50 which translates into a percentage return of24.8%. Your sister had a higher euro return, €416.25, but a lower percent return, 18.7%, due to herhigher initial investment.Apply itWhat if you change the number of shares purchased?Suppose you each purchase 100 shares.The euro return varies (you earn €795 and she earns €555.), but the percent returns are notaffected because the return on investment remains constant.NOMINAL AND REAL RETURNSCreate a simple model in Excel to solve for real or nominal returns.Problem: You are considering a one-year investment with a nominal return of 11%. You thinkinflation will be 2.5% this year. If so, what is your expected real rate of return?To determine the real rate of return, use the text equation:(1+ nominal return) = (1+ real return) * (1+ inflation rate)Solving the equation for real return yields:Real return = (1+ nominal return) / (1+ inflation rate) – 1Approach: Set up a basic model to solve for the real rate of return.Try it yourself in a blank Excel file. Think about what to include in inputs and how to set up yourcalculations and output. Alternatively, you can use the setup file provided on the Nom & RealReturn tab of the Chapter 6 Excel file. You should get a real rate of return of 8.3%.Apply itWhat if inflation is not what you expected?Suppose inflation is 4.5%? 1.5%?Higher levels of inflation lead to lower real returns. At 4.5% inflation, the real rate of return is6.2%; at 1.5% inflation, the real rate of return is 9.4%.CALCULATING THE AVERAGE, VARIANCE, AND STANDARDDEVIATIONProblem: Table 6.3 in the text examined stock returns from 1994–2003. Use the text data inthat table and calculate the average return, variance of returns, and standard deviation ofreturns for the 1994–2003 period.Approach 1: Use the mathematical equations.Open the Chapter 6 Excel file and turn to the Stats tab.Enter the year and return data in the input section.
Next, create a formula to calculate average return.The model also includes calculations to facilitate calculation of variance. Complete thesecalculations. Find the desired output: average return, variance, and standard deviation.You should get the following results. Note that these values differ just slightly from those in thetext because we did not round here.OutputAverage Return 12.46Variance 442.36Std deviation 21.03Approach 2: Use the statistical functions in Excel.Excel includes a number of built-in statistical functions, including average, variance, and standarddeviation. Use of these functions is detailed on the Prereqs tab of the Chapter 6 Excel file.The average function returns the average of a group of numbers. You can use the function byeither typing in individual values or using cell references.The format is:=average(value1, value2,….) or =average(cell ref:cell ref)The variance function returns the variance of a group of numbers. You can use the function byeither typing in individual values or using cell references.The format is:=var(value1, value2,….) or =var(cell ref:cell ref)The standard deviation function returns the standard deviation of a group of numbers.You can use the function by either typing in individual values or using cell references.The format is:=stdev(value1, value2,….) or =stdev(cell ref:cell ref)To solve, using Approach 2, again enter the years and returns as inputs. Then use the built-instatistical functions to find the average return, variance of returns, and standard deviation of returns.You should get the same results as with Approach 1.Apply itAn advantage of using the built-in functions is that it is easy to look at statisticsfor sub-periods.Find the average return, variance of returns, and standard deviation of returns for• 1995–1999• 1996–2000• 2000–2003You should get the following results.1995–1999 1996–2000 2000–2003Average return 27.18 Average return 17.72 Average return (2.80)Variance 41.21 Variance 270.62 Variance 547.94Std deviation 6.42 Std deviation 16.45 Std deviation 23.41InterpretThe period selected for analysis has a tremendous impact on the results.
CALCULATING PORTFOLIO RISK AND RETURN STATISTICSYou may also want to find the average return, variance of returns, and standard deviation of returnsfor a portfolio.Problem: Solve Problem 6-19 in which you were asked to compare investments in Merck,AMD, and a portfolio with 50% invested in each.Approach: Build a basic model and use the statistical functions.Open the Chapter 6 Excel file and turn to the Portfolios tab.Enter the year and return data for AMD and Merck in the input section. Then, enter the percent ofthe portfolio invested in each. The percents must add up to 100% each year. Because there is 50%invested in each firm in each year, type in 50% for the percent in AMD in 1994. Then, copy downfor Merck and across all years.Calculate portfolio return in Year 1 as the weighted average return. Your formula in 1994 shouldbe:=C15*C17+C16*C18Copy the formula across for all years.Then, use the statistical functions to find the average return for AMD, Merck, and the portfolio.Here are our results:Apply itOutputAMD Merck PortfolioAverage return 0.18 0.18 0.18Variance 0.32 0.11 0.08Std deviation 0.56 0.33 0.29What if you vary the percent of the portfolio invested in AMD and Merck?• Consider a portfolio with 75% in AMD and 25% in Merck.• Consider a portfolio with 25% in AMD and 75% in Merck.InterpretInterestingly, in this example, varying the percents invested in each stock does not change theaverage portfolio return.Is this typical?No. This occurs only because AMD and Merck have approximately the same average return.The variance and standard deviation of the portfolio are, however, affected. With 75% in AMD and25% in Merck, the variance is 0.17 and the standard deviation 0.41. With 25% in AMD and 75% inMerck, the variance drops to 0.06 and standard deviation to 0.25.


