Conceptual Design o... - UIHC Positron Emission Tomography ...
Conceptual Design o... - UIHC Positron Emission Tomography ...
Conceptual Design o... - UIHC Positron Emission Tomography ...

You also want an ePaper? Increase the reach of your titles
YUMPU automatically turns print PDFs into web optimized ePapers that Google loves.
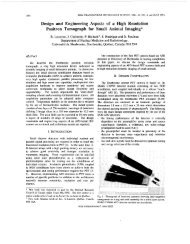
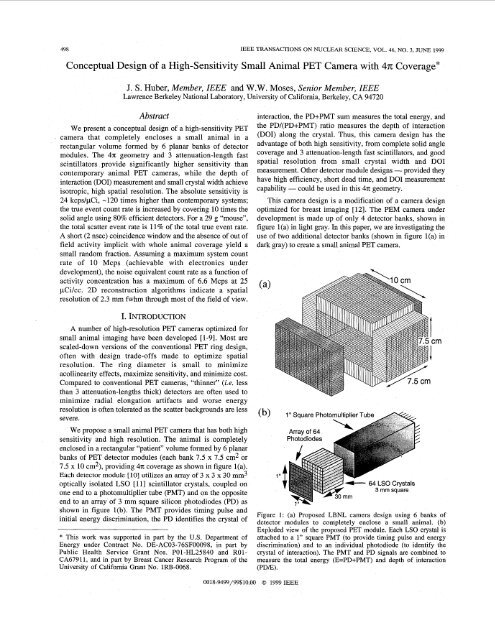
498 IEEE TRANSACTIONS ON NUCLEAR SCIENCE, VOL. 46, NO. 3, JUNE 1999<strong>Conceptual</strong> <strong>Design</strong> of a High-Sensitivity Small Animal PET Camera with 4n Coverage*J. S. Huber, Member, IEEE and W.W. Moses, Senior Member, IEEELawrence Berkeley National Laboratory, University of California, Berkeley, CA 94720AbstractWe present a conceptual design of a high-sensitivity PETcamera that completely encloses a small animal in arectangular volume formed by 6 planar banks of detectormodules. The 4n: geometry and 3 attenuation-length fastscintillators provide significantly higher sensitivity thancontemporary animal PET cameras, while the depth ofinteraction (DOI) measurement and small crystal width achieveisotropic, high spatial resolution. The absolute sensitivity is24 kcps/pCi, -120 times higher than contemporary systems;the true event count rate is increased by covering 10 times thesolid angle using 80% efficient detectors. For a 29 g “mouse”,the total scatter event rate is 11% of the total true event rate.A short (2 nsec) coincidence window and the absence of out offield activity implicit with whole animal coverage yield asmall random fraction. Assuming a maximum system countrate of 10 Mcps (achievable with electronics underdevelopment), the noise equivalent count rate as a function ofactivity concentration has a maximum of 6.6 Mcps at 25pCi/cc. 2D reconstruction algorithms indicate a spatialresolution of 2.3 mm fwhm through most of the field of view.I. INTRODUCTIONA number of high-resolution PET cameras optimized forsmall animal imaging have been developed [l-91. Most arescaled-down versions of the conventional PET ring design,often with design trade-offs made to optimize spatialresolution. The ring diameter is small to minimizeacollinearity effects, maximize sensitivity, and minimize cost.Compared to conventional PET cameras, “thinner” (i.e. lessthan 3 attenuation-lengths thick) detectors are often used tominimize radial elongation artifacts and worse energyresolution is often tolerated as the scatter backgrounds are lesssevere.We propose a small animal PET camera that has both highsensitivity and high resolution. The animal is completelyenclosed in a rectangular “patient” volume formed by 6 planarbanks of PET detector modules (each bank 7.5 x 7.5 cm2 or7.5 x 10 cm2), providing 471 coverage as shown in figure l(a).Each detector module [ 101 utilizes an array of 3 x 3 x 30 rnm3optically isolated LSO [ 111 scintillator crystals, coupled onone end to a photomultiplier tube (PMT) and on the oppositeend to an array of 3 mm square silicon photodiodes (PD) asshown in figure l(b). The PMT provides timing pulse andinitial energy discrimination, the PD identifies the crystal of* This work was supported in part by the U.S. Department ofEnergy under Contract No. DE-AC03-76SF00098, in part byPublic Health Service Grant Nos. POI-HL25840 and R01-CA67911, and in part by Breast Cancer Research Program of theUniversity of California Grant No. 1RB-0068.interaction, the PD+PMT sum measures the total energy, andthe PD/(PD+PMT) ratio measures the depth of interaction(DOI) along the crystal. Thus, this camera design has theadvantage of both high sensitivity, from complete solid anglecoverage and 3 attenuation-length fast scintillators, and goodspatial resolution from small crystal width and DO1measurement. Other detector module designs - provided theyhave high efficiency, short dead time, and DO1 measurementcapability - could be used in this 47r geometry.This camera design is a modification of a camera designoptimized for breast imaging [12]. The PEM camera underdevelopment is made up of only 4 detector banks, shown infigure l(a) in light gray. In this paper, we are investigating theuse of two additional detector banks (shown in figure l(a) indark gray) to create a small animal PET camera.Figure 1: (a) Proposed LBNL camera design using 6 banks ofdetector modules to completely enclose a small animal. (b)Exploded view of the proposed PET module. Each LSO crystal isattached to a 1” square PMT (to provide timing pulse and energydiscrimination) and to an individual photodiode (to identify thecrystal of interaction). The PMT and PD signals are combined tomeasure the total energy (E=PD+PMT) and depth of interaction(PDE).0018-9499/99$10.00 0 1999 IEEE
11. METHODSAnalytic computation is used to estimate the sensitivityand count rate performance of cameras imaging water filledcylindrical phantoms with uniform activity concentration. Themain assumption in this computation is that all detectormodules are exposed to the same radiation flux, and so havethe same singles rate, scatter fraction, coincidence fraction, anddead time factors. This computation includes the camera solidangle coverage and detection efficiency, effects of energydiscrimination, coincidence timing window and randombackground, scatter and attenuation in the phantom, and deadtime in the front-end and coincidence processing electronics.Monte Carlo data are used to estimate the singles detectionefficiency, scatter fraction, and coincidence detection efficiency.We obtain these factors by simulating simple cylindrical orspherical camera geometries with a water filled cylindricalphantom placed at the center of the camera. Energy dependentCompton scattering and photoelectric absorption are modeledin the phantom and detectors. Monte Carlo data are used toestimate the percentage of events that are within a photopeakwindow, using a 350 keV energy threshold. Detector scatter isthus incorporated in the Monte Carlo model by what fractionof the 5 11 keV photons fall within the photopeak window.The threshold choice of 350 keV was arbitrary and should beexplored further using a real PET detector. The analyticcomputation does not explicitly perform scatter subtraction.Instead, the total scatter event rate is assumed to be a fixedfraction of the total true coincidence event rate; Monte Carlosimulation is used to determine the fraction. We are assumingan uniform scatter and random distribution (i.e. the same forevery chord).We first model using Monte Carlo data for a fixed activitystrength, then analytically scale in order to determine theactivity strength dependence. The true coincidence and scatterevent rates are given by True=pe2g,P2 andScatter = f,True respectively, where p is the activity density,E is the singles detection efficiency, g, is a geometryefficiency for true coincidence events, P is the probability ofescape for a 511 keV photon from the object, and f‘ is thescatter fraction. The random event rate is given byRandom = 2~(Singles)~ = p2e2g,.P2 where T is thecoincidence resolving time and g, is a geometry efficiency forrandom events. These rates are modified to reflect detector deadtime and coincidence processor rate limitations, and theproportionality factors are determined either from firstprinciples or by comparing to published data. The dead timeeffects are imposed using two factors - a paralyzing dead timeefficiency per module due to the front-end electronics, modeledas an exponential, and a maximum system event rate limit dueto the coincidence processing electronics. When the totalsystem event rate exceeds the maximum, the individual countrates (i.e. true coincidence, random and scatter count rates) aretaken as relative fractions of the maximum.The noise equivalent count rate (NECR) is the number ofcounts detected as a function of the activity concentration, after(a). IccCa0hW8060........ .-iJActivity Density (pCi/cc)(-+NEC Measured Data, 1--a--NEC Model Calculation1Y 151 f\. -..c al IF-I n499]rat phantom/ !‘-10 40 6’0 8’0 lb0Activity Density (pCi/cc)Figure 2: Comparison between measured (solid lines) and modeled(dashed lines) count rates of the MicroPET system for a 2.5”diameter by 1.5” long cylindrical “rat” phantom of uniformactivity. (a) True coincidence and random event rates and (b) noiseequivalent count rates as a function of phantom activityconcentration. Calculated and measured curves agree within 13%on average, demonstrating good modeling accuracy.correcting for the effects of random and scatter events andtaking into account dead time losses. It is a standard measureof signal to noise in reconstructed PET images [13]. Whencalculating the NECR, oinly random and scatter events in thefield of view of the objecl contribute.We validate this analytic-computation model usingmeasured data from MicroPET [5], an existing small animalPET camera whose performance is well characterized.MicroPET is basically a scaled down version of a conventionalPET camera designed for imaging a variety of animals,including primates, rats, and mice. It consists of a ring of 30position-sensitive scintillation detectors, each with an 8 x 8array of 2 x 2 x 10 mm:) LSO crystals coupled via opticalfibers to a multi-channel photomultiplier tube. The detectorring diameter is 17.2 cm with an axial extent of 1.8 cm.We compare between our MicroPET model and measureddata when imaging a small “rat” phantom placed at the cameracenter. This 120 cc water filled cylindrical phantom, with a2.5” diameter and 1.5” length, is the smallest phantom forwhich MicroPET has data available. Figure 2 shows the truecoincidence event, random event, and noise equivalent countrates as a function of activity concentration of the MicroPETsystem for both measured and ow modeled data. Calculated andmeasured curves agree within 4% for the majority of the
500activity density range and within 13% on average,demonstrating good modeling accuracy. Some disagreement isseen for random and true coincidence event rates at the highestactivity density; we believe this is due to the simplicity of ourdead time model.111. LBNL ANIMAL PET CAMERA DESIGNA. Count Rates and SensitivityThe analytic computation is then used to estimate theperformance of our LBNL small animal PET camera,compared with calculated MicroPET performance. We applythe model to a “mouse” phantom - a 29 cc water filledcylinder with a 2.5 cm diameter and 6 cm length - placed atthe center of either camera.We model the LBNL camera design assuming a 10 Mcpsmaximum system count rate, which is limited by thecoincidence processing electronics. Figure 3 shows the truecoincidence, scatter, random, and total event rates as a functionof phantom activity concentration calculated with this cameradesign when imaging the “mouse’’ phantom. We predict a verylarge true coincidence event rate, which dominates the totalevent rate for the entire range of activity concentrationsshown. Our random fraction is small due to a short (2 nsec)coincidence window and the absence of “out of field” activityimplicit with whole animal coverage. The total scatter eventrate is assumed to be 11% of the total true coincidence eventrate, based on Monte Carlo simulation.The noise equivalent count rate as a function of activitydensity for the LBNL camera with the “mouse” phantom isshown in figure 4. The maximum NECR is 6600 kcps at anactivity concentration of 25 pCi/cc, limited by the dataacquisition system. If the maximum system count rate isremoved, the LBNL camera maximum NECR becomes 8100kcps at 45 pCi/cc and is limited by the front-end electronics.We compare our results with the calculated NECR for theACIC6000ZOO0o n0 20 40 60 80 100Activity Density (pCi/cc)Figure 3: True coincidence, scatter, random and total event rates asa function of phantom activity concentration calculated for theproposed LBNL animal PET camera with a 29 cc “mouse” phantom.The random fraction is small due to the absence of “out of field”activity implicit with complete solid angle coverage, as well as ashort coincidence window. The total scatter event rate is 11% ofthe total true event rate. A maximum system count rate of 10 Mcpsis assumed.io5 -‘““I lo0.10.01:LBNL Animal PET- -M icroP ETA-*.*-A .... &...-A -... I....& ......* ....‘f’ lmouse phantom) 120 40 60 80 100Activity Density (pCi/cc)Figure 4: Noise equivalent count rate as a function of phantomactivity concentration calculated for the proposed LBNL cameradesign (solid line) and MicroPET (dashed line) with a 29 cc“mouse” phantom.MicroPET system when imaging the same “mo~se” phantom,also shown in figure 4 as a function of activity density.MicroPET has a maximum NECR of 22 kcps at aconcentration of 100 pCi/cc. Thus, we predict much highernoise equivalent count rates for the LBNL camera.The absolute sensitivity is calculated for a point source atthe center. The absolute sensitivity of the LBNL camera is 24kcps/pCi, approximately 120 times higher than the measuredMicroPET system sensitivity. The increase is due to coveringmore solid angle (factor of 10) and using detector moduleswith 80% photopeak efficiency rather than -23% efficiency(factor of 12). The large increase in sensitivity, whilemaintaining good spatial resolution, should provide asignificantly improved small animal PET camera for manyapplications.B. Data AcquisitionWith complete solid angle coverage and an assumedmaximum system event rate of 10 Mcps, the LBNL cameracount rate is very large. In addition, a 38 bit coincidence eventword will be needed. However, new architectures for higherperformance data acquisition in PET are currently underdevelopment [ 141. These proposed new architectures areexpected to include a 64 bit coincidence event word, on-linerebinning for DOI, and a throughput of 10 M eventdsec forlist-mode data collection as well as both on-line and replayhistogramming. The simplest data acquisition scheme is tocollect data in list-mode, which would fill a 47 Gbyte disk in10 minutes at the maximum event rate.Histogramming based data collection is also possible. Ifwe have 8 depths per crystal, approximately 474 M lines ofresponse are expected. This implies that we will have 3.8Gbytes of data. After rebinning, we expect 7.4 M chords; thisis estimated using combinatorics with the assumption ofconnecting only the front face of each crystal. The actualbinning will be discussed further in the next section. Thiscorresponds to 59 Mbytes of data. Thus, data collection at theassumed maximum rate of 10 Mcps is possible usingelectronics presently under development.,
502VII. REFERENCES[l] P.M. Bloomfield, S. Rajeswaran, et al., “The design andDhvsical characteristics of a small animal uositronI demission tomograph,” Phys. Med. Biol., vol.- 40, pp.1105, 1995.[2] X. Liu, S. Rajeswaran, et al., “<strong>Design</strong> and physicalcharacteristics of a small animal PET using BaF2crystals and a photo sensitive wire chamber,” Nucl.Instrum. and Meth. A, vol. 382, pp. 589, 1996.[3] R. Lecomte, J. Cadorette, et al., “Initial results from theSherbrooke avalanche photodiode positron tomograph,”IEEE Trans. Nucl. Sci., vol. NS-43, pp. 1952, 1996.[4] A. Del Guerra, F. de Notaristefani, et al., “Use of aYAP:Ce matrix coupled to a position-sensitiveDhotomultiDlier for high resolution Dositron emissioniomographi,” IEEE TFans. Nucl. Sci., vol. NS-43, pp.1958, 1996.[5] S.R. Cherry, Y. Shao, et al., “MicroPET: A HighResolution PET Scanner for Imaging Small Animals,”IEEE Trans. Nucl. Sci., vol. NS-44, pp. 1161, 1997.[6] M. Watanabe, H. Okada, et al., “A High ResolutionAnimal PET Scanner Using Compact PS-PMTDetectors,” IEEE Trans. Nucl. Sci., vol. NS-44, pp.1277, 1997.[7] 0. Fries, S.M. Bradbury, et al., “A small animal PETprototype based on LSO crystals read out by avalanchephotodiodes,” Nucl. Instrum. and Meth. A, vol. 387,pp. 220, 1997.[81 S. Weber, A. Terstegge, et al., “The <strong>Design</strong> of an AnimalPET: Flexible Geometry for Achieving Optimal SpatialResolution or High Sensitivity,” ZEEE Trans. Med.Imaging., vol. 16, pp. 684, 1997.[9] A.P. Jeavons, R.A. Chandler, et al., “A Fully-3D, LowCost PET Camera using HIDAC Detectors with SubmillimeterResolution for Imaging Small Animals,”submitted to IEEE Trans. Nucl. Sci., 1998.[lo] J.S. Huber, W.W. Moses, et al., “Characterization of a 64Channel PET Detector Using Photodiodes for CrystalIdentification,” IEEE Trans. Nucl. Sci., vol. NS-44,pp. 1197, 1997.111 C.L. Melcher and J.S. Schweitzer, “Cerium-dopedlutetium orthosilicate: A fast, efficient newscintillator,” IEEE Trans. Nucl. Sci., vol. NS-39, pp.502, 1992.121 W.W. Moses, T.F. Budinger, et al., “PET camera designsfor imaging breast cancer and axillary nodeinvolvement,” J. Nucl. Med 36: pp. 69P, 1995.131 S.C Strother, M.E. Casey, et al., “Measuring PETScanner Sensitivity: Relating Countrates to ImageSignal-to-Noise Ratios using Noise EquivalentCounts,” IEEE Trans. Nucl. Sci., vol. NS-37, pp. 783,1990.[14] W.F. Jones, J.H. Reed, et al., “Next Generation PETData Acquisition Architectures,” IEEE Trans. Nucl.Sci., vol. NS-44, pp. 1202, 1997.[15] P.R.G. Virador, W.W. Moses, et al., “Reconstruction inPET Cameras with Irregular Sampling and Depth ofInteraction Capability,” IEEE Trans. Nucl. Sci., vol.NS-45, pp. 1225, 1998.1161 J.G. Colsher, “Fully three-dimensional positron emissiontomography,” Phys. Med. Biol., vol. 25, pp. 103,1980.1171 J.S. Huber, W.W. Moses, et al., “Calibration of a PETDetector Module that Measures Depth of Interaction,”IEEE Trans. Nucl. Sci., vol. NS-45, pp. 1268, 1998.[18] Society of Nuclear Imaging in Drug Development,“Symposium on the Use of Imaging in Drug R&D,”Bethesda, MD, Sept. 11-13, 1998. ConferenceProceedings J. Clin. Pharm., in press.[ 191 S.P. Hume and T. Jones, “Pharmacological constraintsassociated with positron emission tomographicscanning of small laboratory animals,” Eur J Nucl Med,vol. 25, pp. 173, 1998.[20] S.P. Hume and T. Jones, “<strong>Positron</strong> <strong>Emission</strong><strong>Tomography</strong> (PET) Methodology for Small Animalsand Its Application in Radiopharmaceutical PreclinicalInvestigation,” Nucl Med Biol, vol. 25, pp. 729, 1998.