LAB# 28: MAPPING THE ELECTROSTATIC POTENTIAL ...
LAB# 28: MAPPING THE ELECTROSTATIC POTENTIAL ...
LAB# 28: MAPPING THE ELECTROSTATIC POTENTIAL ...

You also want an ePaper? Increase the reach of your titles
YUMPU automatically turns print PDFs into web optimized ePapers that Google loves.
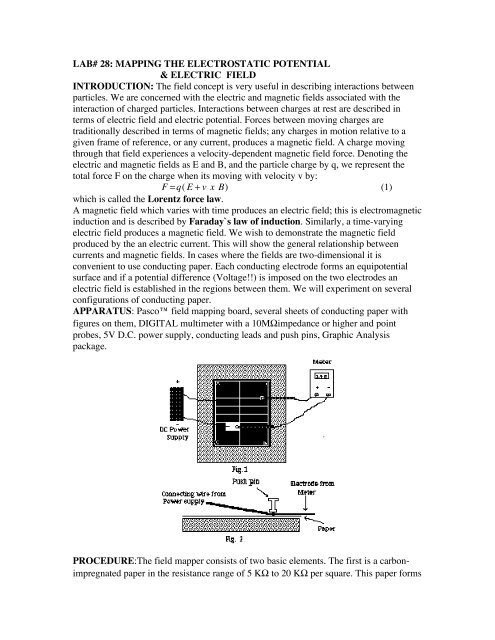
<strong>LAB#</strong> <strong>28</strong>: <strong>MAPPING</strong> <strong>THE</strong> <strong>ELECTROSTATIC</strong> <strong>POTENTIAL</strong>& ELECTRIC FIELDINTRODUCTION: The field concept is very useful in describing interactions betweenparticles. We are concerned with the electric and magnetic fields associated with theinteraction of charged particles. Interactions between charges at rest are described interms of electric field and electric potential. Forces between moving charges aretraditionally described in terms of magnetic fields; any charges in motion relative to agiven frame of reference, or any current, produces a magnetic field. A charge movingthrough that field experiences a velocity-dependent magnetic field force. Denoting theelectric and magnetic fields as E and B, and the particle charge by q, we represent thetotal force F on the charge when its moving with velocity v by:F =q( E + v x B) (1)which is called the Lorentz force law.A magnetic field which varies with time produces an electric field; this is electromagneticinduction and is described by Faraday`s law of induction. Similarly, a time-varyingelectric field produces a magnetic field. We wish to demonstrate the magnetic fieldproduced by the an electric current. This will show the general relationship betweencurrents and magnetic fields. In cases where the fields are two-dimensional it isconvenient to use conducting paper. Each conducting electrode forms an equipotentialsurface and if a potential difference (Voltage!!) is imposed on the two electrodes anelectric field is established in the regions between them. We will experiment on severalconfigurations of conducting paper.APPARATUS: Pasco field mapping board, several sheets of conducting paper withfigures on them, DIGITAL multimeter with a 10MΩimpedance or higher and pointprobes, 5V D.C. power supply, conducting leads and push pins, Graphic Analysispackage.PROCEDURE:The field mapper consists of two basic elements. The first is a carbonimpregnatedpaper in the resistance range of 5 KΩ to 20 KΩ per square. This paper forms
the conducting medium or space between the electrodes. The second element is aconductive ink. The resistance of the ink is between .03 and .05 Ω /cm. for a 1 mm. wideline.Because the paper has a finite resistance, a current must flow through it to produce apotential difference. This current is supplied by the conductive ink electrodes whichcauses a potential drop to occur across the paths. Because of the large difference betweenthe ink`s resistance and the resistance of the paper, this potential drop is less than 1% ofthat produced across the paper. So that, the potential drop across the electrodes may beconsidered negligible.<strong>THE</strong> EXPERIMENTS1. Mount the conductive paper with the circuit you wish to start with on the cork boardusing one of the metal push pins in each corner.2. Connect the electrodes to a DC power supply with a 5 to 20 VDC range. See Fig. 1.3. Place the terminal of a connecting wire over the electrode, then stick a metal pinthrough its terminal and the electrode into the cork board. See Fig. 2. Connect the otherend of the wire to the power supply.4. To check the electrodes for proper conductivity connect one voltmeter lead near a pushpin on an electrode. Touch the voltmeters second lead to other points on the sameelectrode. The MAXIMUM potential between any two points on the same electrode willnot exceed 1% of the potential applied between the two electrodes. i.e. 5.00 V vs. 4.99 V.5. EQUI<strong>POTENTIAL</strong>S These are plotted by connecting one lead of the voltmeter (theground) to one of the electrode push pins. This electrode now becomes the reference. Theother voltmeter lead (the probe) is used to measure the potential at any point on the papersimply by touching the probe to the paper at that point.To map an equipotential, move the probe until the desired potential is indicated on thevoltmeter. Mark the paper at this point with a soft lead pencil. Continue to move theprobe, but only in the direction which maintains the voltmeter at the same reading.Continue to mark these points. Connecting the points produces an equipotential line.6. FIELD GRADIENTS With field gradients neither lead of the voltmeter is connectedto an electrode. Instead place the leads on the black paper at a given separation. One cm.is a useful dimension. Measure the potential across the separation.N.B. Don't attempt to make measurements by putting the leads on the grid marks. Touchonly the solid black areas. It will also be necessary to use a higher voltmeter sensitivitysetting for field gradient studies.To record the field gradient on the paper, draw an arrow between the two points wherethe two voltmeter leads touch the paper. To indicate polarity, first wrap a piece of tape onone of the leads for identification. When the voltmeter reads a positive value, draw anarrowhead toward the tape. In this way, the polarity of all the arrows will be the same.Next to the arrow write the magnitude of the field gradient (the voltmeter reading).
Parallel plates1. Draw a thin line from one plate to the other,connecting the midpoints of the two plates.Make a graph of the potential along this line as a function of distance from one plate.Measure the distance from the plate to each of your measured equipotential surfaces witha ruler and USE GRAPHIC ANALYSIS to graph potentials vs. distances.2. Describe in words how the potential varies with distance on your graph.3. Give a formula that approximates the position dependance of the potential as shown byyour graph. HINTΦ = kdPoint source and guard ring1. Draw a thin line from the point sourse straight out to the guard ring. Make a graph ofthe potential along this lineas a function of distance from the point source. Measure thedistance from the point to each of your measured equipotential surfaces with a ruler andUSE GRAPHIC ANALYSIS to graph voltages vs. distances.2. Describe in words how the potential varies with distance on your graph.3. Very close to the point (within the first 1/4 of the radius of the guard ring) the potentialshould vary as 1/r. Sketch a line proportional to 1/r on a graph. Does it fit the measuredpotential near the point?4. Does the potential vary at all outside the guard ring?Opposite charges (an electric dipole)1. Describe the surface on which the potential is zero. What is its shape and where is itlocated?2. Where is the potential most negative? Most positive?3. What are the shapes of the equipotentials very close to each point?Like charges inside a box1. Where is the potential most negative? Most positive?2. What are the shapes of the equipotentials very close to each point?3. Does the potential vary at all outside the box?4. How do you think the equiptotentials far from the charges would be shaped if the boxwere not present?