Sunflower Production - NDSU Agriculture - North Dakota State ...
Sunflower Production - NDSU Agriculture - North Dakota State ...
Sunflower Production - NDSU Agriculture - North Dakota State ...

You also want an ePaper? Increase the reach of your titles
YUMPU automatically turns print PDFs into web optimized ePapers that Google loves.
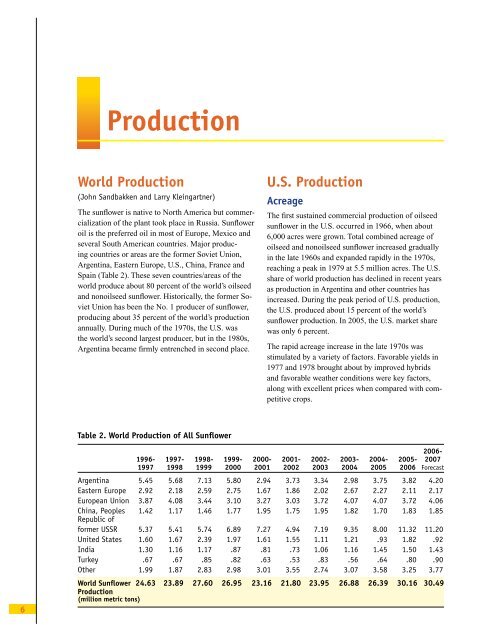
<strong>Production</strong>World <strong>Production</strong>(John Sandbakken and Larry Kleingartner)The sunflower is native to <strong>North</strong> America but commercializationof the plant took place in Russia. <strong>Sunflower</strong>oil is the preferred oil in most of Europe, Mexico andseveral South American countries. Major producingcountries or areas are the former Soviet Union,Argentina, Eastern Europe, U.S., China, France andSpain (Table 2). These seven countries/areas of theworld produce about 80 percent of the world’s oilseedand nonoilseed sunflower. Historically, the former SovietUnion has been the No. 1 producer of sunflower,producing about 35 percent of the world’s productionannually. During much of the 1970s, the U.S. wasthe world’s second largest producer, but in the 1980s,Argentina became firmly entrenched in second place.U.S. <strong>Production</strong>AcreageThe first sustained commercial production of oilseedsunflower in the U.S. occurred in 1966, when about6,000 acres were grown. Total combined acreage ofoilseed and nonoilseed sunflower increased graduallyin the late 1960s and expanded rapidly in the 1970s,reaching a peak in 1979 at 5.5 million acres. The U.S.share of world production has declined in recent yearsas production in Argentina and other countries hasincreased. During the peak period of U.S. production,the U.S. produced about 15 percent of the world’ssunflower production. In 2005, the U.S. market sharewas only 6 percent.The rapid acreage increase in the late 1970s wasstimulated by a variety of factors. Favorable yields in1977 and 1978 brought about by improved hybridsand favorable weather conditions were key factors,along with excellent prices when compared with competitivecrops.Table 2. World <strong>Production</strong> of All <strong>Sunflower</strong>62006-1996- 1997- 1998- 1999- 2000- 2001- 2002- 2003- 2004- 2005- 20071997 1998 1999 2000 2001 2002 2003 2004 2005 2006 ForecastArgentina 5.45 5.68 7.13 5.80 2.94 3.73 3.34 2.98 3.75 3.82 4.20Eastern Europe 2.92 2.18 2.59 2.75 1.67 1.86 2.02 2.67 2.27 2.11 2.17European Union 3.87 4.08 3.44 3.10 3.27 3.03 3.72 4.07 4.07 3.72 4.06China, Peoples 1.42 1.17 1.46 1.77 1.95 1.75 1.95 1.82 1.70 1.83 1.85Republic offormer USSR 5.37 5.41 5.74 6.89 7.27 4.94 7.19 9.35 8.00 11.32 11.20United <strong>State</strong>s 1.60 1.67 2.39 1.97 1.61 1.55 1.11 1.21 .93 1.82 .92India 1.30 1.16 1.17 .87 .81 .73 1.06 1.16 1.45 1.50 1.43Turkey .67 .67 .85 .82 .63 .53 .83 .56 .64 .80 .90Other 1.99 1.87 2.83 2.98 3.01 3.55 2.74 3.07 3.58 3.25 3.77World <strong>Sunflower</strong> 24.63 23.89 27.60 26.95 23.16 21.80 23.95 26.88 26.39 30.16 30.49<strong>Production</strong>(million metric tons)