Representation of Images Through Group-Delay ... - IEEE Xplore
Representation of Images Through Group-Delay ... - IEEE Xplore
Representation of Images Through Group-Delay ... - IEEE Xplore
You also want an ePaper? Increase the reach of your titles
YUMPU automatically turns print PDFs into web optimized ePapers that Google loves.
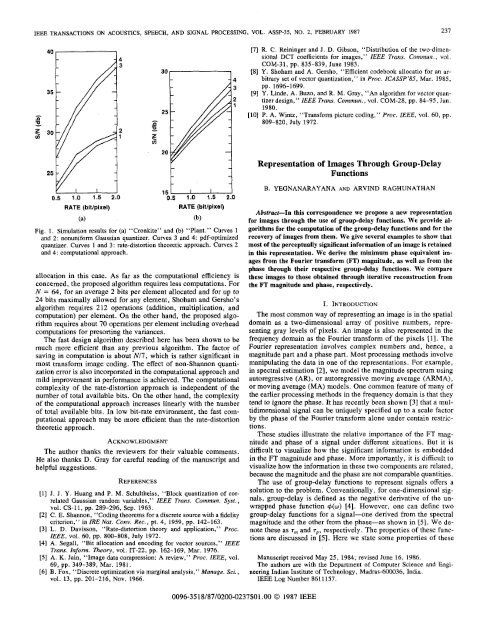
<strong>IEEE</strong>TRANSACTIONSACOUSTICS,SPEECH, AND SIGNAL PROCESSING, VOL. NO. ASSP-35, 2, FEBRUARY 1987 23740Li,RATE (bitlpixel)(a)ij.sFu)3025204321150.5 1.0 1.5 2.0RATE (bitlpixel)Fig. 1. Simulation results for (a) “Cronkite” and (b) “Plant.” Curves 1and 2: nonuniform Gaussian quantizer. Curves 3 and 4: pdf-optimizedquantizer. Curves 1 and 3: rate-distortion theoretic approach. Curves 2and 4: computational approach.allocation in this case. As far as the computational efficiency isconcerned, the proposed algorithm requires less computations. ForN = 64, for an average 2 bits per element allocated and for up to24 bits maximally allowed for any element, Shoham and Gersho’salgorithm requires 212 operations (addition, multiplication, andcomputation) per element. On the other hand, the proposed algorithmrequires about 70 operations per element including overheadcomputations for presorting the variances.The fast design algorithm described here has been shown to bemuch more efficient than any previous algorithm. The factor <strong>of</strong>saving in computation is about Nl7, which is rather significant in(b)most transform image coding. The effect <strong>of</strong> non-Shannon quantizationerror is also incorporated in the computational approach andmild improvement in performance is achieved. The computational autoregressive (AR), or autoregressive moving average (ARMA),complexity <strong>of</strong> the rate-distortion approach is independent <strong>of</strong> the or moving average (MA) models. One common feature <strong>of</strong> many <strong>of</strong>number <strong>of</strong> total available bits. On the other hand, the complexity the earlier processing methods in the frequency domain is that they<strong>of</strong> the computational approach increases linearly with the number tend to ignore the phase. It has recently been shown [3] that a mul<strong>of</strong>total available bits. In low bit-rate environment, the fast computationalapproach may be more efficient than the rate-distortiontheoretic approach.ACKNOWLEDGMENTThe author thanks the reviewers for their valuable comments.He also thanks D. Gray for careful reading <strong>of</strong> the manuscript andhelpful suggestions.REFERENCES[l] J. J. Y. Huang and P. M. Schultheiss, “Block quantization <strong>of</strong> correlatedGaussian random variables,” <strong>IEEE</strong> Trans. Commun. Syst.,vol. CS-11, pp. 289-296, Sep. 1963.[2] C. E. Shannon, “Coding theorems for a discrete source with a fidelitycriterion,” in IRE Nut. Conv. Rec., pt. 4, 1959, pp. 142-163.[3] L. D. Davisson, “Rate-distortion theory and application,” Proc.<strong>IEEE</strong>, VO~. 60, pp. 800-808, July 1972.[4] A. Segall, “Bit allocation and encoding for vector sources,” <strong>IEEE</strong>Trans. Inform. Theory, vol. IT-22, pp. 162-169, Mar. 1976.[5] A. K. Jain, “Image data compression: A review,” Proc. <strong>IEEE</strong>, vol.69, pp. 349-389, Mar. 1981.[6] B. Fox, “Discrete optimization via marginal analysis,” Manage. Sci.,VO~. 13, pp. 201-216, NOV. 1966.0096-351818710200-0237$01.00 0 1987 <strong>IEEE</strong>[7] R. C. Reininger and J. D. Gibson, “Distribution <strong>of</strong> the two-dimensionalDCT coefficients for images,” <strong>IEEE</strong> Trans. Commun., vol.COM-31, pp. 835-839, June 1983.[8] Y. Shoham and A. Gersho, “Efficient codebook allocatio for an arbitraryset <strong>of</strong> vector quantization,” in Proc. ICASSP’85, Mar. 1985,pp. 1696-1699.[9] Y. Linde, A. Buzo, and R. M. Gray, “An algorithm for vector quantizerdesign,” <strong>IEEE</strong> Trans. Commun., vol. COM-28, pp. 84-95, Jan.1980.[lo] P. A. Wintz, “Transform picture coding,” Proc. <strong>IEEE</strong>, vol. 60, pp.809-820, July 1972.<strong>Representation</strong> <strong>of</strong> <strong>Images</strong> <strong>Through</strong> <strong>Group</strong>-<strong>Delay</strong>FunctionsB. YEGNANARAYANA AND ARVIND RAGHUNATHANAbstract-In this correspondence we propose a new representationfor images through the use <strong>of</strong> group-delay functions. We provide algorithmsfor the computation <strong>of</strong> the group-delay functions and for therecovery <strong>of</strong> images from them. We give several examples to show thatmost <strong>of</strong> the perceptually significant information <strong>of</strong> an image is retainedin this representation. We derive the minimum phase equivalent imagesfrom the Fourier transform (FT) magnitude, as well as from thephase through their respective group-delay functions. We comparethese images to those obtained through iterative reconstruction fromthe FT magnitude and phase, respectively.I. INTRODUCTIONThe most common way <strong>of</strong> representing an image is in the spatialdomain as a two-dimensional array <strong>of</strong> positive numbers, representinggray levels <strong>of</strong> pixels. An image is also represented in thefrequency domain as the Fourier transform <strong>of</strong> the pixels [l]. TheFourier representation involves complex numbers and, hence, amagnitude part and a phase part. Most processing methods involvemanipulating the data in one <strong>of</strong> the representations. For example,in spectral estimation [2], we model the magnitude spectrum usingtidimensional signal can be uniquely specified up to a scale factorby the phase <strong>of</strong> the Fourier transform alone under centain restrictions.These studies illustrate the relative importance <strong>of</strong> the FT magnitudeand phase <strong>of</strong> a signal under different situations. But it isdifficult to visualize how the significant information is embeddedin the FT magnitude and phase. More importantly, it is difficult tovisualize how the information in these two components are related,because the magnitude and the phase are not comparable quantities.The use <strong>of</strong> group-delay functions to represent signals <strong>of</strong>fers asolution to the problem. Conventionally, for one-dimensional signals,groupAdelay is defined as the negative derivative <strong>of</strong> the unwrappedphase function d(o) [4]. However, one can define twogroup-delay functions for a signal-one derived from the spectralmagnitude and the other from the phase-as shown in [5]. We denotethese as r, and rp, respectively. The properties <strong>of</strong> these functionsare discussed in [5]. Here we state some properties <strong>of</strong> theseManuscript received May 25, 1984; revised June 16, 1986.The authors are with the Department <strong>of</strong> Computer Science and EngineeringIndian Institute <strong>of</strong> Technology, Madras-600036, India.<strong>IEEE</strong> Log Number 8611 157.
238 <strong>IEEE</strong> TRANSACTIONS ON ACOUSTICS. SPEECH, AND SIGNAL PROCESSING, VOL. ASSP-35, NO. 2, FEBRUARY 1987functions which <strong>of</strong>fer insight into the problem <strong>of</strong> image reconstruction.1) For a minimum phase signal, rm(w) = rp(w).2) For a maximum phase signal, r,(w) = -rp(w).3) For a mixed phase signal, lrm(w) I # 1~Jw)l.A mixed phase signal can be thought <strong>of</strong> as a convolution (in thetime domain) <strong>of</strong> its minimum and maximum phase components.This corresponds to addition in the group-delay domain.We develop the group-delay functions applicable for two-dimensionalsignals in Section 11, and discuss algorithms for theircomputation and for the recovery <strong>of</strong> images from them. We giveseveral examples <strong>of</strong> images (each 32 X 32 pixels) recovered fromtheir group-delay functions to demonstrate the validity <strong>of</strong> this representation.In Section I11 we derive the minimum phase equivalentimages from spectral magnitude and from phase through their respectivegroup-delay functions. We compare these images to thoseobtained through iterative reconstruction from the Fourier transformmagnitude and phase, respectively.11. THEORY OF GROUP-DELAY FUNCTIONSAn image is a two-dimensional signal represented as a two-dimensionalsequence or numbers x(nl, n,), nl = 0,1,2, . . ,N, - 1, and n2 = 0, 1, 2, . * . , N2 - 1. The Fourier transform <strong>of</strong>{x(nl, n2)} is given byNI-1 N2-1where O(w,, w2) is the principal value <strong>of</strong> phase and h(q, w2) is aninteger such that the overall phase becomes a continuous function<strong>of</strong> w1 and w,. The function4(wI, w2) = e(w,, w2) + NU,, w2) (2)is called the unwrapped phase function. It is assumed that IX(wl,w2)I # 0 for all w1 and w,. Consequences <strong>of</strong> this assumption willbe discussed later.Since there are two freqeuncy variables w, and w2, we definetwo group-delay functions from phase as follows:(a)Fig. 1. Image reconstruction from group-delay functions: example 1. (a)Original (32 X 32). (b) Signal reconstructed from group-delay functions.4) Compute the Fourier transforms <strong>of</strong> these two sequences toobtain r,, and rm2, respectively.To recover the spectral magnitude from rml and rm2, we combinethe two sets <strong>of</strong> cepstral coefficients [7] derived from r,, and T,~,respectively, and then compute the Fourier transform which yieldsthe log magnitude. The steps involved in the computation <strong>of</strong> thespectral magnitude from rml and rm2 are as follows.1) Compute {nlcl(nl, n,)} and {n2c2(nl, n,)}, the inverse Fouriertransform <strong>of</strong> r,] and rm2, respectively.2) Form the sequences (cl(nl, nz)] and {c2(nl, n2)} and makethem even symmetric.3) Compute the cepstral coefficients as follows.a) The first row <strong>of</strong> cepstral coefficients consists <strong>of</strong> those de-rived from rm2 in steps l) and 2).b) The first column <strong>of</strong> cepstral coefficients consists <strong>of</strong> thosederived from r,, is steps 1) and 2).c) The rest <strong>of</strong> the two-dimensional array is computed as theaverage <strong>of</strong> the two sets <strong>of</strong> cepstral coefficients.4) Take the inverse Fourier transform <strong>of</strong> the cepstral coefficientsto get the log magnitude. Exponentiate it to obtain the spectralmagnitude.Computation <strong>of</strong> rpl, and 7 is similar to the one-dimensional case,p?the algorithm for which is glven in [5]. The algorithm is based onthe following relations.(b)Although minimum phase function in two dimensions is not well where Y, is the Fourier transform on {nlx(nl, n,)] and Y2 is theunderstood, we use the term analogous to one-dimensional thecase. Fourier transform <strong>of</strong> {n2n(nl, n,)}. The subscript R stands for theIn particular, we call the phase function derived from the FT mag- real part <strong>of</strong> the Fourier transform and the subscript I stands for thenitude as the minimum phase function, and the signal obtained from imaginary part <strong>of</strong> the Fourier trasnform. The average values <strong>of</strong> thethe FT magnitude and the minimum phase function as the minimum group-delays rpl and rp2 give the linear phase components in thephase equivalent signal from spectral magnitude. Let +min(~I, w2) unwrapped phase function 4(wI, w2) along the axes w1 and w,, rebethe unique minimum phase function corresponding to I X(wl, spectively.w2)I, then we define two group-delay functions from +min(~l, w2) Recovery <strong>of</strong> phase from T~~ and rp2 is similar to the algorithmas follows:given above for recovering the log magnitude, with the differencethat we make the cepstral coefficients derived from the group-delayfunctions odd symmetric about the origin. Linear phase terms haveThe term “unique minimum phase function” is used here in thesense that the cepstral coefficients {c(nl, n2)} derived from lnjX(wl,w2) I determine the magnitude and phase functions completely. Wenow describe algorithms to compute the two-dimensional groupdelayfunctions. The algorithms are based on the computation <strong>of</strong>the cepstral coefficients used in [6] and [7]. The algorithm for thecomputation <strong>of</strong> rml and rm2 thus consists <strong>of</strong> the following steps.1) Compute X(w,, w2), the Fourier transform <strong>of</strong> (x(nl, n2)>.2) Take the inverse Fourier transform <strong>of</strong> lnlX(ol, wz)l to obtain{c(nl, n2)}, the cepstral coefficients. Note that whenever IX(wl,w2)1 5 E , then IX(wl, 02)1 is set equal to E, where E is a smallpositive quantity.3) Form the two-dimensional sequences (nlc(nl, n2)} and(n2c(nl, n,)} and make them even symmetric about the origin.to be added along the two axes to recover the phase from the groupdelayfunctions.Fig. l(a) shows a picture, and Fig. l(b) shows the image reconstructedfrom the group-delay functions derived from the originalpicture. We notice that the reconstructed image looks almost likethe original. Figs. 2 and 3 show the original and the reconstructedimages for two other pictures. These examples demonstrate that thegroup-delay representation is adequate for a wide variety <strong>of</strong> pictures,despite the problems in computing the group-delay functionsfor real signals due to very small values <strong>of</strong> 1x1 at some frequencypoints.111. MINIMUM PHASE EQUIVALENT IMAGESWe propose in this section noniterative algorithms for the reconstruction<strong>of</strong> the minimum phase equivalent images from spectralmagnitude or phase.
<strong>IEEE</strong> TRANSACTIONS ON ACOUSTICS, SPEECH, AND SIGNAL PROCESSING, VOL. ASSP-35, NO. 2, FEBRUARY 1987 239(a)Fig. 2. Image reconstruction from group-delay functions: example 2. (a)Original (32 X 32). (b) Signal reconstructed from group-delay functions.(b)(a)(h)Fig. 3. Image reconstruction from group-delay functions: example 3. (a)Original (32 X 32). (b) Signal reconstructed from group-delay functions.(a) (h) (c)Fig. 4. Image reconstruction from FT magnitude. (a) Original. (h) Minimumphaseequivalent image from FT magnitude. (b) Iterative imagereconstruction from FT magnitude.The proposed algorithm is as follows.1) Compute the group-delay functions from the spectral magnitudeor phase as the case may be.2) Set the group-delay functions from phase and magnitudeequal. That is, r,, = rpl and rm2 = TP2.3) Recover the phase and spectral magnitude by the algorithmdescribed in the previous section.4) Perform an inverse Fourier transform operation to reconstructthe image.In Fig. 4(a) we show a picture, and in Fig. 4(b) the minimumphase equivalent image reconstructed from the spectral magnitudealong for this picture. A confusing picture is obtained, demonstratingthat the minimum phase equivalent signal derived from thespectral magnitude alone does not contain sufficient information <strong>of</strong>the picture. Similar conclusion can be drawn from the image reconstructediteratively from the spectral magnitude as shown in Fig.4(c) [3]. In Fig. 5(a) we show another picture which approximatesa'minimum phase signal, and in Fig. 5(b) we show the image re-constructed from the spectral magnitude alone. It looks almost likethe original, showing that, for minimum phase signals (Le., whenmost <strong>of</strong> the signal energy is concentrated near the origin), the spectralmagnitude contains most <strong>of</strong> the significant information. Fig. 6shows the original picture, the minimum phase equivalent imagereconstructed from phase alone, and the image reconstructed iter-atively from phase alone by the algorithm described in [3]. Notethat the latter two are not identical as discussed in [5] for the onedimensionalcase. Fig. 6(b) and Fig. 4(b) also show that for somepictures important features <strong>of</strong> the original picture are retained inthe minimum phase equivalent image derived from phase, but notin the image derived from the spectral magnitude.IV. CONCLUSIONSIn this correspondence we have proposed a new representationfor images through group-delay functions. This representation doesnot involve loss <strong>of</strong> significant information. Our results also showthe importance <strong>of</strong> phase in images. There are several computational
240 <strong>IEEE</strong> TRANSACTIONS ON ACOUSTICS, SPEECH, AND SIGNAL PROCESSING, VOL. ASSP-35, NO. 2, FEBRUARY 1987(a)(b)Fig. 5. Image reconstruction from FT magnitude: approximate minimumphase signal. (a) Original. (b) Minimum phase equivalent image fromFT magnitude.(a) (b) (C)Fig. 6. Image reconstruction from FT phase.phase equivalent image from FT phase.tion from FT phase.(a) Original. (b) Minimum(c) Iterative image reconstruc-issues which have not been specifically addressed here. In particular,we do not have a good method <strong>of</strong> handling the cases wherethe signal spectrum is nearly zero at some frequencies.The advantage <strong>of</strong> the group-delay representation is that it allowsmanipulation <strong>of</strong> the information contained in phase. We are currentlyexploring the possibility <strong>of</strong> using this method <strong>of</strong> phase processingfor image reconstruction, enhancement, and restoration.REFERENCES111 A. Rosenfeld and A. C. Kak, Digital Picture Processing, vol. 1. NewYork: Academic, 1982.[2] S. M. Kay and S. D. Maple, “Spectrum analysis-A modern perspective,”Proc. <strong>IEEE</strong>, vol. 69, pp. 1380-1418, Nov. 1981.[3] M. H. Hayes, “The reconstruction <strong>of</strong> a multidimensional sequencefrom phase or magnitude <strong>of</strong> its Fourier transform,” <strong>IEEE</strong> Trans.Acoust., Speech, Signal Processing, vol. ASSP-30, pp. 140-154,Apr. 1982.[4] A. V. Oppenheim and R. W. Schafer, Digital Signul Processing.Englewood-Cliffs, NJ: Prentice-Hall, 1975, ch. 10.[SI B. Yegnanarayana, D. K. Saikia, and T. R. Krishnan, “Significance<strong>of</strong> group-delay functions in signal reconstruction from spectral magnitudeor phase,” <strong>IEEE</strong> Trans. Acoust., Speech, Signal Processing,vol. ASSP-32, pp. 610-623, June 1984.[6] B. Bhanu, “Computation <strong>of</strong> two-dimensional complex cepstrum,” inProc. <strong>IEEE</strong> Int. ConJ Acoust., Speech, Signal Processing, vol. 3,1982,pp. 140-143.[7] D. E. Dugeon, “The computation <strong>of</strong> two-dimensional cepstrum,”<strong>IEEE</strong> Trans. Acoust., Speech, Signal Processing, vol. ASSP-25, pp.476-484, Dec. 1977.


