A pattern recognition approach to VAD using modified ... - Publications
A pattern recognition approach to VAD using modified ... - Publications
A pattern recognition approach to VAD using modified ... - Publications

Create successful ePaper yourself
Turn your PDF publications into a flip-book with our unique Google optimized e-Paper software.
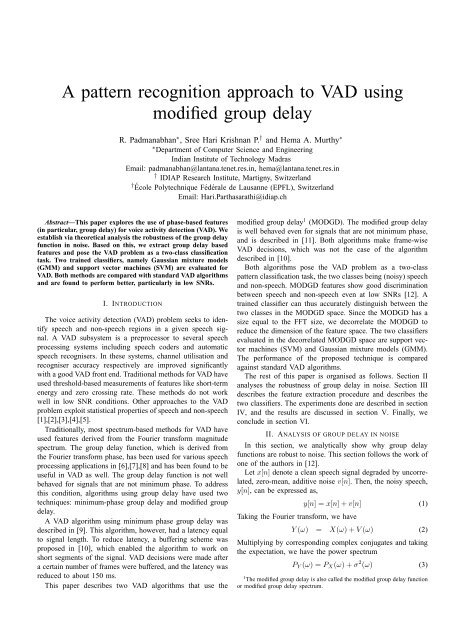
A <strong>pattern</strong> <strong>recognition</strong> <strong>approach</strong> <strong>to</strong> <strong>VAD</strong> <strong>using</strong><strong>modified</strong> group delayR. Padmanabhan ∗ , Sree Hari Krishnan P. † and Hema A. Murthy ∗∗ Department of Computer Science and EngineeringIndian Institute of Technology MadrasEmail: padmanabhan@lantana.tenet.res.in, hema@lantana.tenet.res.in† IDIAP Research Institute, Martigny, Switzerland† École Polytechnique Fédérale de Lausanne (EPFL), SwitzerlandEmail: Hari.Parthasarathi@idiap.chAbstract—This paper explores the use of phase-based features(in particular, group delay) for voice activity detection (<strong>VAD</strong>). Weestablish via theoretical analysis the robustness of the group delayfunction in noise. Based on this, we extract group delay basedfeatures and pose the <strong>VAD</strong> problem as a two-class classificationtask. Two trained classifiers, namely Gaussian mixture models(GMM) and support vec<strong>to</strong>r machines (SVM) are evaluated for<strong>VAD</strong>. Both methods are compared with standard <strong>VAD</strong> algorithmsand are found <strong>to</strong> perform better, particularly in low SNRs.I. INTRODUCTIONThe voice activity detection (<strong>VAD</strong>) problem seeks <strong>to</strong> identifyspeech and non-speech regions in a given speech signal.A <strong>VAD</strong> subsystem is a preprocessor <strong>to</strong> several speechprocessing systems including speech coders and au<strong>to</strong>maticspeech recognisers. In these systems, channel utilisation andrecogniser accuracy respectively are improved significantlywith a good <strong>VAD</strong> front end. Traditional methods for <strong>VAD</strong> haveused threshold-based measurements of features like short-termenergy and zero crossing rate. These methods do not workwell in low SNR conditions. Other <strong>approach</strong>es <strong>to</strong> the <strong>VAD</strong>problem exploit statistical properties of speech and non-speech[1],[2],[3],[4],[5].Traditionally, most spectrum-based methods for <strong>VAD</strong> haveused features derived from the Fourier transform magnitudespectrum. The group delay function, which is derived fromthe Fourier transform phase, has been used for various speechprocessing applications in [6],[7],[8] and has been found <strong>to</strong> beuseful in <strong>VAD</strong> as well. The group delay function is not wellbehaved for signals that are not minimum phase. To addressthis condition, algorithms <strong>using</strong> group delay have used twotechniques: minimum-phase group delay and <strong>modified</strong> groupdelay.A <strong>VAD</strong> algorithm <strong>using</strong> minimum phase group delay wasdescribed in [9]. This algorithm, however, had a latency equal<strong>to</strong> signal length. To reduce latency, a buffering scheme wasproposed in [10], which enabled the algorithm <strong>to</strong> work onshort segments of the signal. <strong>VAD</strong> decisions were made aftera certain number of frames were buffered, and the latency wasreduced <strong>to</strong> about 150 ms.This paper describes two <strong>VAD</strong> algorithms that use the<strong>modified</strong> group delay 1 (MODGD). The <strong>modified</strong> group delayis well behaved even for signals that are not minimum phase,and is described in [11]. Both algorithms make frame-wise<strong>VAD</strong> decisions, which was not the case of the algorithmdescribed in [10].Both algorithms pose the <strong>VAD</strong> problem as a two-class<strong>pattern</strong> classification task, the two classes being (noisy) speechand non-speech. MODGD features show good discriminationbetween speech and non-speech even at low SNRs [12]. Atrained classifier can thus accurately distinguish between thetwo classes in the MODGD space. Since the MODGD has asize equal <strong>to</strong> the FFT size, we decorrelate the MODGD <strong>to</strong>reduce the dimension of the feature space. The two classifiersevaluated in the decorrelated MODGD space are support vec<strong>to</strong>rmachines (SVM) and Gaussian mixture models (GMM).The performance of the proposed technique is comparedagainst standard <strong>VAD</strong> algorithms.The rest of this paper is organised as follows. Section IIanalyses the robustness of group delay in noise. Section IIIdescribes the feature extraction procedure and describes thetwo classifiers. The experiments done are described in sectionIV, and the results are discussed in section V. Finally, weconclude in section VI.II. ANALYSIS OF GROUP DELAY IN NOISEIn this section, we analytically show why group delayfunctions are robust <strong>to</strong> noise. This section follows the work ofone of the authors in [12].Let x[n] denote a clean speech signal degraded by uncorrelated,zero-mean, additive noise v[n]. Then, the noisy speech,y[n], can be expressed as,Taking the Fourier transform, we havey[n] = x[n] + v[n] (1)Y (ω) = X(ω) + V (ω) (2)Multiplying by corresponding complex conjugates and takingthe expectation, we have the power spectrumP Y (ω) = P X (ω) + σ 2 (ω) (3)1 The <strong>modified</strong> group delay is also called the <strong>modified</strong> group delay functionor <strong>modified</strong> group delay spectrum.
where we have used the fact that the expectation of noise iszero. The power spectra of the resulting noisy speech signalcan be related <strong>to</strong> noise power and (clean) speech power inone of three mutually exclusive frequency regions: (i) the highnoise power case where P X (ω) ≪ σ 2 (ω) (ii) the high signalpower case where P X (ω) ≫ σ 2 (ω) and (iii) the equal powercase where P X (ω) ≈ σ 2 (ω). Following the same notation asin [12], the power spectra of the noisy speech signal in eachcase are denoted respectively as P n Y (ω), P s Y (ω) and P e Y (ω).We analyse the group delay representation of noisy speech inthe three cases mentioned above.A. High noise power spectral regions (P n Y (ω))In this subsection, we consider frequencies ω such thatP X (ω) ≪ σ 2 (ω), i.e., regions where the noise power is higherthan signal power. From Equation 3 we haveP n Y (ω) = P Y (ω) ∀ω s.t. P X (ω) ≪ σ 2 (ω)= P X (ω) + σ 2 (ω)(= σ 2 (ω) 1 + P )X(ω)σ 2 (ω)Taking logarithms on both sides, <strong>using</strong> the Taylor seriesexpansion 2 of ln(1 + PX(ω)σ 2 (ω)), and ignoring the higher orderterms,[ (ln (PY n (ω)) = ln σ 2 (ω) 1 + P )]X(ω)σ 2 (ω)= ln ( σ 2 (ω) ) (+ ln 1 + P )X(ω)σ 2 (ω)≈ ln ( σ 2 (ω) ) + P X(ω)σ 2 (4)(ω)Expanding P X (ω) as a Fourier series (P X (ω) is a periodic, where d k and e k are the Fourier series coefficients ofcontinuous, function of ω with a period ω 0 = 2π),1ln (PY n (ω)) ≈ ln ( σ 2 (ω) ) [+ 1∞d 0σ 2 (ω) 2 + ∑( ) ] ln(P X (ω)) andP X(ω)respectively. It is satisfying <strong>to</strong> observe2πthat if σ 2 (ω) is negligible, the group delay function can bed k cos ω k expressed solely in terms of log-magnitude spectrum.ω 0k=1(5)C. Signal power ≈ noise power regions (PY e where, d k are the Fourier series coefficients in the expansionof P X (ω). Since P X (ω) is an even function, coefficients ofthe sine terms are zero.For a minimum phase signal, the group delay function canbe computed in terms of the cepstral coefficients of the logmagnitudeFor frequencies ω such that P X (ω) ≈ σ 2 (ω), we againstart with Equation (3), and follow the steps similar <strong>to</strong> thosein previous subsections, except in this case we do not needthe Taylor series expansion:spectrum, as given in [7],log |X(ω)| = a ∞PY e (ω) ≈ 2P X (ω)02 + ∑a k cos(ω k)ln (PY e (ω)) ≈ ln 2 + ln (P X (ω)) (10)τ(ω) =k=1∞∑k a k cos(ω k) (6)k=1where, τ is the group delay function and a k are the cepstralcoefficients. From (6), it can be observed that the group delayfunction can be obtained from the log-magnitude response byignoring the dc term, and by multiplying each coefficient with2 Taylor series expansion of ln(1 + x) is: ln(1 + x) =P ∞ (−1) nn=0 n+1 xn+1 |x| < 1k. Applying this observation <strong>to</strong> Equation (5), we get the groupdelay function as:τ Y n(ω) ≈ 1σ 2 (ω)∞∑k d k cos(ω k) (7)k=1This expression shows that the group delay function is inverselyproportional <strong>to</strong> the noise power (σ 2 (ω)) in regionswhere noise power is greater than the signal power.B. High signal power spectral regions (P s Y (ω))Now consider frequencies ω such that P X (ω) ≫ σ 2 (ω).Starting with Equation (3), and following the steps similar <strong>to</strong>those in previous subsection:ln (P s Y (ω)) ≈ ln (P X (ω)) + σ2 (ω)P X (ω)1Since P X (ω) is non-zero, continuous, and periodic in ω,P X(ω)is also periodic and continuous. Consequently, ln(P X (ω)) and1P X(ω)can be expanded <strong>using</strong> Fourier series, givingln (P s Y (ω)) ≈ d 0 + σ 2 (ω)e 02+(8)∞∑ (dk + σ 2 )(ω)e k cos(ω k)k=1Using the properties of group delay function listed in Equation(6), and following the steps in the previous case 3 , we obtainthe expression for the group delay function as,τ Y s(ω) ≈∞∑k (d k + σ 2 (ω)e k )cos(ω k) (9)k=1Expanding ln (P X (ω)) as a Fourier series, since it is a periodic,continuous, function of ω with a period 2π, the groupdelay function can be computed as,τ Y e(ω) ≈∞∑k d k cos(ω k) (11)k=1where d k are the Fourier series coefficients of ln(P X (ω)).3 Ignoring the dc term, and multiplying each coefficient with k
D. Behaviour of minimum phase group delay functions innoiseFrom Equations 7, 9, and 11, the estimated group delayfunctions are summarised respectively for the three cases:⎧ ∑1 ∞⎪⎨ σ 2 (ω) k=1 k d k cos(ω k)∑τ(ω) ≈ ∞k=1 ⎪⎩k (d k + σ 2 (ω)e k )cos(ω k) (12)∑ ∞k=1 k d k cos(ω k)where the first case is for ∀ω such that P X (ω) ≪ σ 2 (ω),the second for ∀ω such that P X (ω) ≫ σ 2 (ω), and the thirdfor ∀ω such that P X (ω) ≈ σ 2 (ω). From Equation 12, wenote that the group delay function of a minimum phase signalis inversely proportional <strong>to</strong> the noise power for frequenciescorresponding <strong>to</strong> high noise regions in the power spectrum.Similarly, for low noise regions, from Equation 9, the groupdelay function becomes directly proportional <strong>to</strong> the signalpower. In other words, its behaviour is similar <strong>to</strong> that of themagnitude spectrum. This shows that the group delay functionof a minimum phase signal preserves the peaks and valleys inthe magnitude spectrum well even in the presence of additivenoise.E. The <strong>modified</strong> group delay functionPractically, a frame of speech is typically non-minimumphase, due <strong>to</strong> the zeros introduced by nasals, pitch and theanalysis window. Thus, the above analysis is directly applicableonly <strong>to</strong> the minimum phase components derived fromspeech signals. To overcome this, we use the <strong>modified</strong> groupdelay (MODGD), which is an approximation <strong>to</strong> the minimumphase group delay. Using the <strong>modified</strong> group delay enablescomputation of the group delay even when the signal is notminimum phase [11].F. The <strong>modified</strong> group delay featureThe <strong>modified</strong> group delay feature or MODGDF (also called<strong>modified</strong> group delay cepstra) is formed by converting the<strong>modified</strong> group delay (MODGD) in<strong>to</strong> cepstral features <strong>using</strong>the discrete cosine transform [11]. This results in featuresthat are linearly decorrelated. When compared <strong>to</strong> MODGDfeatures, MODGDF features can be of considerably lowerdimension. Experimental observations reveal that MODGDFfeatures have different characteristics for speech and nonspeech.III. <strong>VAD</strong> AS A PATTERN CLASSIFICATION TASKThe previous section established that spectral features areretained for speech and non-speech regions in the MODGDFdomain, even at low SNRs. This encourages the use ofstandard classifiers <strong>to</strong> discriminate between a frame of speechand a frame of non-speech.A. Feature extractionFor each frame of speech, the MODGDF feature is extractedas given in [11]:1) Compute the DFT of the speech signal x[n] as X[k].2) Next, the DFT of the speech signal nx[n] is computedas Y [k].3) Compute the cepstrally smoothed spectra of X[k] anddenote it as S[k].4) Compute the MODGD feature as:τ m [k] = ( τ[k]|τ[k]| )(|τ[k]|)α (13)where τ[k] = XR[k]YR[k]+XI[k]YI[k]|S[k]|with the parameters2γα and γ being set <strong>to</strong> 1.5) Compute the MODGDF feature by taking the DCT:c[n] =k=N∑ fk=0τ m [k]cos(n(2k + 1)π/N f ) (14)where N f is the DFT size. Also, for every frame, the featurevec<strong>to</strong>r is averaged with the feature vec<strong>to</strong>rs of the past twoframes.B. Using Gaussian mixture modelsA simple classifier, namely Gaussian mixture models(GMMs) can be used <strong>to</strong> classify MODGDF features extractedfrom speech or non-speech. During the training phase, GMMmodels are built for speech and non-speech <strong>using</strong> training data.During the testing phase, MODGDF features extracted from aframe of speech are classified as speech or non-speech <strong>using</strong>the GMM models. A <strong>VAD</strong> decision is thus made for a givenframe of speech. The above algorithm is called GMM-<strong>VAD</strong>.C. Using support vec<strong>to</strong>r machinesFollowing [13], a support vec<strong>to</strong>r machine (SVM) wastrained on labelled MODGDF features derived from trainingexamples of the two classes. Similar <strong>to</strong> GMM-<strong>VAD</strong>, in thetesting phase, MODGDF features extracted from a frame ofspeech are classified as speech or non-speech <strong>using</strong> the SVMmodels. This algorithm is called SVM-<strong>VAD</strong>.IV. EXPERIMENTAL SETUPTo compare results, the same experimental setup as in [10]was used. 432 speech files (216 female, 216 male), wereobtained by concatenating sets of three individual speechutterances from TIMIT [14]. To model the typical speechactivity over a telephone conversation, silence was inserted sothat the ratio of silence <strong>to</strong> speech is 60:40 [15]. Three differenttypes of noise (babble, pink and white) from the NOISEX-92[16] database were added resulting in twelve test-sets, eachhaving 0, 5, 10, or 15 dB SNR respectively.A. Evaluation of GMM-<strong>VAD</strong>The number of cepstral coefficients used in the MODGDFwas 32. The training data had an overall SNR of 10 dB.Speech–non-speech GMM pairs were built for each noise typeand the test data was evaluated for each. The optimum numberof mixtures for each GMM were determined experimentally.The results are given in Table III.
B. Evaluation of SVM-<strong>VAD</strong>The SVM implementation used was SVM-Torch [17]. ThreeSVM models were built for the three different noise types. Thetraining data had an overall SNR of 10 dB. Optimum <strong>VAD</strong>performance is obtained when speech frames corrupted with aparticular type of noise is classified <strong>using</strong> that particular SVMmodel. The results are tabulated in Table III.V. RESULTS AND DISCUSSIONSThe performance of the algorithms were evaluated by comparingthe percentage of correct classifications (non-speechand speech) with manually marked decisions on all the 432test utterances. The performance metrics P cn (percentageof correct non-speech identification ie. insertion error), P cs(percentage of correct speech identification ie. clipping error)and P f (percentage of false detection) described in [15] aredefined below.No. of non-speech frames from algorithm × 100P cn =No. of non-speech frames in manual <strong>VAD</strong>No. of speech frames from algorithm × 100P cs =No. of speech frames in manual <strong>VAD</strong>No. of misclassified frames by algorithm × 100P f =Total no. of framesThe performance of the <strong>modified</strong> group delay based GMM-<strong>VAD</strong> and SVM-<strong>VAD</strong> algorithms are tabulated in Table III. Theperformance of three standard <strong>VAD</strong> algorithms, namely G.729Annexe B <strong>VAD</strong>, AMR <strong>VAD</strong> option 1 and AMR <strong>VAD</strong> option2 are given in Table II.The results are summarised below:1) The group delay based <strong>VAD</strong> algorithms SVM-<strong>VAD</strong>and GMM-<strong>VAD</strong> outperform the standard algorithmsG.729B, AMR <strong>VAD</strong> option 1 and AMR <strong>VAD</strong> option2 in babble noise.2) SVM-<strong>VAD</strong> performs comparably with AMR <strong>VAD</strong> option2 in pink and white noise, and outperforms G.729Band AMR option 1.3) GMM-<strong>VAD</strong> performs comparably with AMR <strong>VAD</strong> option1 in pink and white noise and outperforms G.729B.The average error for each method in each noise type andthe relative computation speed is given in Table I. The timetaken by the fastest method is denoted by 1. The other timesare in multiples of this. The SVM based method requirescomputation of support vec<strong>to</strong>rs in the kernel space for eachframe and hence requires more computation. At the time ofthis writing, it is not clear why group delay based featureswork well in babble noise. Future investigations will addressthis issue.VI. CONCLUSIONIn this paper, the <strong>VAD</strong> problem was viewed as a classificationtask in the <strong>modified</strong> group delay space. An analysisof the group delay based representation showed its robustness<strong>to</strong> noise. Two algorithms, <strong>using</strong> SVMs and GMMs respectively,were described and evaluated against standard <strong>VAD</strong>TABLE ISUMMARY OF <strong>VAD</strong> SCHEMES.<strong>VAD</strong> ErrorMethod E babble % E white % E pink % SpeedG.729B 31.75 17.18 16.37 1.04AMR1 22.01 10.97 9.58 1AMR2 32.11 5.57 5.21 1.08GMM 7.17 8.33 8.58 1.26SVM 5.75 6.21 6.32 6.87TABLE IIIPERFORMANCE OF PROPOSED <strong>VAD</strong> METHODS IN DIFFERENT NOISEENVIRONMENTS.Method GMM-<strong>VAD</strong> SVM-<strong>VAD</strong>SNR (dB) P cn% P cs% P f % P cn% P cs% P f %Babble noise environment0 95.86 79.26 10.88 96.19 85.49 8.155 95.93 88.43 7.11 96.00 92.82 5.2910 95.04 93.85 5.43 95.40 96.48 4.1515 93.43 96.65 5.26 92.03 98.35 5.39Average 95.07 89.55 7.17 94.90 93.29 5.75White noise environment0 90.57 85.77 11.37 96.68 80.64 9.835 91.95 90.22 10.11 96.74 88.57 6.5710 92.65 94.11 6.84 96.35 94.62 4.3415 90.59 97.86 6.44 94.59 97.84 4.08Average 91.44 91.99 8.33 96.10 90.42 6.21Pink noise environment0 91.31 80.41 13.11 96.55 80.59 9.935 94.26 85.22 9.41 97.14 87.74 6.6710 95.15 91.05 6.52 96.96 93.18 4.5715 94.44 95.09 5.29 95.39 96.58 4.12Average 93.79 87.94 8.58 96.51 89.59 6.32Average environmentAvg 93.43 89.82 8.03 95.83 91.10 6.09algorithms. In babble noise, the group delay based algorithmsoutperform the standard algorithms, whereas in pink andwhite noise their performances are better or comparable. Thisdemonstrates the robustness of phase-based methods <strong>to</strong> noisefor a feature discrimination task. The paper also shows that<strong>pattern</strong> classification <strong>approach</strong>es <strong>to</strong> <strong>VAD</strong> show encouragingresults.REFERENCES[1] J. Sohn, N. S. Kim, and W. Sung, “A statistical model-based voiceactivity detection,” IEEE Signal Process. Lett., vol. 6, pp. 1–3, 1999.[2] Y. D. Cho and A. Kondoz, “Analysis and improvement of a statisticalmodel-based voice activity detec<strong>to</strong>r,” IEEE Signal Process. Lett, vol. 8,pp. 276–278, 2001.[3] J. Sohn and W. Sung, “A Voice Activity Detec<strong>to</strong>r employing softdecision based noise spectrum adaptation,” ICASSP, vol. 1, pp. 365–368, 1998.[4] S. G. Tanyer and H. Ozer, “Voice activity detection in nonstationarynoise,” IEEE Trans. Speech Audio Process., vol. 8, p. 478482, 2000.[5] K. Li, M. N. S. Swamy, and M. O. Ahmad, “An improved voiceactivity detection <strong>using</strong> higher order statistics,” IEEE Trans. SpeechAudio Process, vol. 13, 2005.[6] H. A. Murthy and B. Yegnanarayana, “Formant extraction from minimumphase group delay function,” Speech Comm, pp. 209–221, 1991.[7] B. Yegnanarayana, D. K. Saikia, and T. R. Krishnan, “Significance ofgroup delay functions in signal reconstruction from spectral magnitudeor phase,” IEEE Transactions on Acoustics, Speech and Signal Processing,pp. 610–622, Jun. 1984.
TABLE IIPERFORMANCE OF STANDARD <strong>VAD</strong> METHODS IN DIFFERENT NOISE ENVIRONMENTS.Method G.729B <strong>VAD</strong> AMR <strong>VAD</strong> 1 AMR <strong>VAD</strong> 2SNR (dB) P cn% P cs% P f % P cn% P cs% P f % P cn% P cs% P f %Babble noise environment0 65.33 57.32 37.87 47.82 95.75 33.01 44.59 95.66 34.985 65.45 68.28 33.42 56.9 97.5 26.86 42.78 99.13 34.6810 65.33 77.47 29.81 72.27 97.26 17.73 45.49 99.7 32.8315 65.87 86.43 25.91 84.52 97.15 10.43 57.09 99.55 25.93Average 65.5 72.38 31.75 65.38 96.92 22.01 47.49 98.51 32.11White noise environment0 89.54 54.27 24.57 87.53 67.58 20.45 94.76 89.05 7.525 89.47 66.82 19.59 90.29 84.66 11.96 93.69 96.43 5.2110 89.33 77.47 15.41 92.4 93.45 7.18 93.23 97.95 4.8815 93.11 87.43 9.16 95.65 95.78 4.3 93.00 98.79 4.68Average 90.36 71.5 17.18 91.47 85.37 10.97 93.67 95.56 5.57Pink noise environment0 89.50 60.52 22.09 89.64 69.24 18.52 95.07 91.40 6.45 88.84 71.48 18.1 92.64 86.27 9.91 93.67 97.23 4.9110 89.38 81.43 13.8 94.79 93.08 5.89 93.46 98.31 4.615 88.40 88.65 11.5 95.61 96.63 3.98 92.27 99.28 4.93Average 89.03 75.52 16.37 93.17 86.31 9.58 93.62 96.56 5.21Average environmentAverage 81.63 73.13 21.77 83.34 89.53 14.19 78.26 96.87 14.3[8] V. Prasad, T.Nagarajan, and H. A. Murthy, “Au<strong>to</strong>matic segmentation ofcontinuous speech <strong>using</strong> minimum phase group delay functions,” SpeechComm, vol. 42, pp. 429–446, 2004.[9] S. H. K. P., R. Padmanabhan, and H. A. Murthy, “Robust voice activitydetection <strong>using</strong> group delay functions,” IEEE ICIT, 2006.[10] ——, “Voice activity detection <strong>using</strong> group delay processing on bufferedshort-term energy,” NCC, 2007.[11] R. M. Hegde, H. A. Murthy, and V. R. R. Gadde, “Significance of the<strong>modified</strong> group delay feature in speech <strong>recognition</strong>,” IEEE Trans. Audio,Speech and Language Processing, vol. 15, pp. 190–202, 2007.[12] S. H. K. P., “Voice activity detection <strong>using</strong> group delay functions,”Master’s thesis, Indian Institute of Technology, Madras, 2007.[13] D. Enqing, L. Guizhong, Z. Ya<strong>to</strong>ng, and Z. Xiaodi, “Applying supportvec<strong>to</strong>r machines <strong>to</strong> voice activity detection,” Proc. 6th InternationalConference on Signal Process., vol. 2, pp. 1124–1127, 2002.[14] NTIS, The DARPA TIMIT Acoustic-Phonetic Continuous Speech Corpus,1993.[15] B. F., C. S., and R. G., “Performance evaluation and comparison ofitu-t/etsi voice activity detec<strong>to</strong>rs,” Proceedings of ICASSP, vol. 3, pp.1425–1428, 2001.[16] “NOISEX-92,” http://www.speech.cs.cmu.edu/comp.speech/Section1/Data/noisex.html, database of various type of noise available onCD-ROM.[17] R. Collobert and S. Bengio, “SVMTorch: Support Vec<strong>to</strong>r Machinesfor Large-Scale Regression Problems,” Journal of Machine LearningResearch, vol. 1, pp. 143–160, 2001.