Review Sheet - Modeling Physics
Review Sheet - Modeling Physics
Review Sheet - Modeling Physics

Create successful ePaper yourself
Turn your PDF publications into a flip-book with our unique Google optimized e-Paper software.
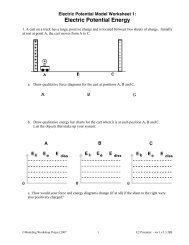
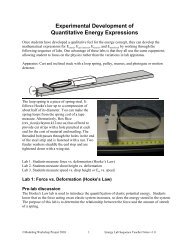
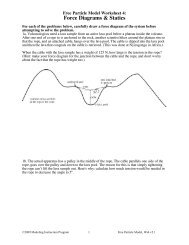
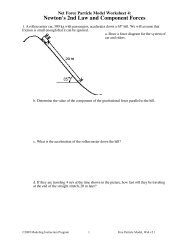
NameConstant Velocity Particle Model:<strong>Review</strong> <strong>Sheet</strong>DatePd1. Consider the following position vs. time graph.a. Determine the average velocity of the object.b. Write a mathematical model to describe the motion of theobject.2. Shown below is a velocity vs. time graph for an object.a. Describe the motion of the object.b. Draw a corresponding position vs. time graph. Number the axes. You may assume the object startsfrom the origin.c. How far did the object travel in the interval t =1s to t =2s?d. Find the displacement from t = 0s to t = 5 s. Explain howyou got your answer.©<strong>Modeling</strong> Instruction 2010 1 U2 Constant Velocity - <strong>Review</strong> <strong>Sheet</strong> v3.0
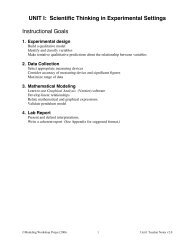
e. Find the average velocity from t = 0s to t = 5 s. Explain how you got your answer.f. Find the average speed from t = 0s to t = 5 s. Explain how you got your answer.3. A bird travels toward the origin, then suddenly reverses direction.a. Find the average velocity fromt = 30s to t = 40s.b. Find the average velocity fromt = 40s to t = 50s.c. Determine the average speed from t = 30s to t = 50s.d. Determine the average velocity from t = 30s to t = 50s.e. Find the velocity at t = 35 seconds.©<strong>Modeling</strong> Instruction 2010 2 U2 Constant Velocity - <strong>Review</strong> <strong>Sheet</strong> v3.0
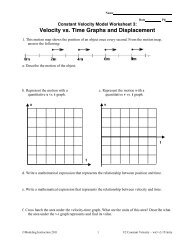
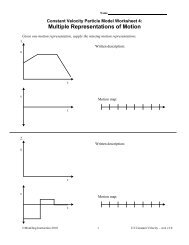
6. Rank the following:x (m)Ax (m)Bx (m)C250010t (s)50010t (s)100010t (s)x (m)10Dx (m)15Ex (m)10F530010t (s)0010t (s)003 10t (s)a. Rank the graphs according to which show the greatest average velocity from the beginning tothe end of the motion. (Zero is greater than negative, and ties are possible.)Most pos. v 1________ 2________ 3________ 4________ 5________ 6________ Most neg. vExplain your reasoning for your ranking:b. Rank the graphs according to which show the greatest average speed from the beginning tothe end of the motion.Greatest 1________ 2________ 3________ 4________ 5________ 6________ LeastExplain your reasoning for your ranking:©<strong>Modeling</strong> Instruction 2010 4 U2 Constant Velocity - <strong>Review</strong> <strong>Sheet</strong> v3.0
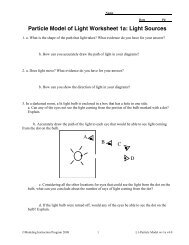
Sketch velocity vs. time graphs and motion maps corresponding to the following descriptions of themotion of an object.7. The object is moving in the positive direction ata constant (steady) speed.Motion Map:0 m+ time8. The object is standing still.Motion Map:0 m+time9. The object moves in the negative direction at asteady speed for 10s, then stands still for 10s.Motion Map:0 m+ time10. The object moves in the positive direction at asteady speed for 10s, reverses direction andmoves back toward the negative direction atthe same speed.Motion Map:0 mtime+©<strong>Modeling</strong> Instruction 2010 5 U2 Constant Velocity - <strong>Review</strong> <strong>Sheet</strong> v3.0