Data Mining Homework 4 DragonStar-2011
Data Mining Homework 4 DragonStar-2011
Data Mining Homework 4 DragonStar-2011

Create successful ePaper yourself
Turn your PDF publications into a flip-book with our unique Google optimized e-Paper software.
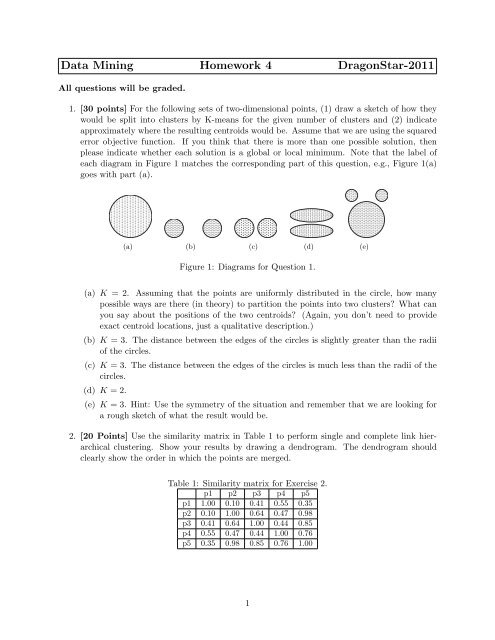
<strong>Data</strong> <strong>Mining</strong> <strong>Homework</strong> 4 <strong>DragonStar</strong>-<strong>2011</strong>All questions will be graded.1. [30 points] For the following sets of two-dimensional points, (1) draw a sketch of how theywould be split into clusters by K-means for the given number of clusters and (2) indicateapproximately where the resulting centroids would be. Assume that we are using the squarederror objective function. If you think that there is more than one possible solution, thenplease indicate whether each solution is a global or local minimum. Note that the label ofeach diagram in Figure 1 matches the corresponding part of this question, e.g., Figure 1(a)goes with part (a).(a) (b) (c) (d) (e)Figure 1: Diagrams for Question 1.(a) K = 2. Assuming that the points are uniformly distributed in the circle, how manypossible ways are there (in theory) to partition the points into two clusters? What canyou say about the positions of the two centroids? (Again, you don’t need to provideexact centroid locations, just a qualitative description.)(b) K = 3. The distance between the edges of the circles is slightly greater than the radiiof the circles.(c) K = 3. The distance between the edges of the circles is much less than the radii of thecircles.(d) K = 2.(e) K = 3. Hint: Use the symmetry of the situation and remember that we are looking fora rough sketch of what the result would be.2. [20 Points] Use the similarity matrix in Table 1 to perform single and complete link hierarchicalclustering. Show your results by drawing a dendrogram. The dendrogram shouldclearly show the order in which the points are merged.Table 1: Similarity matrix for Exercise 2.p1 p2 p3 p4 p5p1 1.00 0.10 0.41 0.55 0.35p2 0.10 1.00 0.64 0.47 0.98p3 0.41 0.64 1.00 0.44 0.85p4 0.55 0.47 0.44 1.00 0.76p5 0.35 0.98 0.85 0.76 1.001
3. [15 points] Traditional K-means has a number of limitations, such as sensitivity to outliersand difficulty in handling clusters of different sizes and densities, or with non-globular shapes.Comment on the ability of fuzzy c-means to handle these situations.4. [20 points] For the definition of SNN similarity provided by Algorithm 9.10, the calculationof SNN distance does not take into account the weights of the edges connecting the two pointsto their shared neighbors. In other words, it might be more desirable to give higher similarityto two points that are connected to their shared neighbors by edges having higher weights, ascompared to two points that are connected to their shared neighbors by edges having lowerweights.(a) Describe how you might modify the definition of SNN similarity to give higher similarityto points whose shared neighbors are connected to them by edges having higher weights.(b) Discuss the advantages and disadvantages of such a modification.5. [15 points] Explain one advantage and one disadvantage of DBSCAN over the K-meansclustering algorithm.2