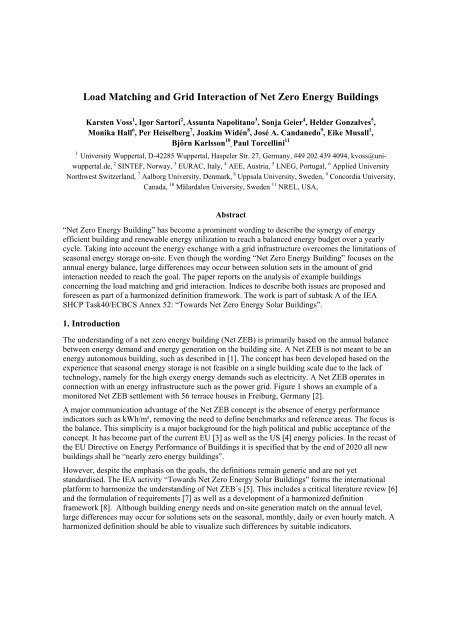
Load Matching and Grid Interaction of Net Zero Energy Buildings
Load Matching and Grid Interaction of Net Zero Energy Buildings
Load Matching and Grid Interaction of Net Zero Energy Buildings

Create successful ePaper yourself
Turn your PDF publications into a flip-book with our unique Google optimized e-Paper software.
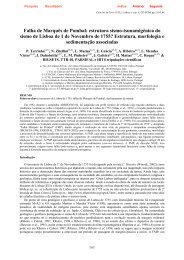
monthly data in sequence cumulative monthly data%20generationload% generation load100157510505250JanDec0JanDecSolar XXI, Portugal [13]%20generationload% generation load100157510505025Jan Dec 0Jan DecOberlin College, USA [14]%20generationload% generation load100157510505250Jan Dec 0Jan DecSolar Decathlon, Germany [15]Fig. 3: Annual electricity loads <strong>and</strong> generation pr<strong>of</strong>iles based on monthly data. Data include all types <strong>of</strong> electricloads <strong>and</strong> refer to measurements, except the Solar Decathlon case where simulation data are shown. Data arenormalized with the maximum <strong>of</strong> the annual total generation <strong>and</strong> load for each building. Monthly data are givenin sequence as well as cumulative to visualize the matching on the monthly level as well as annually.
Fig. 4: Simulated load match curves for a dwelling withPV generator <strong>of</strong> various sizes in the Stockholm climate[11]. The total load only represents household needs;electric heating or DHW is not considered. The lowercurve (A) represents the load match based on 10 minnet metering (max. 28%); the middle one (B) themonthly balance (max. 68%). The straight line (C)considers the annual balance <strong>and</strong> shows the match withthe dem<strong>and</strong> (103%). The increase in the load matchwith increasing generator size is limited due toincreasing excess electricity generation, especially inthe net metering case.3.2. The <strong>Load</strong> Match IndexAs suggested in literature, the relevant indicator is the so called solar fraction describing the ratio <strong>of</strong>the PV yield to the load. With respect to the fact that other on-site power generation options might beconsidered, the indicator is named load match index within the context <strong>of</strong> the <strong>Net</strong> ZEB topic. Allgenerated power exceeding the load is considered as part <strong>of</strong> the grid electricity, so that the maximumload match index becomes 1 or 100%. As the index strongly reflects the time resolution considered,the time interval must be part <strong>of</strong> the index name. With increasing time interval, excess productiondecreases. The annually based load match index <strong>of</strong> a <strong>Net</strong> ZEB as well as a net plus energy building isper definition equal to 1. <strong>Load</strong> match indices based on higher resolution data are averaged to an annualvalue, keeping the resolution indicator:⎡ on site generation⎤fload,i= min 1,⋅100[%]i = time interval (h,d,m) (1)⎢⎣ load ⎥⎦or equivalent, but based on net metering instead <strong>of</strong> load metering:⎡ on site generation ⎤fload,i= min⎢1,⋅100[%]net metering on sitegeneration⎥(2)⎣+⎦The presence <strong>of</strong> on-site battery storage implies that the index must be modified by adding the batteryenergy balance to the on-site generation. In case the battery is an overall sink within the interval (-),on-site generation decreases; generation increases in the opposite case. Battery storage will be visibleon the hourly or daily level only, due to the practical limitations <strong>of</strong> the storage capacity available withtoday’s system solutions.fload, i⎡ onsite generation+battery balance⎤= min⎢1,⋅100[%](3)⎣load⎥⎦Figure 5 illustrates the load match index in the resolution <strong>of</strong> months, days <strong>and</strong> hours for the projectsalready addressed within fig. 3 together with the annual averages. Monthly <strong>and</strong> daily resolutions resultin similar annual average load matches, whereas the hourly resolution leads to much lower values, dueto the missing PV yield during night.
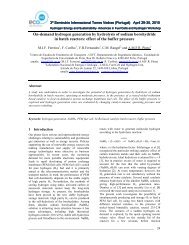
monthly daily hourly% load, 79% grid, 37%100% load, 77% grid, 25%100% load, 36% grid, 31%100505050000-50-50-50-100Jan DecSolar XXI, Portugal-100Jan Dec-100Jan Dec% load, 87% grid, 55%100% load, 81% grid, 29%100% load, 41% grid, 29%100505050000-50-50-50-100Jan DecOberlin College, USA-100Jan Dec-100Jan Dec% load, 79% grid, 43%100% load, 76% grid, 35%100% load, 36% grid, 25%100505050000-50-50-50-100Jan DecSolar Decathlon, Germany-100Jan Dec-100Jan DecFig. 5: <strong>Load</strong> match (f load ) <strong>and</strong> grid interaction indices (f grid , refer 4.2) for all projects addressed in figure 3. Dataare given in monthly, daily <strong>and</strong> hourly resolution together with the annual average for the load index as well asst<strong>and</strong>ard deviation for the grid interaction index.4. <strong>Grid</strong> <strong>Interaction</strong>4.1. BackgroundFeeding electricity from on-site generation into utility grids is part <strong>of</strong> the strategy to increase the gridsoverall system efficiency <strong>and</strong> the share <strong>of</strong> power from renewables. On the other h<strong>and</strong> large scaledistributed generation may generate problems with power stability <strong>and</strong> quality in today´s gridstructures, mainly on the local distribution grid level. Developments to so-called “smart grids” areongoing to fully benefit from distributed generation with respect to the grids primary energy <strong>and</strong>carbon emission factor as well as the costs. Time-dependent electricity costs (supply) <strong>and</strong> prices (feedin)may communicate the needs <strong>of</strong> the grid to the consumer (the building owner), thereby leadingtowards improved sizing <strong>of</strong> the building energy system <strong>and</strong> DSM as well as integrating appropriate on-
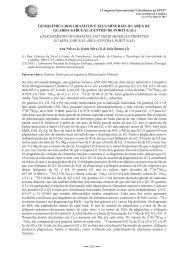
site storage options. Within a least-cost planning approach, on-site options have to be compared withmeasures at the grid level, which take advantage <strong>of</strong> the economy <strong>of</strong> scale <strong>and</strong> equalization <strong>of</strong> localpeaks.4.2. The <strong>Grid</strong> <strong>Interaction</strong> IndexWith respect to the fact that the value <strong>of</strong> exported power is dependent on the local grid performance,the appropriate index from the viewpoint <strong>of</strong> the building is proposed as grid interaction index instead<strong>of</strong> grid match index. Making use <strong>of</strong> the data already introduced, the grid interaction index is based onthe ratio <strong>of</strong> the net grid metering over a given period (e.g. monthly) compared to themaximum/minimum within an annual cycle. A positive value describes a net exporting building. Thegrid interaction index describes the average grid stress using the st<strong>and</strong>ard deviation <strong>of</strong> the gridinteraction over the period <strong>of</strong> a year:fgrid, igrid, yearnet grid= ⋅100[%]i = time interval, (4)max net grid( f )f = STD(5)grid,iThe index describes the fluctuation <strong>of</strong> the energy exchange <strong>of</strong> the building with the grid, not theamount <strong>of</strong> grid electricity needed. An almost constant import (or export) instead <strong>of</strong> high fluctuations ischaracterised by a low value <strong>of</strong> the annual f grid . Figure 5 includes the grid interaction index in theresolution <strong>of</strong> months, days <strong>and</strong> hours for the projects already addressed together with the annualst<strong>and</strong>ard deviation. Fig. 6 <strong>and</strong> 7 summarize the results for the annual indices based on differentresolutions. The Solar XXI project pr<strong>of</strong>its from the even solar yield during the year although not fullymatching the annual energy needs.10075load match index in %Solar XXIOberlin CollegeSolar Decathlon10075grid interaction indexSolar XXI Oberlin College Solar Decathlon505025250annually monthly daily hourly0annually monthly daily hourlyFig. 6: Comparison <strong>of</strong> the load match indicesbased on different time resolutions.Fig. 7: Comparison <strong>of</strong> the grid interaction indices basedon different time resolutions.5. ConclusionsThe investigation consequently addresses the load match <strong>and</strong> grid interaction issue on the buildinglevel, taking into account energy use <strong>and</strong> generation on-site. Fuel switching is not yet fully addressedat this stage <strong>of</strong> work. The investigation focuses on electricity, as the major energy exchanged with agrid in both directions. This includes plug loads <strong>and</strong> appliances as part <strong>of</strong> the total load <strong>and</strong> excludes<strong>of</strong>f-site power generation. With respect to data availability <strong>and</strong> the suitability for a future spread sheetcalculation tool <strong>and</strong> national building code applications a monthly resolution seems to the appropriate
level to characterise the major differences between projects <strong>and</strong> solution sets. The monthly dataconsequently address the seasonal effects, reflecting the mismatch <strong>of</strong> load <strong>and</strong> generation due tobuilding energy st<strong>and</strong>ard, system sizing <strong>and</strong> climate. Differences between projects are found to besmaller for higher resolution data as long as no on-site battery storage is applied. Indices will be testedwith further project data <strong>and</strong> introduced into the harmonized IEA SHCP Task40/ECBCS Annex 52definition framework. In the context <strong>of</strong> the smart grid development high resolution indices describingthe interaction <strong>of</strong> on-site generation, building load <strong>and</strong> grid might be considered relevant in future.6. AcknowledgementsThe work presented in this paper has been largely developed in the context <strong>of</strong> the joint IEA SHCTask40/ECBCS Annex52: Towards <strong>Net</strong> <strong>Zero</strong> <strong>Energy</strong> Solar <strong>Buildings</strong>. The German contribution hasbeen funded by the Federal Ministry <strong>of</strong> Economy <strong>and</strong> Technology within the program for energyoptimized building (EnOB).References[1] Goetzberger, A, et. al., The Self-Sufficient Solar House Freiburg, Advances in Solar <strong>Energy</strong>, vol. 9, p.1-70,1994[2] Heinze, M., Voss, K. (2009) Goal: <strong>Zero</strong> <strong>Energy</strong> Building -Exemplary Experience Based on the Solar EstateSolarsiedlung Freiburg am Schlierberg, Germany, Journal <strong>of</strong> Green Building, vol. 4, nr. 4.[3] EPBD recast (2010), Directive <strong>of</strong> the European Parliament <strong>and</strong> <strong>of</strong> the Council on the energy performance <strong>of</strong>buildings (recast), adopted by the Council on 14/04/2010, Brussels, 2008/0223 (COD).[4] US DOE (2008), Building Technologies Program, Planned Program Activities for 2008-2012, Department Of<strong>Energy</strong>, US, http://www1.eere.energy.gov/buildings/mypp.html (downloaded .01/07/2010)[5] Task 40/Anenx 52 (2008), Towards <strong>Net</strong> <strong>Zero</strong> <strong>Energy</strong> Solar <strong>Buildings</strong>, IEA SHC Task 40 <strong>and</strong> ECBCS Annex52, http://www.iea-shc.org/task40/index.html, accessed 10/12/2009.[6] Marszal, A. <strong>and</strong> Heiselberg, P. (2009), A literature review on ZEB definitions, Aalborg University (DK).[7] Sartori, I., C<strong>and</strong>anedo, J., Geier, S., Lollini, R., Athienitis, A., Garde, F. <strong>and</strong> Pagliano, L. (2010), Comfort <strong>and</strong><strong>Energy</strong> Performance Recommendations for <strong>Net</strong> <strong>Zero</strong> <strong>Energy</strong> <strong>Buildings</strong>, In the Proceedings <strong>of</strong> EuroSun2010, Graz, AT.[8] Sartori, I., Napolitano, A., Marszal, A., Pless, S., Torcellini, P. <strong>and</strong> Voss, K.: Criteria for Definition <strong>of</strong> <strong>Net</strong><strong>Zero</strong> <strong>Energy</strong> <strong>Buildings</strong>, In the Proceedings <strong>of</strong> EuroSun 2010, Graz, AT.[9] www.sdeurope.org, www.solardecathlon.gov[10] Widén, J., Wäckelgard, E., Lund, P.D.: Options for improving the load match capability <strong>of</strong> distributedphotovoltaics: Methodology <strong>and</strong> applications to high-latitude data, Solar <strong>Energy</strong> Journal, vol. 83, 2009[11] Widén, J.: Value <strong>of</strong> on-site electricity generation – example calculations with different types <strong>of</strong> metering foran individual household, Uppsala University, Dep. Of Engineering & Science, working document, 2010[12] Baetens, R., De Coninck, R., Helsen, L. Saelens, D.: The impact <strong>of</strong> domestic load pr<strong>of</strong>iles on the gridinteraction<strong>of</strong> building integrated photovoltaic (BIPV) systems in extremely low-energy dwellings, InProceedings <strong>of</strong> the Renewable <strong>Energy</strong> Research Conference 2010, 7-8 June, Trondheim, Norway.[13] Gonçalves H. et al: Solar XXI - Towards <strong>Zero</strong> <strong>Energy</strong>, ©LNEG 2010 (IBSN: 978-989-675-007-7),download: www.lneg.pt/iedt/?unidade=17695[14] Pless, S., Torcellini, P.: <strong>Energy</strong> Performance Evaluation <strong>of</strong> a Low-<strong>Energy</strong> Academic Building, 2006ASHRAE Winter Meeting Chicago, Illinois, January 21–25, 2006[15] Cremers, J. Voss, K., Rexroth, S., Wehner, M.: The German contribution to the Solar Decathlon Europe2010 – A comparison <strong>of</strong> four net zero energy building prototypes monitored under equal conditions, In theProceedings <strong>of</strong> EuroSun 2010, Graz, AT.