MBB 15 - Benchmark Tables.pdf - Microfinance Information Exchange
MBB 15 - Benchmark Tables.pdf - Microfinance Information Exchange
MBB 15 - Benchmark Tables.pdf - Microfinance Information Exchange

Create successful ePaper yourself
Turn your PDF publications into a flip-book with our unique Google optimized e-Paper software.
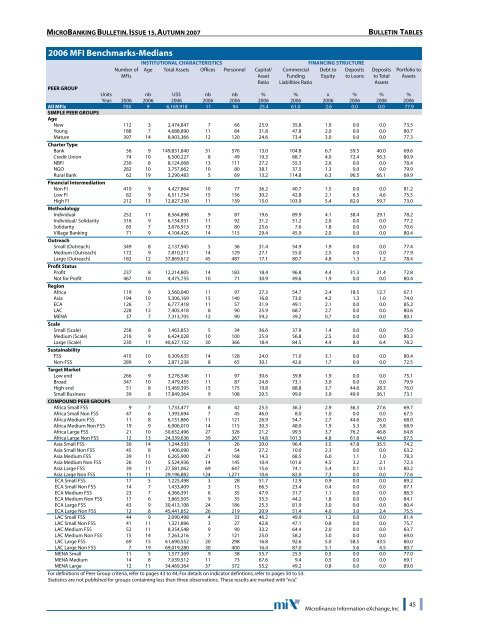
MICROBANKING BULLETIN, ISSUE <strong>15</strong>, AUTUMN 2007BULLETIN TABLES2006 MFI <strong>Benchmark</strong>s-MediansNumber ofMFIsINSTITUTIONAL CHARACTERISTICSAge Total Assets Offices Personnel Capital/AssetRatioFINANCING STRUCTURECommercial Debt to DepositsFunding Equity to LoansLiabilities RatioDepositsto TotalAssetsPortfolio toAssetsPEER GROUPUnits nb US$ nb nb % % x % % %Year: 2006 2006 2006 2006 2006 2006 2006 2006 2006 2006 2006All MFIs 704 9 6,169,918 11 94 25.4 61.0 2.6 0.0 0.0 77.9SIMPLE PEER GROUPSAgeNew 112 3 2,474,847 7 66 25.9 35.8 1.9 0.0 0.0 73.5Young 188 7 4,688,890 11 84 31.8 47.8 2.0 0.0 0.0 80.7Mature 397 14 8,903,366 12 120 24.6 73.4 3.0 0.0 0.0 77.3Charter TypeBank 56 9 149,831,840 31 576 13.0 104.8 6.7 59.5 40.0 69.6Credit Union 74 10 6,500,227 8 49 19.3 88.7 4.0 72.4 56.3 80.9NBFI 230 8 8,124,068 13 111 27.2 55.3 2.6 0.0 0.0 78.4NGO 282 10 3,757,662 10 80 38.1 37.5 1.3 0.0 0.0 79.9Rural Bank 62 19 3,290,483 5 69 13.2 114.8 6.3 96.5 66.1 69.9Financial IntermediationNon FI 410 9 4,427,864 10 77 36.2 40.7 1.5 0.0 0.0 81.2Low FI 82 9 6,511,754 <strong>15</strong> <strong>15</strong>6 30.2 42.8 2.1 6.5 4.6 75.5High FI 212 13 12,827,330 11 139 <strong>15</strong>.0 103.9 5.4 82.0 59.7 73.0MethodologyIndividual 252 11 8,564,898 9 87 19.6 89.9 4.1 38.4 29.1 78.2Individual/ Solidarity 316 9 6,<strong>15</strong>4,931 11 92 31.2 51.2 2.0 0.0 0.0 77.2Solidarity 65 7 3,676,913 13 80 25.6 7.6 1.8 0.0 0.0 70.6Village Banking 71 9 4,104,426 14 1<strong>15</strong> 29.4 45.9 2.0 0.0 0.0 80.4OutreachSmall (Outreach) 349 8 2,137,945 5 36 31.4 54.9 1.9 0.0 0.0 77.4Medium (Outreach) 172 9 7,810,211 14 129 27.1 55.0 2.5 0.0 0.0 77.9Large (Outreach) 182 12 37,869,612 45 487 17.1 80.7 4.8 1.3 1.2 78.4Profit StatusProfit 237 8 12,214,805 14 183 18.4 96.8 4.4 31.3 21.4 72.8Not for Profit 467 10 4,475,755 10 71 30.9 49.6 1.9 0.0 0.0 80.4RegionAfrica 119 9 3,560,040 11 97 27.3 54.7 2.4 18.5 12.7 67.1Asia 194 10 5,306,169 <strong>15</strong> 140 16.8 73.0 4.2 1.3 1.0 74.0ECA 126 7 6,777,418 11 57 31.9 49.1 2.1 0.0 0.0 85.2LAC 228 12 7,405,418 8 90 25.9 68.7 2.7 0.0 0.0 80.6MENA 37 7 7,313,705 12 90 59.2 39.2 0.7 0.0 0.0 80.1ScaleSmall (Scale) 258 8 1,463,853 5 34 36.6 37.9 1.4 0.0 0.0 75.0Medium (Scale) 216 9 6,424,028 10 100 25.9 56.8 2.5 0.0 0.0 80.3Large (Scale) 230 11 40,627,132 30 366 18.4 84.5 4.4 8.0 6.4 78.2SustainabilityFSS 4<strong>15</strong> 10 9,309,635 14 128 24.0 71.0 3.1 0.0 0.0 80.4Non-FSS 289 9 2,871,238 8 65 30.1 42.6 1.7 0.0 0.0 72.5Target MarketLow end 266 9 3,276,546 11 97 30.6 39.8 1.9 0.0 0.0 75.1Broad 347 10 7,479,455 11 87 24.8 73.1 3.0 0.0 0.0 79.9High end 51 8 <strong>15</strong>,469,395 <strong>15</strong> 175 19.8 88.8 3.7 44.6 28.3 76.0Small Business 39 8 17,849,364 9 108 20.5 99.0 3.9 49.9 36.1 73.1COMPOUND PEER GROUPSAfrica Small FSS 9 7 1,733,477 8 42 25.5 36.3 2.9 36.3 27.6 69.7Africa Small Non FSS 47 6 1,393,694 7 45 46.0 8.0 1.0 0.0 0.0 67.5Africa Medium FSS 11 8 6,<strong>15</strong>1,866 11 121 26.9 54.7 2.7 44.6 26.0 68.0Africa Medium Non FSS 19 9 6,906,010 14 1<strong>15</strong> 30.3 48.0 1.9 5.3 3.8 68.9Africa Large FSS 21 10 50,652,496 27 326 21.2 99.5 3.7 76.2 46.8 64.8Africa Large Non FSS 12 13 24,339,636 39 267 14.8 101.3 4.8 61.6 44.0 67.5Asia Small FSS 30 14 1,244,593 1 26 20.0 96.4 3.5 47.8 35.5 74.2Asia Small Non FSS 45 8 1,406,090 4 54 27.2 10.0 2.3 0.0 0.0 63.2Asia Medium FSS 39 11 6,265,900 21 168 14.3 68.5 6.0 1.1 1.0 78.3Asia Medium Non FSS 26 10 5,524,936 14 145 10.4 101.6 4.5 3.2 2.1 72.3Asia Large FSS 39 11 27,581,062 69 647 <strong>15</strong>.6 74.1 5.4 0.1 0.1 80.2Asia Large Non FSS <strong>15</strong> 11 29,196,882 124 1,271 10.6 82.0 7.3 0.0 0.0 77.6ECA Small FSS 17 5 1,225,498 3 28 51.7 12.9 0.9 0.0 0.0 89.2ECA Small Non FSS 14 7 1,433,409 3 <strong>15</strong> 66.5 23.4 0.4 0.0 0.0 87.1ECA Medium FSS 23 7 4,366,391 6 35 47.9 31.7 1.1 0.0 0.0 88.3ECA Medium Non FSS 17 6 3,865,505 9 35 35.5 44.2 1.8 0.0 0.0 84.1ECA Large FSS 43 9 30,413,108 24 186 25.3 81.9 3.0 0.0 0.0 80.4ECA Large Non FSS 12 8 45,441,852 26 219 20.9 51.4 4.0 3.0 2.4 75.5LAC Small FSS 44 9 2,090,498 4 33 46.2 49.9 1.2 0.0 0.0 81.4LAC Small Non FSS 41 11 1,321,896 3 27 42.8 47.1 0.8 0.0 0.0 75.7LAC Medium FSS 52 11 8,354,548 9 90 33.2 64.4 2.0 0.0 0.0 83.7LAC Medium Non FSS <strong>15</strong> 14 7,263,216 7 121 25.0 58.2 3.0 0.0 0.0 69.0LAC Large FSS 69 <strong>15</strong> 61,690,552 20 298 16.8 92.6 5.0 58.5 43.5 80.0LAC Large Non FSS 7 19 69,019,280 30 400 16.4 87.0 5.1 5.6 4.5 80.7MENA Small 11 5 1,577,369 9 38 55.7 25.5 0.5 0.0 0.0 77.0MENA Medium 14 8 7,039,512 11 73 67.6 9.4 0.5 0.0 0.0 69.1MENA Large 12 11 34,469,364 37 372 55.2 49.2 0.8 0.0 0.0 89.0For definitions of Peer Group criteria, refer to pages 43 to 44; For details on indicator defintions, refer to pages 50 to 53.Statistics are not published for groups containing less than three observations. These results are marked with “n/a”.<strong>Microfinance</strong> <strong>Information</strong> eXchange, Inc45