MBB 15 - Benchmark Tables.pdf - Microfinance Information Exchange
MBB 15 - Benchmark Tables.pdf - Microfinance Information Exchange
MBB 15 - Benchmark Tables.pdf - Microfinance Information Exchange

You also want an ePaper? Increase the reach of your titles
YUMPU automatically turns print PDFs into web optimized ePapers that Google loves.
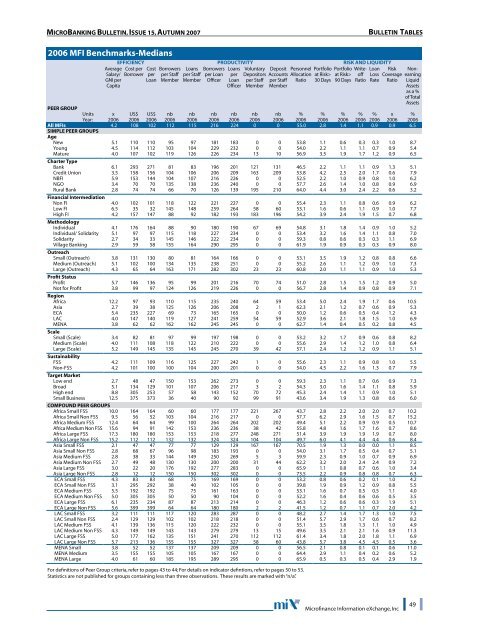
MICROBANKING BULLETIN, ISSUE <strong>15</strong>, AUTUMN 2007BULLETIN TABLES2006 MFI <strong>Benchmark</strong>s-MediansAverageSalary/GNI perCapitaEFFICIENCY PRODUCTIVITY RISK AND LIQUIDITYCost perBorrowerCostperLoanBorrowersper StaffMemberLoansper StaffMemberBorrowersper LoanOfficerLoansperLoanOfficerVoluntaryDepositorsper StaffMemberDepositAccountsper StaffMemberPersonnelAllocationRatioPortfolioat Risk>30 DaysPortfolioat Risk>90 DaysWriteoffRatioLoanLossRateRiskCoverageRatioPEER GROUPUnits x US$ US$ nb nb nb nb nb nb % % % % % x %Year: 2006 2006 2006 2006 2006 2006 2006 2006 2006 2006 2006 2006 2006 2006 2006 2006All MFIs 4.2 108 102 112 1<strong>15</strong> 216 224 0 0 55.0 2.8 1.4 1.1 0.9 0.9 6.5SIMPLE PEER GROUPSAgeNew 5.1 110 110 95 97 181 183 0 0 53.8 1.1 0.6 0.3 0.3 1.0 8.7Young 4.5 114 112 103 104 229 232 0 0 54.0 2.2 1.1 1.1 0.7 0.9 5.4Mature 4.0 107 102 119 126 226 234 13 10 56.9 3.5 1.9 1.7 1.2 0.9 6.5Charter TypeBank 6.1 293 271 81 83 196 201 121 131 46.5 2.2 1.1 1.1 0.9 1.3 5.1Credit Union 3.5 <strong>15</strong>8 <strong>15</strong>6 104 106 206 209 163 209 53.8 4.2 2.5 2.0 1.7 0.6 7.9NBFI 5.9 <strong>15</strong>3 144 104 107 216 226 0 0 52.5 2.2 1.0 0.9 0.8 1.0 6.2NGO 3.4 70 70 135 138 236 240 0 0 57.7 2.6 1.4 1.0 0.8 0.9 6.9Rural Bank 2.8 74 74 66 70 126 139 195 210 64.0 4.4 3.0 2.4 2.2 0.6 3.2Financial IntermediationNon FI 4.0 102 101 118 122 221 227 0 0 55.4 2.3 1.1 0.8 0.6 0.9 6.2Low FI 6.5 35 32 145 148 259 264 58 60 53.1 1.6 0.6 1.1 0.9 1.0 7.7High FI 4.2 <strong>15</strong>7 147 88 92 182 193 183 196 54.2 3.9 2.4 1.9 1.5 0.7 6.8MethodologyIndividual 4.1 176 164 88 90 180 190 67 69 54.8 3.1 1.8 1.4 0.9 1.0 5.2Individual/ Solidarity 5.1 97 97 1<strong>15</strong> 118 227 234 0 0 53.4 3.2 1.6 1.4 1.1 0.8 7.0Solidarity 2.7 34 33 145 146 222 234 0 0 59.3 0.8 0.6 0.3 0.3 1.1 6.9Village Banking 2.9 59 58 <strong>15</strong>5 164 290 295 0 0 61.9 1.9 0.9 0.3 0.3 0.9 8.0OutreachSmall (Outreach) 3.8 131 130 80 81 164 166 0 0 53.1 3.5 1.9 1.2 0.8 0.8 6.6Medium (Outreach) 5.1 102 100 134 135 238 251 0 0 55.2 2.6 1.1 1.2 0.9 1.0 7.3Large (Outreach) 4.3 65 64 163 171 282 302 23 23 60.8 2.0 1.1 1.1 0.9 1.0 5.3Profit StatusProfit 5.7 146 136 95 99 201 216 70 74 51.0 2.8 1.5 1.5 1.2 0.9 5.0Not for Profit 3.8 99 97 124 126 219 226 0 0 56.7 2.8 1.4 0.9 0.8 0.9 7.1RegionAfrica 12.2 97 93 110 1<strong>15</strong> 235 240 64 59 53.4 5.0 2.4 1.9 1.7 0.6 10.5Asia 2.7 39 38 125 126 206 208 2 1 62.3 2.1 1.2 0.7 0.6 0.9 5.3ECA 5.4 235 227 69 73 165 165 0 0 50.0 1.2 0.6 0.5 0.4 1.2 4.3LAC 4.0 147 140 119 127 241 259 54 59 52.9 3.6 2.1 1.8 1.5 1.0 6.9MENA 3.8 62 62 162 162 245 245 0 0 62.7 1.4 0.4 0.5 0.2 0.8 4.5ScaleSmall (Scale) 3.4 82 81 97 99 197 198 0 0 53.2 3.2 1.7 0.9 0.6 0.8 8.2Medium (Scale) 4.0 111 108 118 122 210 222 0 0 55.6 2.9 1.4 1.2 1.0 0.8 6.4Large (Scale) 5.2 149 145 135 145 245 270 39 42 57.1 2.4 1.2 1.2 0.9 1.1 5.1SustainabilityFSS 4.2 111 109 116 125 227 242 1 0 55.6 2.3 1.1 0.9 0.8 1.0 5.5Non-FSS 4.2 101 100 100 104 200 201 0 0 54.0 4.5 2.2 1.6 1.3 0.7 7.9Target MarketLow end 2.7 48 47 <strong>15</strong>0 <strong>15</strong>3 262 273 0 0 59.3 2.3 1.1 0.7 0.6 0.9 7.3Broad 5.1 134 129 101 107 206 217 3 2 54.3 3.0 1.6 1.4 1.1 0.8 5.9High end 8.8 305 253 57 58 143 <strong>15</strong>2 70 72 45.3 2.4 1.4 1.1 0.9 1.0 5.1Small Business 12.5 375 373 36 40 90 92 99 91 43.6 3.4 1.9 1.3 0.8 0.6 6.0COMPOUND PEER GROUPSAfrica Small FSS 10.0 164 164 60 60 177 177 221 267 43.7 2.8 2.2 2.0 2.0 0.7 10.2Africa Small Non FSS 9.5 56 52 103 104 216 217 0 0 57.7 6.2 2.9 1.6 1.5 0.7 <strong>15</strong>.2Africa Medium FSS 12.4 64 64 99 100 264 264 202 202 49.4 5.1 2.2 0.9 0.9 0.5 10.7Africa Medium Non FSS <strong>15</strong>.6 94 91 142 <strong>15</strong>3 236 236 38 42 55.8 4.8 1.6 1.7 1.6 0.7 8.6Africa Large FSS 17.3 180 180 <strong>15</strong>3 <strong>15</strong>3 218 277 248 271 51.4 3.9 1.9 1.9 1.9 0.7 8.0Africa Large Non FSS <strong>15</strong>.2 112 112 132 132 324 324 104 104 49.7 6.0 4.1 4.4 4.4 0.6 8.4Asia Small FSS 2.1 47 47 77 77 129 129 167 167 70.5 1.9 1.3 0.0 0.0 1.1 8.5Asia Small Non FSS 2.8 68 67 96 98 183 193 0 0 54.0 3.1 1.7 0.5 0.4 0.7 5.1Asia Medium FSS 2.8 38 33 144 149 250 269 5 3 59.9 2.3 0.9 1.0 0.7 0.9 6.9Asia Medium Non FSS 2.7 49 48 130 130 200 200 31 44 62.2 3.2 2.0 2.4 2.4 0.9 7.2Asia Large FSS 3.0 22 20 176 192 277 283 0 0 65.9 1.1 0.8 0.7 0.6 1.0 3.4Asia Large Non FSS 2.8 12 12 <strong>15</strong>0 <strong>15</strong>0 302 302 0 0 73.5 2.2 0.9 0.8 0.8 0.7 6.3ECA Small FSS 4.3 83 83 68 75 169 169 0 0 53.2 0.8 0.6 0.2 0.1 1.0 4.2ECA Small Non FSS 3.1 295 292 38 40 102 105 0 0 39.8 1.9 0.9 1.2 0.9 0.8 5.5ECA Medium FSS 5.5 192 192 75 75 161 163 0 0 53.1 1.6 0.7 0.5 0.5 1.1 4.0ECA Medium Non FSS 5.0 305 305 50 50 90 104 0 0 52.2 1.6 0.4 0.6 0.6 0.5 3.5ECA Large FSS 6.1 235 234 87 87 213 214 0 0 46.3 1.2 0.6 0.6 0.3 1.9 5.1ECA Large Non FSS 5.6 399 399 64 64 180 180 2 2 41.5 1.2 0.7 1.1 0.7 2.0 4.2LAC Small FSS 3.2 111 111 117 120 283 287 0 0 48.2 2.7 1.4 1.7 1.3 1.0 7.5LAC Small Non FSS 2.4 129 129 102 102 218 218 0 0 51.4 5.7 2.9 1.7 0.6 0.7 8.2LAC Medium FSS 4.1 139 136 1<strong>15</strong> 120 222 232 0 0 55.1 3.5 1.8 1.3 1.1 1.0 4.9LAC Medium Non FSS 4.3 149 149 143 143 279 279 13 <strong>15</strong> 49.6 3.5 2.1 2.1 1.6 0.9 11.3LAC Large FSS 5.0 177 162 135 <strong>15</strong>1 241 270 112 112 61.4 3.4 1.8 2.0 1.8 1.1 6.9LAC Large Non FSS 5.7 213 136 <strong>15</strong>5 <strong>15</strong>5 327 327 58 60 43.8 5.7 3.8 4.5 4.5 0.5 3.6MENA Small 3.8 52 52 137 137 209 209 0 0 56.5 2.1 0.8 0.1 0.1 0.6 11.0MENA Medium 3.5 <strong>15</strong>5 <strong>15</strong>5 105 105 167 167 0 0 64.4 2.9 1.1 0.4 0.2 0.6 5.2MENA Large 4.0 61 60 185 195 289 295 0 0 65.9 0.5 0.3 0.5 0.4 2.9 1.9For definitions of Peer Group criteria, refer to pages 43 to 44; For details on indicator defintions, refer to pages 50 to 53.Statistics are not published for groups containing less than three observations. These results are marked with “n/a”.NonearningLiquidAssetsas a %of TotalAssets<strong>Microfinance</strong> <strong>Information</strong> eXchange, Inc49