Activity 9: Exploring the H-R diagram
Activity 9: Exploring the H-R diagram
Activity 9: Exploring the H-R diagram
- No tags were found...

Create successful ePaper yourself
Turn your PDF publications into a flip-book with our unique Google optimized e-Paper software.
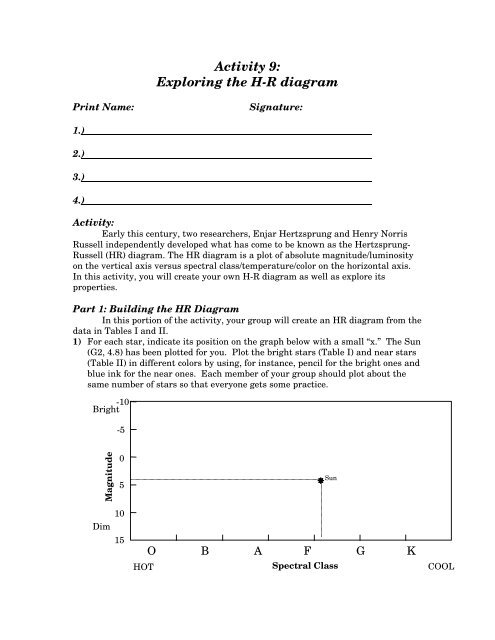
<strong>Activity</strong> 9:<strong>Exploring</strong> <strong>the</strong> H-R <strong>diagram</strong>Print Name:Signature:1.) .2.) .3.) .4.) .<strong>Activity</strong>:Early this century, two researchers, Enjar Hertzsprung and Henry NorrisRussell independently developed what has come to be known as <strong>the</strong> Hertzsprung-Russell (HR) <strong>diagram</strong>. The HR <strong>diagram</strong> is a plot of absolute magnitude/luminosityon <strong>the</strong> vertical axis versus spectral class/temperature/color on <strong>the</strong> horizontal axis.In this activity, you will create your own H-R <strong>diagram</strong> as well as explore itsproperties.Part 1: Building <strong>the</strong> HR DiagramIn this portion of <strong>the</strong> activity, your group will create an HR <strong>diagram</strong> from <strong>the</strong>data in Tables I and II.1) For each star, indicate its position on <strong>the</strong> graph below with a small “x.” The Sun(G2, 4.8) has been plotted for you. Plot <strong>the</strong> bright stars (Table I) and near stars(Table II) in different colors by using, for instance, pencil for <strong>the</strong> bright ones andblue ink for <strong>the</strong> near ones. Each member of your group should plot about <strong>the</strong>same number of stars so that everyone gets some practice.-10Bright-5Magnitude05SunDim1015HOTO B A F G KSpectral ClassCOOL
Table I: Bright Stars (as <strong>the</strong>y appear from Earth)Name SpectralClassAbsoluteMagnitudeName SpectralClassAbsoluteMagnitudeSirius B B8 11.6 Betelgeuse M2 -5.5Canopus F0 -3.1 Antares M2 -4.5Arcturus K2 -0.3 Spica B1 -3.6Capella G3 -0.7 Deneb A2 -6.9Rigel B8 -6.8 Procyon A F5 2.6Table II: Near StarsName SpectralClassAbsoluteMagnitudeName SpectralClassAbsoluteMagnitudeSun G2 4.8 Luyten 789- M6 14.66 AAlpha G2 4.4 Ross 128 M5 13.5Centauri ASirius A A1 1.4 61 Cygnus K5 7.6ARoss 154 M5 13.3 61 Cygnus K7 8.4BRoss 248 M6 14.8 Procyon A A0 13.02) In general (i.e., you may have to ignore some of <strong>the</strong> data points), is <strong>the</strong>re acorrelation between spectral class and absolute magnitude? What is it?3) Can you make any generalizations about stars that are close to Earth?4) Identify <strong>the</strong> Main Sequence, White Dwarfs and Red Giants on your H-R <strong>diagram</strong>.Part 2: Stellar SizesOnce we know a star’s temperature and its total luminosity we can also deduceits size. The reason is that <strong>the</strong>re is a connection between temperature and totalenergy output, which is described by <strong>the</strong> Stefan-Boltzmann law. There are twoimportant aspects to remember:• The total amount of light energy that a star emits—called <strong>the</strong> luminosity andmeasured by <strong>the</strong> absolute magnitude—increases with temperature. In fact,
it increases as <strong>the</strong> fourth power of <strong>the</strong> temperature so that a star <strong>the</strong> same sizeas our Sun but twice <strong>the</strong> temperature would emit 16 times <strong>the</strong> energy!• The amount of energy that a star emits per area of surface depends only on <strong>the</strong>star’s temperature. Therefore, <strong>the</strong> total luminosity of a star increases with <strong>the</strong>surface area. A star at <strong>the</strong> same temperature as our Sun but four times <strong>the</strong>surface area emits four times <strong>the</strong> energy.To estimate <strong>the</strong> size of a star we first determine its temperature from ei<strong>the</strong>r its coloror spectral class. This tells us how much energy each area of <strong>the</strong> surface is emitting.The total luminosity is just a measure of <strong>the</strong> total energy, which allows <strong>the</strong> surfacearea to be determined, which is a measure of <strong>the</strong> star’s size. Consider <strong>the</strong> stars inTable I to answer <strong>the</strong> following questions.5) Does Sirius B have a higher, equal, or lower surface temperature than Rigel?Explain your reasoning. (hint: compare <strong>the</strong>ir spectral classes)6) Which of <strong>the</strong>se two stars has greater luminosity? Explain your reasoning.7) Which is <strong>the</strong> larger of <strong>the</strong> two stars? Explain your reasoning.Part 3: Classifications on <strong>the</strong> HR Diagram8) How does <strong>the</strong> size of stars near <strong>the</strong> top left of <strong>the</strong> HR <strong>diagram</strong> compare withstars of <strong>the</strong> same luminosity near <strong>the</strong> top right of <strong>the</strong> HR <strong>diagram</strong>? Explainyour reasoning.9) How does <strong>the</strong> size of stars in <strong>the</strong> top left of <strong>the</strong> HR <strong>diagram</strong> compare with starsat <strong>the</strong> same temperature near <strong>the</strong> bottom left of <strong>the</strong> HR <strong>diagram</strong>? Explainyour reasoning.
10) Classify <strong>the</strong> following newly discovered stars as main sequence, dwarfs, orgiants.a. Hermanson A (G4 +5.2):b. α Slataurus (K8 –4.0):c. β Adamisus (A3 +10.4):d. Franciscus G (F2 +3.1):Part 4: Estimating Relative DistancesBetelgeuse has an apparent magnitude of +0.4, which tells us how bright itappears at its true location. Betelgeuse has an absolute magnitude of –5.5, whichtells us how bright it would appear if we could move it to a distance of 10 parsecs(about 33 light-years).11) Where would Betelgeuse appear brighter, in its true location or if were at adistance of 10 parsecs? Explain your reasoning.12) So, is its true location closer or far<strong>the</strong>r than 10 parsecs? Explain your reasoning.13) Below is a list of five stars and <strong>the</strong>ir apparent and absolute magnitudes. Yourtask is to classify each star as being located ei<strong>the</strong>r closer or far<strong>the</strong>r than 10parsecs.Star NameApparentMagnitudeSirius -1.5 +1.4Rigel +0.14 -6.8Procyon +0.37 +2.6Betelgeuse +0.41 -5.5α Centauri -0.01 +4.4AbsoluteMagnitudeDistance(Closer or far<strong>the</strong>r)Part 5: Spectroscopic ParallaxThe table on <strong>the</strong> following page gives both <strong>the</strong> apparent magnitude and spectralclass for five main sequence stars. For each star, do <strong>the</strong> following:14) Using <strong>the</strong> HR <strong>diagram</strong> on <strong>the</strong> next page, estimate <strong>the</strong> absolute magnitude foreach star.15) Complete <strong>the</strong> table by classifying each star as being less than, slightly morethan, or much more than 10 parsecs away.16) Use <strong>the</strong> following equation to calculate <strong>the</strong> actual distance to <strong>the</strong> stars inparsecs.
d=10 (m-M+5)/5 pcEach group member should do at least one star.Star ApparentMagnitudeSpectralClassRigel0.0 G2KentaurusVega +0.04 A0Rigel B +6.6 B9Canopus -0.72 F0Deneb +1.26 A2AbsoluteMagnitudeDistanceEstimateActualDistanceBright-10-5Main Sequence StarsAbsoluteMagnitude05Sun10Dim15HOTO B A F G KSpectral ClassCOOL


![Shock Value Practice Test[1].pdf - Science Olympiad Student Center](https://img.yumpu.com/42685889/1/190x245/shock-value-practice-test1pdf-science-olympiad-student-center.jpg?quality=85)