Download February 2006 Issue - Malaysian Institute of Planners
Download February 2006 Issue - Malaysian Institute of Planners
Download February 2006 Issue - Malaysian Institute of Planners
- No tags were found...

You also want an ePaper? Increase the reach of your titles
YUMPU automatically turns print PDFs into web optimized ePapers that Google loves.
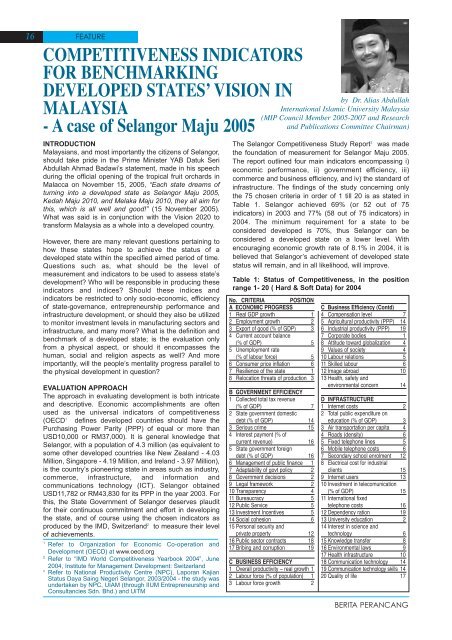
16FEATURECOMPETITIVENESS INDICATORSFOR BENCHMARKINGDEVELOPED STATES’ VISION INMALAYSIA- A case <strong>of</strong> Selangor Maju 2005INTRODUCTION<strong>Malaysian</strong>s, and most importantly the citizens <strong>of</strong> Selangor,should take pride in the Prime Minister YAB Datuk SeriAbdullah Ahmad Badawi’s statement, made in his speechduring the <strong>of</strong>ficial opening <strong>of</strong> the tropical fruit orchards inMalacca on November 15, 2005, “Each state dreams <strong>of</strong>turning into a developed state as Selangor Maju 2005,Kedah Maju 2010, and Melaka Maju 2010, they all aim forthis, which is all well and good!” (15 November 2005).What was said is in conjunction with the Vision 2020 totransform Malaysia as a whole into a developed country.However, there are many relevant questions pertaining tohow these states hope to achieve the status <strong>of</strong> adeveloped state within the specified aimed period <strong>of</strong> time.Questions such as, what should be the level <strong>of</strong>measurement and indicators to be used to assess state’sdevelopment? Who will be responsible in producing theseindicators and indices? Should these indices andindicators be restricted to only socio-economic, efficiency<strong>of</strong> state-governance, entrepreneurship performance andinfrastructure development, or should they also be utilizedto monitor investment levels in manufacturing sectors andinfrastructure, and many more? What is the definition andbenchmark <strong>of</strong> a developed state; is the evaluation onlyfrom a physical aspect, or should it encompasses thehuman, social and religion aspects as well? And moreimportantly, will the people’s mentality progress parallel tothe physical development in question?EVALUATION APPROACHThe approach in evaluating development is both intricateand descriptive. Economic accomplishments are <strong>of</strong>tenused as the universal indicators <strong>of</strong> competitiveness(OECD 1 defines developed countries should have thePurchasing Power Parity (PPP) <strong>of</strong> equal or more thanUSD10,000 or RM37,000). It is general knowledge thatSelangor, with a population <strong>of</strong> 4.3 million (as equivalent tosome other developed countries like New Zealand - 4.03Million, Singapore - 4.19 Million, and Ireland - 3.97 Million),is the country’s pioneering state in areas such as industry,commerce, infrastructure, and information andcommunications technology (ICT). Selangor obtainedUSD11,782 or RM43,830 for its PPP in the year 2003. Forthis, the State Government <strong>of</strong> Selangor deserves plauditfor their continuous commitment and effort in developingthe state, and <strong>of</strong> course using the chosen indicators asproduced by the IMD, Switzerland 2 to measure their level<strong>of</strong> achievements.1Refer to Organization for Economic Co-operation andDevelopment (OECD) at www.oecd.org2Refer to “IMD World Competitiveness Yearbook 2004”, June2004, <strong>Institute</strong> for Management Development: Switzerland3Refer to National Productivity Centre (NPC), Laporan KajianStatus Daya Saing Negeri Selangor, 2003/2004 - the study wasundertaken by NPC, UIAM (through IIUM Entrepreneurship andConsultancies Sdn. Bhd.) and UiTMby Dr. Alias AbdullahInternational Islamic University Malaysia(MIP Council Member 2005-2007 and Researchand Publications Committee Chairman)The Selangor Competitiveness Study Report 3 was madethe foundation <strong>of</strong> measurement for Selangor Maju 2005.The report outlined four main indicators encompassing i)economic performance, ii) government efficiency, iii)commerce and business efficiency, and iv) the standard <strong>of</strong>infrastructure. The findings <strong>of</strong> the study concerning onlythe 75 chosen criteria in order <strong>of</strong> 1 till 20 is as stated inTable 1. Selangor achieved 69% (or 52 out <strong>of</strong> 75indicators) in 2003 and 77% (58 out <strong>of</strong> 75 indicators) in2004. The minimum requirement for a state to beconsidered developed is 70%, thus Selangor can beconsidered a developed state on a lower level. Withencouraging economic growth rate <strong>of</strong> 8.1% in 2004, it isbelieved that Selangor’s achievement <strong>of</strong> developed statestatus will remain, and in all likelihood, will improve.Table 1: Status <strong>of</strong> Competitiveness, in the positionrange 1- 20 ( Hard & S<strong>of</strong>t Data) for 2004No. CRITERIA POSITIONA ECONOMIC PROGRESS1 Real GDP growth 12 Employment growth 23 Export <strong>of</strong> good (% <strong>of</strong> GDP) 34 Current account balance(% <strong>of</strong> GDP) 55 Unemployment rate(% <strong>of</strong> labour force) 56 Consumer price inflation 67 Resilience <strong>of</strong> the state 18 Relocation threats <strong>of</strong> production 3B GOVERNMENT EFFICIENCY1 Collected total tax revenue(% <strong>of</strong> GDP) 72 State government domesticdebt (% <strong>of</strong> GDP) 143 Serious crime 154 Interest payment (% <strong>of</strong>current revenue) 165 State government foreigndebt (% <strong>of</strong> GDP) 166 Management <strong>of</strong> public finance 17 Adaptability <strong>of</strong> govt policy 28 Government decisions 29 Legal framework 210 Transparency 411 Bureaucracy 512 Public Service 513 Investment Incentives 514 Social cohesion 615 Personal security andprivate property 1216 Public sector contracts 1817 Bribing and corruption 19C BUSINESS EFFICIENCY1 Overall productivity – real growth 12 Labour force (% <strong>of</strong> population) 13 Labour force growth 2C Business Efficiency (Contd)4 Compensation level 75 Agricultural productivity (PPP) 146 Industrial productivity (PPP) 197 Corporate bodies 18 Attitude toward globalization 49 Values <strong>of</strong> society 410 Labour relations 511 Skilled labour 612 Image abroad 1013 Health, safety andenvironmental concern 14D INFRASTRUCTURE1 Internet costs 22 Total public expenditure oneducation (% <strong>of</strong> GDP) 33 Air transportation per capita 44 Roads (density) 65 Fixed telephone lines 56 Mobile telephone costs 67 Secondary school enrolment 128 Electrical cost for industrialclients 159 Internet users 1310 Investment in telecomunication(% <strong>of</strong> GDP) 1511 International fixedtelephone costs 1612 Dependency ration 1913 University education 214 Interest in science andtechnology 615 Knowledge transfer 816 Environmental laws 917 Health infrastructure 1018 Communication technology 1419 Communication technology skills 1420 Quality <strong>of</strong> life 17BERITA PERANCANG