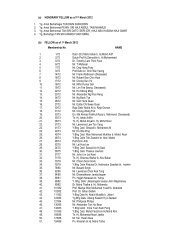
16FEATURECOMPETITIVENESS INDICATORSFOR BENCHMARKINGDEVELOPED STATES’ VISION INMALAYSIA- A case <strong>of</strong> Selangor Maju 2005INTRODUCTION<strong>Malaysian</strong>s, and most importantly the citizens <strong>of</strong> Selangor,should take pride in the Prime Minister YAB Datuk SeriAbdullah Ahmad Badawi’s statement, made in his speechduring the <strong>of</strong>ficial opening <strong>of</strong> the tropical fruit orchards inMalacca on November 15, 2005, “Each state dreams <strong>of</strong>turning into a developed state as Selangor Maju 2005,Kedah Maju 2010, and Melaka Maju 2010, they all aim forthis, which is all well and good!” (15 November 2005).What was said is in conjunction with the Vision 2020 totransform Malaysia as a whole into a developed country.However, there are many relevant questions pertaining tohow these states hope to achieve the status <strong>of</strong> adeveloped state within the specified aimed period <strong>of</strong> time.Questions such as, what should be the level <strong>of</strong>measurement and indicators to be used to assess state’sdevelopment? Who will be responsible in producing theseindicators and indices? Should these indices andindicators be restricted to only socio-economic, efficiency<strong>of</strong> state-governance, entrepreneurship performance andinfrastructure development, or should they also be utilizedto monitor investment levels in manufacturing sectors andinfrastructure, and many more? What is the definition andbenchmark <strong>of</strong> a developed state; is the evaluation onlyfrom a physical aspect, or should it encompasses thehuman, social and religion aspects as well? And moreimportantly, will the people’s mentality progress parallel tothe physical development in question?EVALUATION APPROACHThe approach in evaluating development is both intricateand descriptive. Economic accomplishments are <strong>of</strong>tenused as the universal indicators <strong>of</strong> competitiveness(OECD 1 defines developed countries should have thePurchasing Power Parity (PPP) <strong>of</strong> equal or more thanUSD10,000 or RM37,000). It is general knowledge thatSelangor, with a population <strong>of</strong> 4.3 million (as equivalent tosome other developed countries like New Zealand - 4.03Million, Singapore - 4.19 Million, and Ireland - 3.97 Million),is the country’s pioneering state in areas such as industry,commerce, infrastructure, and information andcommunications technology (ICT). Selangor obtainedUSD11,782 or RM43,830 for its PPP in the year 2003. Forthis, the State Government <strong>of</strong> Selangor deserves plauditfor their continuous commitment and effort in developingthe state, and <strong>of</strong> course using the chosen indicators asproduced by the IMD, Switzerland 2 to measure their level<strong>of</strong> achievements.1Refer to Organization for Economic Co-operation andDevelopment (OECD) at www.oecd.org2Refer to “IMD World Competitiveness Yearbook 2004”, June2004, <strong>Institute</strong> for Management Development: Switzerland3Refer to National Productivity Centre (NPC), Laporan KajianStatus Daya Saing Negeri Selangor, 2003/2004 - the study wasundertaken by NPC, UIAM (through IIUM Entrepreneurship andConsultancies Sdn. Bhd.) and UiTMby Dr. Alias AbdullahInternational Islamic University Malaysia(MIP Council Member 2005-2007 and Researchand Publications Committee Chairman)The Selangor Competitiveness Study Report 3 was madethe foundation <strong>of</strong> measurement for Selangor Maju 2005.The report outlined four main indicators encompassing i)economic performance, ii) government efficiency, iii)commerce and business efficiency, and iv) the standard <strong>of</strong>infrastructure. The findings <strong>of</strong> the study concerning onlythe 75 chosen criteria in order <strong>of</strong> 1 till 20 is as stated inTable 1. Selangor achieved 69% (or 52 out <strong>of</strong> 75indicators) in 2003 and 77% (58 out <strong>of</strong> 75 indicators) in2004. The minimum requirement for a state to beconsidered developed is 70%, thus Selangor can beconsidered a developed state on a lower level. Withencouraging economic growth rate <strong>of</strong> 8.1% in 2004, it isbelieved that Selangor’s achievement <strong>of</strong> developed statestatus will remain, and in all likelihood, will improve.Table 1: Status <strong>of</strong> Competitiveness, in the positionrange 1- 20 ( Hard & S<strong>of</strong>t Data) for 2004No. CRITERIA POSITIONA ECONOMIC PROGRESS1 Real GDP growth 12 Employment growth 23 Export <strong>of</strong> good (% <strong>of</strong> GDP) 34 Current account balance(% <strong>of</strong> GDP) 55 Unemployment rate(% <strong>of</strong> labour force) 56 Consumer price inflation 67 Resilience <strong>of</strong> the state 18 Relocation threats <strong>of</strong> production 3B GOVERNMENT EFFICIENCY1 Collected total tax revenue(% <strong>of</strong> GDP) 72 State government domesticdebt (% <strong>of</strong> GDP) 143 Serious crime 154 Interest payment (% <strong>of</strong>current revenue) 165 State government foreigndebt (% <strong>of</strong> GDP) 166 Management <strong>of</strong> public finance 17 Adaptability <strong>of</strong> govt policy 28 Government decisions 29 Legal framework 210 Transparency 411 Bureaucracy 512 Public Service 513 Investment Incentives 514 Social cohesion 615 Personal security andprivate property 1216 Public sector contracts 1817 Bribing and corruption 19C BUSINESS EFFICIENCY1 Overall productivity – real growth 12 Labour force (% <strong>of</strong> population) 13 Labour force growth 2C Business Efficiency (Contd)4 Compensation level 75 Agricultural productivity (PPP) 146 Industrial productivity (PPP) 197 Corporate bodies 18 Attitude toward globalization 49 Values <strong>of</strong> society 410 Labour relations 511 Skilled labour 612 Image abroad 1013 Health, safety andenvironmental concern 14D INFRASTRUCTURE1 Internet costs 22 Total public expenditure oneducation (% <strong>of</strong> GDP) 33 Air transportation per capita 44 Roads (density) 65 Fixed telephone lines 56 Mobile telephone costs 67 Secondary school enrolment 128 Electrical cost for industrialclients 159 Internet users 1310 Investment in telecomunication(% <strong>of</strong> GDP) 1511 International fixedtelephone costs 1612 Dependency ration 1913 University education 214 Interest in science andtechnology 615 Knowledge transfer 816 Environmental laws 917 Health infrastructure 1018 Communication technology 1419 Communication technology skills 1420 Quality <strong>of</strong> life 17BERITA PERANCANG
COMPETITIVENESS INDICATORS 17HUMAN DEVELOPMENT UNDP REPORT2005 and MALAYSIA QUALITY OF LIFEREPORT 2005 REINFORCE SELANGORDEVELOPED-STATE CLAIMThis claim was reinforced by the United Nations HumanDevelopment Report 2005 produced by the UNDP 4 , whichmarked the level <strong>of</strong> Malaysia’s achievement in the year2000 as within the range <strong>of</strong> moderate, with an HDI Index <strong>of</strong>0.796, and a ranking <strong>of</strong> 61 among 177 countries. Selangorhowever achieved an HDI Index <strong>of</strong> 0.817 and was rankedthird in the country, after Kuala Lumpur (0.861) and PulauPinang (0.828). The UNDP has set an HDI Index <strong>of</strong> 0.85for high developed, 0.80-0.84 as developed, 0.75-0.79 asmoderately developed, and less than 0.75 asunderdeveloped. The measurement <strong>of</strong> HDI by UNDPMalaysia integrated three aspects, age and a healthy andprosperous lifestyle, education status, and standard <strong>of</strong>Table 2: Data from Malaysia Quality <strong>of</strong> Life Report 2004living/quality <strong>of</strong> life (see a map in page 18 <strong>of</strong> November2005 Berita Perancang).As is it with the Malaysia Quality <strong>of</strong> Life Report 2004produced by the Economic Planning Unit, Prime Minister’sOffice 5 , which exhibited Selangor’s improved position ascompared to other states in Malaysia. From the aspects <strong>of</strong>Total Household Monthly Income and Gini Coefficient in2002, Selangor was ranked second after Kuala Lumpur(See Table 2). In addition to this Selangor boasts <strong>of</strong> its lowrate <strong>of</strong> poverty, 1.1% and extreme poverty 0.2% in 2002.Selangor also has the second highest number <strong>of</strong> internetusers in Malaysia, which allows the state to progressaccordingly with, “negeri cemerlang, gemilang danterbilang” concept especially in the ICT and knowledgesectors (i.e., knowledge communities). The percentage <strong>of</strong>achievement in tertiary education, 33.78% and illiteracy <strong>of</strong>3.67% place Selangor second by national standards.NO ARTICLE 1990 1995 (96) 2002 Rank by State, most current year1 Min Total Household Monthly Income (RM) RM1,658 RM3,162 RM4,406 22 Gini Coefficient 0.4440 0.4238 0.4234 23 Poverty (% household) 7.6 2.2 1.1 24 Extreme poverty (% household) 1.1 0.5 0.2 25 Total <strong>of</strong> registered vehicles per 1000 population 178 156 149.5 76 Total <strong>of</strong> Telephone lines per 1000 population 235 227.6 244.1 17 Number <strong>of</strong> Internet users - - 225,262 (38.2%) year 2000 2 (year 2000)8 Patient: Physician ratio 2,287 2,021 1,543 89 Student: Teacher ratio (secondary) 20.4 19.8 17.5 1010 Student: Teacher ratio (primary) 24 23.6 20.6 811 Tertiary education achievement(%) 24.28 28.37 33.78 212 None formal education(%) 6.17 5.23 3.67 213 Water supply in rural areas(%) 85 94 98 214 Power supply in rural areas (%) 96.6 (1992) - 97.92 (2000) 84Refer to United Nations Development Programme (UNDP) at www.undp.org.my/Human_development_Malaysia.asp5Refer to www.epu.jpm.my/Source:1.Penyiasatan Pendapatan Isi Rumah, 1990, 1995 & 2002, Jabatan Perangkaan Malaysia2. Bank Data Negeri/Daerah 91990, 1996, 2002), Jabatan Perangkaan Malaysia3. Kementerian Tenaga, komunikasi dan Multimedia (MCMC)4. Penyiasatan Tenaga Buruh, Jabatan Perangkaan Malaysia!Village Appraisals (Contd. from Page 15)Briefly, a District Plan covers the whole District and a LocalPlan covers certain areas within that District. VillageAppraisals are intended for those rural areas within aDistrict which are not specifically covered by Local Plans.The responsibility for preparing and implementing thecontents <strong>of</strong> a Village Appraisal rests with the villageconcerned although the overall planning framework will bethrough the adopted District Plan.The communityís main aim is therefore to get the VillageAppraisal adopted as Supplementary Planning Guidance.Once adopted, it will have a major role in influencing futureplanning policy at the local level. It will not only aid decisionmakingon planning applications submitted to the Municipaland District Councils but more importantly it will give thelocal community the tools to determine the futuredevelopment <strong>of</strong> their respective villages.Preparing a Village Appraisal requires the commitment <strong>of</strong>the whole community to ensure success. Thus, everyone inthe Community, from the Ketua Kampung, Kapitan Cina,and Community Leaders (e.g. Community DevelopmentOfficers and Pemimpin Kemajuan Rakyat) toJawatankuasa Kemajuan dan Keselamatan Kampung(JKKK), the business community; public sector; NGOs; andschools, should be involved in Village Appraisalíspreparation. Crucially, local residents from young people tosenior citizens; people with disabilities and others andthose who have associations with the village must beinvolved. The districtís Members <strong>of</strong> Parliament, Ahli DewanUndangan Negeri, Parliamentary Senators and othersshould also be involved too. They should be able to <strong>of</strong>feradvice but the final decision on the types <strong>of</strong> issues andopportunities to consider and include in the VillageAppraisal is up to the whole community.[end]BERITA PERANCANG