Download PDF - Real Instituto Elcano
Download PDF - Real Instituto Elcano
Download PDF - Real Instituto Elcano
- No tags were found...

Create successful ePaper yourself
Turn your PDF publications into a flip-book with our unique Google optimized e-Paper software.
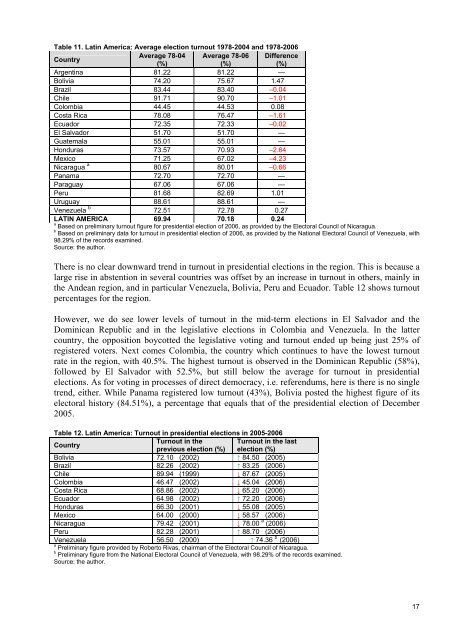
Table 11. Latin America: Average election turnout 1978-2004 and 1978-2006CountryAverage 78-04 Average 78-06 Difference(%)(%)(%)Argentina 81.22 81.22 —Bolivia 74.20 75.67 1.47Brazil 83.44 83.40 –0.04Chile 91.71 90.70 –1.01Colombia 44.45 44.53 0.08Costa Rica 78.08 76.47 –1.61Ecuador 72.35 72.33 –0.02El Salvador 51.70 51.70 —Guatemala 55.01 55.01 —Honduras 73.57 70.93 –2.64Mexico 71.25 67.02 –4.23Nicaragua a 80.67 80.01 –0.66Panama 72.70 72.70 —Paraguay 67.06 67.06 —Peru 81.68 82.69 1.01Uruguay 88.61 88.61 —Venezuela b 72.51 72.78 0.27LATIN AMERICA 69.94 70.18 0.24aBased on preliminary turnout figure for presidential election of 2006, as provided by the Electoral Council of Nicaragua.bBased on preliminary data for turnout in presidential election of 2006, as provided by the National Electoral Council of Venezuela, with98.29% of the records examined.Source: the author.There is no clear downward trend in turnout in presidential elections in the region. This is because alarge rise in abstention in several countries was offset by an increase in turnout in others, mainly inthe Andean region, and in particular Venezuela, Bolivia, Peru and Ecuador. Table 12 shows turnoutpercentages for the region.However, we do see lower levels of turnout in the mid-term elections in El Salvador and theDominican Republic and in the legislative elections in Colombia and Venezuela. In the lattercountry, the opposition boycotted the legislative voting and turnout ended up being just 25% ofregistered voters. Next comes Colombia, the country which continues to have the lowest turnoutrate in the region, with 40.5%. The highest turnout is observed in the Dominican Republic (58%),followed by El Salvador with 52.5%, but still below the average for turnout in presidentialelections. As for voting in processes of direct democracy, i.e. referendums, here is there is no singletrend, either. While Panama registered low turnout (43%), Bolivia posted the highest figure of itselectoral history (84.51%), a percentage that equals that of the presidential election of December2005.Table 12. Latin America: Turnout in presidential elections in 2005-2006CountryTurnout in theTurnout in the lastprevious election (%) election (%)Bolivia 72.10 (2002) ↑ 84.50 (2005)Brazil 82.26 (2002) ↑ 83.25 (2006)Chile 89.94 (1999) ↓ 87.67 (2005)Colombia 46.47 (2002) ↓ 45.04 (2006)Costa Rica 68.86 (2002) ↓ 65.20 (2006)Ecuador 64.98 (2002) ↑ 72.20 (2006)Honduras 66.30 (2001) ↓ 55.08 (2005)Mexico 64.00 (2000) ↓ 58.57 (2006)Nicaragua 79.42 (2001) ↓ 78.00 a (2006)Peru 82.28 (2001) ↑ 88.70 (2006)Venezuela 56.50 (2000) ↑ 74.36 b (2006)aPreliminary figure provided by Roberto Rivas, chairman of the Electoral Council of Nicaragua.bPreliminary figure from the National Electoral Council of Venezuela, with 98.29% of the records examined.Source: the author.17