Full 2012 Annual Report (PDF) - United Technologies 2012 Annual ...
Full 2012 Annual Report (PDF) - United Technologies 2012 Annual ...
Full 2012 Annual Report (PDF) - United Technologies 2012 Annual ...

Create successful ePaper yourself
Turn your PDF publications into a flip-book with our unique Google optimized e-Paper software.
<strong>2012</strong> <strong>Annual</strong> <strong>Report</strong>Financial andCorporate ResponsibilityPerformanceAccelerate
A <strong>United</strong> Airlines Airbus A320 approaches therunway powered by IAE V2500 engines andequipped with nacelles and more than a dozensystems from UTC Aerospace Systems, includingflight controls, electric power, lighting, air datasystems, ice detection, cockpit controls, andwheels and brakes. Our acquisition of GoodrichCorp. and our majority ownership in the IAEInternational Aero Engines AG collaborationreshaped our portfolio and strengthenedour position in the fast-growing commercialaerospace market.<strong>United</strong> <strong>Technologies</strong> Corporation (UTC) isa diversified company that provides a broadrange of high-technology products and servicesto the global aerospace and building systemsindustries. Our commercial businesses areOtis elevators and escalators, and UTC Climate,Controls & Security, which includes Carrierheating, air-conditioning and refrigerationsystems, as well as fire and security solutionsfrom brands such as Kidde and Chubb.Our aerospace businesses are Sikorskyhelicopters, Pratt & Whitney aircraft enginesand UTC Aerospace Systems. The companyalso operates a central research organizationthat pursues technologies for improving theperformance, energy efficiency and cost ofUTC products and processes.To learn more, visit www.utc.com.
Accelerating GrowthThe portfoliotransformation wecompleted in <strong>2012</strong>made us a better,stronger, morefocused company.Our big investments in commercialaerospace, our streamlined portfolioand new organizational structure,combined with our global scale andexperienced leadership team, positionus to deliver strong growth in 2013and well into the future.Contents2Shareowner Letter6Accelerate Growth8Accelerate Performance10Accelerate Productivity12Accelerate Success14Accelerate Our Approach18At a Glance20Business Highlights24Our Commitments25Financials53Cautionary Note Concerning FactorsThat May Affect Future Results98Board of Directors99Leadership100Shareowner InformationInside Back CoverRecognition
02 | UNITED TECHNOLOGIES CORPORATIONLouis R. ChênevertChairman &Chief ExecutiveOfficerToday China accounts for half of the world’selevator market and continues to grow.In <strong>2012</strong>, Otis expanded its leading presencein China, opening a new factory in Chongqing,one of the world’s fastest-growingmegacities and the manufacturing andtransportation hub for the southwesternregion of the country.
04 |UNITED TECHNOLOGIES CORPORATIONAcross the portfolio, there were many other accomplishmentsin <strong>2012</strong>. Among them, Sikorsky achieved a major milestone bycertifying the S-76D helicopter, which provides customers withhigher cruise speeds, better fuel efficiency, greater reliability,and future capabilities, including rotor de-icing. Pratt &Whitney continued to win significant orders for its revolutionaryPurePower Geared Turbofan engine, with nearly 3,000announced engine orders, including options, as of the end of<strong>2012</strong>. Engine testing has been completed for the BombardierCSeries and has begun for the Airbus A320neo. Ground andflight testing has validated the expected improvements in fuelburn, emissions and noise reduction. In January 2013, Embraerbecame the fifth aircraft manufacturer to select the PurePowerengine when it announced the Geared Turbofan as the exclusivepower for its new second-generation E-Jet aircraft family. Thisselection will greatly enhance Pratt & Whitney’s position in thecommercial aerospace market for decades to come.On the commercial side, Otis continues to significantlystrengthen its position by introducing new products tailoredto specific end markets, including a Gen2 elevator applicationfor the fast-growing social housing segment in China and anupcoming Gen2 application with a battery-backup systemfor the Indian and South Asian markets. Otis also significantlyexpanded its presence in China by opening a new manufacturingfacility in Chongqing, supporting growth in central andwestern China. This factory and new factories scheduledto open in Bengaluru and São Paulo in 2013 highlight Otis’customer-focused strategy of investing in key growth marketsaround the world.A successful portfolio transformation positioned UTC Climate,Controls & Security for strong growth as the commercialconstruction and U.S. housing markets recover. The companyalso enhanced its position as a leading provider of efficientand sustainable solutions. New product launches included thehigh-efficiency Infinity 98 gas furnace; the WeatherExpert rooftopunit, the company’s most efficient commercial rooftop unitever; and the new Kidde Worry-Free Smoke Alarm, significantlyincreasing fire safety in homes and reducing maintenance witha 10-year, sealed-in battery. UTC Climate, Controls & Securityalso strengthened its emerging market presence by increasingproduct localization, expanding its distribution footprint andestablishing joint ventures in key markets. Highlighting thisapproach was the new joint venture in India with Midea and theopening of a new India manufacturing facility to take advantageof that nation’s fast-growing residential air-conditioning market.As always, <strong>United</strong> <strong>Technologies</strong>’ performance over the pastyear reflects the dedication and hard work of our leadershipteam and our nearly 220,000 employees around the world.On behalf of our shareowners, I thank all employees for theirmany contributions, and in particular, I want to recognize the27,000 Goodrich employees who joined UTC this past July fortheir willingness to embrace change. The talent, skills andteamwork displayed during the integration process have beentruly extraordinary, setting the stage for a bright new chapterfor our company.I also thank our customers. We are grateful for the confidenceand trust they place in our products and our people. We recognizecustomers have choices, and how we perform determineswhether they choose us. We are committed to delivering thevery best value to our customers by finding better, faster andmore efficient ways to support their success.In closing, I am proud of what <strong>United</strong> <strong>Technologies</strong> accomplishedover the past year and excited about the momentumwe have created. The entire team is now focused on integrating,executing and accelerating our performance to deliverUTC-style earnings growth well into the future.Louis R. ChênevertChairman & Chief Executive Officer01 Otis sets the standard for elevator performance, efficiencyand comfort. Its Gen2 system reduces energy use by up to50 percent compared to conventional systems.02 The F-35B Lightning II is powered by Pratt & Whitney’s F135propulsion system, the world’s most advanced, capablefifth-generation fighter engine.03 UTC Aerospace Systems’ integrated, low-weight landing gearsolutions use advanced materials and environmentally friendlycoatings to reduce wear and resist corrosion.04 With more than 2,300 aircraft in service and more than 30 yearsof legendary performance, the Sikorsky BLACK HAWK helicopterremains the first choice for tactical operations worldwide.05 A Carrier technician services an AquaForce 30XA air-cooledchiller, one of the most energy efficient on the market.
<strong>2012</strong> ANNUAL REPORT | 05We make products that make modern life possible— products that set the standard forenergy efficiency, performance and reliability.01020304 05
06 | UNITED TECHNOLOGIES CORPORATIONAccelerateGrowth<strong>United</strong> <strong>Technologies</strong> is uniquelypositioned to benefit from widespreadurbanization and the rapidly growingcommercial aerospace market,accelerating our growth well intothe future.The Boeing 787 Dreamliner isequipped with 20 major systemsand components from UTCAerospace Systems, the largestsystems supplier to the aircraft.
<strong>2012</strong> ANNUAL REPORT | 07Mumbai demonstratesthe powerful force ofurbanization. By 2025, itspopulation is expected toreach more than 26 million,more than double that in1990. In the years ahead,similar urbanization willoccur in countries such asColombia, Indonesia, Mexico,Nigeria and Vietnam, whichhave a combined populationof nearly 2 billion people.In the decades ahead, a much greater portion of the world’spopulation will live in urban centers, driving investment ininfrastructure and real estate development. This will createdemand for products that contribute to clean, safe, energyefficientbuildings. Our commercial businesses — Otis andUTC Climate, Controls & Security — are well established in theworld’s fastest-growing economies and are moving quickly tofurther localize manufacturing and distribution networks tocapture new opportunities and better serve customers.Otis’ actions in China are a good example. In the years ahead, China will continueto be the world’s largest market for new elevator equipment as well as the world’sfastest-growing service market. In response, Otis businesses have hired and trainedhundreds of new service technicians, and Otis is transitioning its high-rise center ofexcellence, global marketing and business development functions to China.We also are expanding our presence in India. In <strong>2012</strong>, UTC Climate, Controls &Security formed a joint venture to manufacture and distribute heating, ventilation andair-conditioning (HVAC) products in the country. This builds on similar joint ventures inArgentina, Brazil, Chile and Egypt. The company also acquired one of India’s leadingproviders of integrated building 12 management systems.1030U.S. 2.8 838.0 8.025620Europe 11.3 13.0 5.0154China 1.4 7.0 100.3India 0.2 1.0 0.1Elevators(Elevators per1,000 people)20HVAC($, HVAC spendper capita)403550CommercialRefrigeration($, CR spend per capita)876543210The V2500 SelectOne turbofanengine is the most technologicallyadvanced engine in its class,delivering best-in-class reliability,cost of performance and fuel burn.The outlook for our commercial aerospacebusinesses is very strong, driven by the needto replace aging fleets in North America and byincreasing demand across Asia. Over the next20 years, 30,000 new aircraft are expectedto enter service.<strong>United</strong> <strong>Technologies</strong> is at the forefront in developing the nextgeneration of aircraft to meet this growing demand. This includesthe Boeing 787 Dreamliner, the most advanced commercialaircraft in its class on the market. UTC Aerospace Systems wasinstrumental in the design and launch of this more all-electricaircraft. As newer aircraft enter service, our acquisition of Goodrichwill allow us to provide greater value to our customers with better,more integrated products and services at a more competitive price.Our majority ownership in the IAE International Aero Engines AGcollaboration will drive growth by increasing our share in what isexpected to be a 7,500-engine fleet. IAE already has deliveredmore than 5,000 engines, with most of them early in their life cycle.This represents a strong aftermarket growth opportunity. Thenew IAE structure also will allow customers to smoothly transitionto Pratt & Whitney’s new PurePower GTF engine for the AirbusA320neo aircraft family.
08 | UNITED TECHNOLOGIES CORPORATIONAcceleratePerformanceTop performance means meeting — andexceeding — our customers’ expectations.Our game-changing technologies andworld-class products and services ensurethat we deliver high customer value.
Sikorsky’s S-92 helicopter isused to transport workers toand from offshore petroleumoperations, as well as forexecutive transportation andsearch-and-rescue missions.<strong>2012</strong> ANNUAL REPORT| 09Our aerospace businesses continue to raise the performance bar.Sikorsky’s S-92 helicopter, certified to the most stringent safetystandards of the Federal Aviation Administration and the EuropeanAviation Safety Agency, enables operators to conduct critical offshorepetroleum operations and search-and-rescue missions even in severeweather. In <strong>2012</strong>, the FAA certified the aircraft’s newest flotation systemfor its capability to perform in Sea State 6 conditions, when waves canreach as high as 20 feet and winds as strong as 47 knots. The aircraft’sreputation for safety and robustness helped produce an order backlogtotaling $1.5 billion by year-end.Pratt & Whitney’s new PurePower GTF engine also promises to be a game changer when it entersservice. The ultra-efficient engine is expected to reduce fuel burn by up to 16 percent, nitrogenoxide emissions by half and airport ground noise by 75 percent. Another big advantage — it isexpected to generate an annual cost savings of up to $1.5 million per aircraft over today’s bestengines in its class. The PurePower engine has been chosen to power next-generation aircraftfrom Airbus, Bombardier, Embraer, Irkut and Mitsubishi Aircraft Corporation.Top performance depends on people. In <strong>2012</strong>, more than 40,000 UTC Aerospace Systemsemployees demonstrated a remarkable ability to embrace change and accelerate performance.Ten months after the announcement of the largest acquisition in aerospace history, theemployees of Goodrich and Hamilton Sundstrand came together as one integrated company.Intensive planning, coordination and teamwork resulted in seamless customer support andthe achievement of all financial commitments.Otis and UTC Climate, Controls & Security arecommitted to offering customers innovative,high-performing products. Otis’ NCE escalatoris equipped with an energy-saving regenerativedrive, power-standby features, LED lightingand high-efficiency lubrication. Recognizedfor its world-class customer service, Otissoon will launch eService mobile, an app thatenables customers to monitor the status of theirelevators and log service calls from a mobiledevice while on the go.Otis’ tradition ofinnovation continueswith the NCE escalator.During the year, several Carrier products achievedbreakthrough energy efficiency and industry-leadingperformance, including the Evergreen 23XRV chiller withFoxfire compression technology and the Infinity 98 gasfurnace. These products demonstrate UTC Climate,Controls & Security’s commitment to innovation.
10 |UNITED TECHNOLOGIES CORPORATIONAccelerateProductivityContinuous improvement is in our DNA.In everything we do — from developing newproducts to finding better ways to serveour customers — we aim for ever higherlevels of performance.A UTC Climate, Controls & Securitymanufacturing facility in Monterrey,Mexico, was the first facilityof its kind to achieve LEED Goldcertification for energy andenvironmental performance.
<strong>2012</strong> ANNUAL REPORT| 11At the center of our continuous improvementefforts is our ACE (Achieving CompetitiveExcellence) operating system. The commontools and language of ACE allow us to leverageour global scale to improve margins and providebetter value to our customers. By the end of<strong>2012</strong>, we had reached our goal of having80 percent of our sites achieve the highestoperating performance levels of ACE Silver orGold. The addition of Goodrich to the portfolioresets this number to nearly 70 percent and providesadditional opportunity to leverage ACE.The Goodrich acquisitionbrings tremendousnew capabilities and acomplementary portfolioof products, includingevacuation slides for aircraftsuch as the Airbus A380.In addition to this reset, we raised the productivity and performancerequirements for our own operations as well as forour key suppliers. We anticipate significant improvement inproductivity, quality, delivery and overall financial performanceas we drive toward our new goals of 80 percent of our sites— and 75 percent of our key supplier spend — at the highestACE performance levels.Along with tremendous new capabilities, technologiesand leadership talent, Goodrich brought with it a sharedcommitment to working with customers to drive continuousimprovement. Highlighting this approach was the design,development and testing of its evacuation slides for theAirbus A380, which demonstrated that 873 people — thefull capacity of the aircraft — could evacuate safely andreliably in 78 seconds, exceeding the 90-secondgovernment requirement.ACE enables us to meet the evolving needsof our customers while improving overallcompany performance. In Monterrey, Mexico,UTC Climate, Controls & Security has demonstratedthe dramatic improvements ACEcan deliver. Since 2009, productivity basedon cost per hour has improved 41 percent,on-time delivery has improved to 95 percent,first pass yield has improved to 97 percent,and net inventory turnovers have improvedby more than 76 percent. Most important, thefacility had no lost workday injuries in <strong>2012</strong>.In Monterrey, Mexico, UTC Climate,Controls & Security uses the ACEoperating system to improveperformance and better supportcustomers.The company’s heating, ventilation and air-conditioningfactory in Monterrey was the world’s first facility of its kindto be certified LEED Gold and the first industrial facilityoutside the <strong>United</strong> States to achieve the ranking for anexisting facility. LEED, the U.S. Green Building Council’scertification program, sets the standard for the energyand environmental performance of buildings.
12 | UNITED TECHNOLOGIES CORPORATIONOTISRuixue Zhao, Yanlin ZhangChongqing, ChinaSikorskyBob Arseneault, Joel Vigue, Stacy Sheard, Rod DuplinCoatesville, PennsylvaniaAccelerateSuccessOur employees have a reputation forinnovative thinking — aiming for the biggestimprovements and the best solutions.
<strong>2012</strong> ANNUAL REPORT| 13Pratt & whitneyLulues SuhaniEast Hartford, ConnecticutUTC Climate, Controls & SecuritySubhash ChandGurgaon, IndiaWe encourage and support lifelong learning. Welaunched our Employee Scholar Program in 1996.In <strong>2012</strong>, we celebrated a milestone, reaching aninvestment of $1 billion in this program. Whilemany companies offer some form of tuitionreimbursement, our employees never even seea bill. We pay upfront and directly to schools,covering the costs of tuition, fees and books —up to annual and total degree limits — for anyemployee, anywhere in the world.There is no requirement for employees to remain at UTC uponcompletion of a degree, but we are pleased that the vast majoritydo. We also are pleased at the recognition our program hasreceived by third parties, including the National Associationof Independent Colleges and Universities, as one of the mostgenerous employee education programs in the world.To attract and retain a highly skilled workforce, we offercompetitive benefits that help employees save for their future.In <strong>2012</strong>, we launched our newest initiative, the Lifetime IncomeStrategy. A first of its kind, it provides employees in our 401(k)savings plan an affordable and effective option for secure incomein retirement. The new feature allows for income protection inretirement by combining the efficiency and simplicity of a targetdate portfolio with the security and certainty of retirementincome guaranteed for life by top-rated insurance companies.UTC Aerospace SystemsJason RaaumSeattle, Washington
14 |UNITED TECHNOLOGIES CORPORATIONAccelerateOurApproachAs <strong>United</strong> <strong>Technologies</strong> continues to growin markets around the world, we bring withus a belief that financial performance andcorporate responsibility go hand in hand.As a responsible corporate citizen, we are committed to minimizing the environmental impact of ourproducts, our operations and our supply chain. We provide a safe work environment and support lifelonglearning for all employees. We support charitable and social causes in the communities where we liveand work. Everywhere we do business, we apply the highest standards of corporate responsibilityand measure success with the same set of ethical, environmental and safety metrics.GovernanceThe integrity, reputation and profitability of <strong>United</strong> <strong>Technologies</strong> depend upon theindividual actions of our directors, officers, employees and representatives all overthe world. Each is responsible and accountable for compliance with our Code ofEthics. And each of us shares a goal to be world class in all that we do — aiming foroutstanding operational and financial performance, the highest ethical standards,the safest work environment and the best compliance practices.Taking Responsibility for Our ActionsIn <strong>2012</strong>, we entered into agreements with the U.S.Department of Justice and the U.S. Department ofState to resolve a number of enforcement actionsrelated to export licensing requirements. We havetaken considerable steps to strengthen our exportlicensing compliance program and continue to buildon this progress so that it will be as renowned forexcellence as are our people and products.Maintaining an Ethical CultureThe Code of Ethics embodies our commitment topromoting an environment of trust, respect andintegrity. This includes communicating openly,honoring all commitments and holding ourselvesaccountable to the highest standards.Maintaining an ethical culture requires a coordinatedand disciplined approach across every countrywhere we operate. Our network of Business PracticeOfficers (BPOs) plays a critical and valuable role byfacilitating open communications, providing ongoingtraining and investigating allegations of wrongdoing.Here are a few of them.“Impacting organizationalculture is anongoing process,as opposed to asuccessful event.UTC’s commitmentto continuousimprovement requiresthat we regularly buildupon yesterday’saccomplishments.”Anthony GraySikorskyStratford, Connecticut
<strong>2012</strong> ANNUAL REPORT| 15Environment, Health& Safety (EH&S)Discipline and focus guide our efforts to continuously improve ourEH&S performance. Across UTC we apply a global standard aimedat eliminating adverse impacts in our products, our manufacturingprocesses and our supply chain. This produces meaningful benefitsfor our employees and our customers in the communities and marketswhere we operate. With the Goodrich integration in <strong>2012</strong>, this uniformapproach was introduced to thousands of new employees at morethan 100 additional manufacturing locations.Conserving Natural ResourcesUTC has a successful history of implementingwater conservation efforts, reducing wateruse by 32 percent since 2006, with a goalof achieving a 40 percent reduction by 2015.In Singapore, Pratt & Whitney CommercialEngines modified onsite plumbing at threefacilities as part of its voluntary participationin NEWater — a water recycling and reuseprogram developed by Singapore’s PublicUtilities Board. This innovative partnershipaccomplishes the goals of resource conservationand economic growth, and has resultedin decreasing water discharges by approximately15 million gallons per year. In WindsorLocks, Conn., UTC Aerospace Systemsemployees designed and installed a wastewaterreuse and recycling system that isapplied across multiple manufacturing processesand has reduced freshwater intake by12 million gallons a year. Extending beyond ouroperations, UTC collaborates with ONE DROP,a nongovernmental organization, to support amultiyear project in Orissa, India, to bring safedrinking water to more than 100 villages.“I have three principalpriorities: to protectthe company’sreputation by makingsure we have a highethical culture; toensure we are inlegal compliance ineverything we do; andto be a role modeland inspiration tomy colleagues.”“Because BPOsoperate at a peerlevel rather than as acorporate overseer, weare able to have a realimpact in helping allemployees determinethe appropriate actionor behavior in thevaried situationsthey encounter.”“It is important to leadby example and bea role model. BPOsassist and guideemployees in makingsure that we succeedas an organization bydoing business theright way.”“It is very importantthat we operateour business in anethical manner. Beingresponsible for ensuringthis is very rewarding.I appreciate the trustand accountabilitythe organization hasplaced upon me asan individual.”“All of us with ChengduAerotech Manufacturingare working hard tomake this facility theworld-class center ofexcellence for Pratt &Whitney in the region.We believe the higheststandards of ethicsand business conductare fundamental toour success.”Jose HerreraUTC Climate,Controls & SecurityMonterrey, MexicoAmina KherboucheUTC Climate,Controls & SecurityQuébec, CanadaMike MirandaOtis<strong>United</strong> Arab EmiratesSantosh SettyUTC AerospaceSystemsBengaluru, IndiaLily XuPratt & WhitneyChengdu, China
16 | UNITED TECHNOLOGIES CORPORATIONFIRST Robotics: Pratt & Whitney engineers Renee Jurek andPatrick Booth exemplify our commitment to “make thingsbetter.” As volunteer mentors for Athena’s Warriors — a highschool team from West Hartford, Conn. — they share theirtime and expertise and help to build a robot for competition.Also mentoring the team are Pratt & Whitney colleaguesMonica Mohtasham and Eric Savage (not shown).Leading in theCommunityOur people lead in their communities — volunteeringtime, talent and expertise. We celebrate and encouragetheir efforts because we believe <strong>United</strong> <strong>Technologies</strong>and our employees can have a positive impact in ourcommunities around the world.To learn how our employees are making things better,visit www.utc.com/makethingsbetter.
<strong>2012</strong> ANNUAL REPORT| 19CorporateResponsibilityKey Performance Indicators measure UTC’s sustainability goals and performance for current anddiscontinued operations. UTC reporting standards include the ongoing analysis and correctionof data, as applicable, following the close of a reporting period. Consequently, previously reportedannual metric results may change between annual reporting periods, and UTC may include any prioryear data revisions in current reporting. Additional information detailing our progress is available atwww.utc.com/responsibility.Non-GreenhouseGas EmissionsMillion lbsGreenhouse Gas EmissionsMillion metric tons CO2eIndustrial Process WasteMillion lbs1.31 1.95 1.891.191.24 1.51.850.92 0.921.20.91.751.822.01.52552422472232033002502001.01500.610009 10 11 12 150.30.009 10 11 12 150.50.009 10 11 12 15500Non-Recycled IndustrialProcess WasteMillion lbsWorldwide WaterConsumptionBillion galsLost WorkdayIncident RateCases/100 employees61.055.051.447.843.38070601.651.621.561.401.232.01.50.180.200.190.150.140.200.1550401.00.1030200.50.0509 10 11 12 1510009 10 11 12 150.009 10 11 12 150.00Total RecordableIncident RateCases/100 employeesSupplier EH&SPercent critical suppliersmeeting expectations0.75 0.74 0.730.680.640.80.7100 100931000.6800.5600.40.3613834903400.22009 10 11 12 150.10.010 11 120
20 | UNITED TECHNOLOGIES CORPORATIONBusiness HighlightsElevators, escalators and moving walkwaysfor all types of buildings, including commercial,residential, multipurpose malls, educationalinstitutions and urban transportation systems.employees61,763Net Sales$12.1 BillionOperating Profit$2.5 BillionHeating, ventilating, air-conditioning and refrigerationsystems (HVACR); services and sustainable solutionsfor residential, commercial, industrial, food serviceand transportation applications; building controlsand automation; fire detection and alarm systems;suppression systems; and security solutions.0102 03employees61,272Net Sales$17.1 BillionOperating Profit$2.4 Billion
<strong>2012</strong> ANNUAL REPORT| 21Otis elevators, escalators and moving walkwaysare the innovative systems of choicefor some of the largest and most ambitiousbuilding projects around the globe.During the year, its <strong>United</strong> Kingdom businesswas awarded the largest contract in its history— a 30-year contract to install, maintain andmodernize 107 escalator units for the LondonCrossrail, a new high-frequency railway systemand Europe’s largest construction project.Work is scheduled to begin in early 2013.Otis businesses will supply 208 energyefficientGen2 and Sky series elevators to theCastle Jiujun project, a more than 7.5-millionsquare-footecological and livable communityin southern Harbin, China. Also in China, Otiscompanies will provide 299 escalators and 50elevators to the Hangzhou Metro Line 2, one ofthe country’s new, high-speed rail systems.Otis continues to be a part of some of theworld’s most iconic buildings. Its company inBrazil will install 21 elevators and escalatorsin Rio de Janeiro’s famous Maracanã Stadium,site of the 2014 FIFA World Cup final championshipmatch and the 2016 Summer Olympicsopening and closing ceremonies. The companyalso is assisting with the modernizationof the Sydney Opera House in Australia, one ofthe world’s most distinctive buildings.Otis companies are building a number offactories to meet growing demand. Duringthe year, Otis companies opened the seventhfactory in China and began expansion on afactory in Bengaluru, India. In 2013, the companywill open a 423,000-square-foot facility inFlorence, S.C., which will be its main manufacturingcenter for U.S. and Canadian operations.Another factory is under construction in Brazil.Otis Elite service is a key differentiator forthe company. Using innovative, Web-basedtechnology, it offers customers an unprecedentedlevel of support and benefits that helpensure maximum equipment reliability andefficient repairs of their elevator systems.Otis Elite service subscriptions were up25 percent from 2011.The Otis regenerative drive continues to setthe standard for innovation and performance.When used on elevators, it captures energyonce lost during braking and returns it to theelectrical grid, providing up to 75 percentmore energy efficiency.UTC Climate, Controls & Security deliverssolutions to customers worldwide from leadingbrands such as Carrier, Automated Logic,Lenel, Chubb, Det-Tronics, Edwards, Fenwal,Interlogix, Kidde, Marioff and Supra.During the year, the company sustainedmomentum from the completed Carrier transformation,which began in 2008 to simplifythe business and concentrate on core growthplatforms. The company also focused onimproving and transforming its fire andsecurity operations.Numerous product innovations wereintroduced in <strong>2012</strong>, including Kidde’s newWorry-Free line of smoke alarms. Equippedwith a 10-year, sealed-in battery, the alarmsaddress customer complaints of low-batterychirps and fire industry concerns aboutmissing or dead batteries in alarm units.Carrier Transicold introduced ecoFORWARDtechnologies in advance of U.S. EnvironmentalProtection Agency diesel emission standards,which went into effect January 1, 2013. Trailerrefrigeration systems with ecoFORWARDtechnologies consume significantly less fuel,operate more quietly and deliver improvedperformance, all while running cleaner than themodels they are replacing.Lenel introduced OnGuard <strong>2012</strong>, the latestrelease of its industry-leading securitymanagement platform. Customers benefitfrom OnGuard’s strong integration capabilityand increased functionality. Deployed intransit vehicles around the world, Interlogix’sMobileView is the first and only mobile surveillancesolution to be designated QualifiedAnti-Terrorism Technology by the U.S.Department of Homeland Security.<strong>2012</strong> marked the 500 th installation of Carrier’sCO 2 OLtec refrigeration system, this one in anew Famila market in Friesoythe, Germany.Carrier’s CO 2 OLtec installations across Europereduce carbon dioxide equivalent emissionsby 137,100 tons, equal to taking 37,200 carsoff the road. Carrier also won its largest orderin Saudi Arabia during the year with a contractto supply and install large chillers to coolKing Saud University.Automated Logic will provide the building automationsystem for The Tower at PNC Plaza,a 32-story office building under constructionin Pittsburgh, Pa., that is expected to exceedLEED Platinum standards and become theworld’s greenest skyscraper. The system willprovide a comfortable environment for thebuilding’s occupants through control andmonitoring of heating, cooling and manythird-party systems.Supra won six contract renewals to supplyiBox products to real estate associationsthroughout the <strong>United</strong> States. Five of thecontracts were for the new iBox BT, a realestate key box that can interact withBluetooth smartphones.UTC Climate, Controls & Security reacheda number of milestones in <strong>2012</strong>. SeveralCarrier products achieved breakthroughenergy efficiency: Among them were the newWeatherExpert packaged rooftop unit, thenew Infinity 98 gas furnace with Greenspeedintelligence and the Evergreen 23XRV chillerwith Foxfire compression, which set a newrecord for chiller efficiency. CarrierTransicold’s NaturaLINE and PrimeLINEcontainer refrigeration units were validatedby UL Environment as having 95 percent and93 percent recyclability rates, respectively,the only container refrigeration units in theindustry to achieve recyclability validation.01 Carrier’s AquaForce 30XA chiller is designedto meet the efficiency demands of today andthe future.02 UT Electronic Controls, which designs,sources and manufactures microprocessor-basedcontrols, is the first electronicsmanufacturing facility to receive LEED Goldcertification for existing buildings.03 Customers no longer have to worry aboutreplacing smoke alarm batteries. Kidde’snew Worry-Free line of smoke alarms comeswith a 10-year, sealed-in battery.
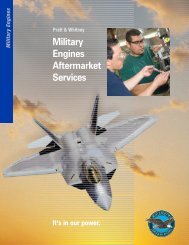
22 | UNITED TECHNOLOGIES CORPORATIONBusiness HighlightsMilitary and commercial helicopters; fixed-wingaircraft; spare parts and maintenance, repair andoverhaul services for helicopters and fixed-wingaircraft; civil helicopter operations.employees16,591Net Sales$6.8 BillionOperating Profit$712 MillionUTC Propulsion & Aerospace SystemsTurbofan engines for large commercial, businessand military aircraft; turboprop engines for regionalairline, business, utility and military aircraft;turboshaft engines for commercial and militaryhelicopters; power units; maintenance, repair andoverhaul services, including the sale of spare partsas well as fleet management services.employees35,847Net Sales$14.0 BillionOperating Profit$1.6 BillionAircraft systems for actuation, aerostructures,air management, interiors, landing gear, propellers,and aircraft wheels and brakes; power controlsand sensing systems for electric systems, enginecomponents, engine and control systems, fireprotection, ISR systems, sensors and integratedsystems, and space systems.employees40,972Net Sales$8.3 BillionOperating Profit$944 Million
<strong>2012</strong> ANNUAL REPORT | 23Sikorsky’s new, highly anticipated S-76Dhelicopter entered the market late in <strong>2012</strong>.The helicopter offers customers a highercruise speed than its predecessor as wellas greater fuel efficiencies and quieteroperation. The S-76D is designed for use inoffshore petroleum operations, executivetransportation, search and rescue, andemergency medical services.During the year, the U.S. Army accepted deliveryof the 500 th H-60M BLACK HAWK helicopter.The deliveries, which began in 2007, includeaircraft contracted by the U.S. Army for severalother U.S. government agencies and foreignmilitaries. Subject to annual funding approvals,the U.S. Army and U.S. Navy have agreed topurchase a baseline quantity of 653 BLACKHAWK and SEAHAWK helicopters over the nextfive years, with an option to purchase an additional263 under the same financial terms.Sikorsky helicopters entered new marketsduring the year. Thailand signed to acquire twoUH-60M BLACK HAWK helicopters, becomingthe first country in Southeast Asia to operatethe aircraft. Sweden took delivery of its finaltwo of 15 UH-60M helicopters as the firstcountry in Europe to receive the advancedaircraft. On the commercial aircraft side,Sikorsky sold its first new S-76D helicoptersto customers with operations in China, Japanand Mexico.Sikorsky's aftermarket company signed a fouryearagreement with the Australian DefenceForce for ongoing logistics and engineeringsupport for the country’s fleet of BLACK HAWKand SEAHAWK helicopters.Sikorsky moved forward with the developmentof the CH-53K helicopter for the U.S. MarineCorps. During the year, it delivered the firstprototype for ground-based flight systemstesting. When it enters service in 2018, theCH-53K will be the largest heavy-lift maritimehelicopter in the world, capable of carrying avehicle the size of a Humvee.Sikorsky’s revolutionary S-97 RAIDERhelicopter is now in the engineering phaseof development. The light tactical helicopterwill be able to cruise comfortably at 220knots — nearly twice the cruise speed ofconventional helicopters — while retainingall the attributes of today’s highestperforming helicopters.Sikorsky's new S-76D helicopter raisesthe standard of excellence, with power andperformance enhanced by all-composite mainrotor blades and optimized Pratt & WhitneyCanada PW210S engines.The revolutionary PurePower GTF enginecontinued to achieve new milestones during theyear. The PW1500G engine, which will powerthe Bombardier CSeries aircraft, completedcertification testing early in 2013 and is on trackto meet Bombardier’s first flight schedule. ThePW1200G engine for the Mitsubishi RegionalJet has completed its first test flights on Pratt& Whitney’s flying test bed. The companycompleted assembly of the first PW1100G-JMengine for the Airbus A320neo family of aircraftand began full engine testing. At the end of<strong>2012</strong>, orders had been announced for nearly3,000 PurePower engines, including options.Pratt & Whitney Canada’s next-generationPT6A-140 engine was chosen by CessnaAircraft Company to power the new CessnaGrand Caravan EX, which entered into serviceat the end of <strong>2012</strong>.Milestones also were achieved in the F135and F119 programs. At the end of the year,87 production engines for the fifth-generationF-35 Lightning II fighter had been deliveredto the U.S. Department of Defense andinternational partners. In <strong>2012</strong>, the U.S. AirForce initiated formal pilot training and logged711 operational flights, and the U.S. MarineCorps stood up the world’s first operationalF-35B STOVL squadron. Pratt & Whitney alsodelivered the 507 th and final F119 productionengine for the Lockheed Martin F-22 Raptor,shifting focus to a sustainment partnershipwith the U.S. Air Force.The company was selected for the U.S. AirForce Research Laboratory’s Adaptive EngineTechnology Development program to developinnovative solutions that will lower fuel costsand increase operational capability for the nextgeneration of combat aircraft.Boeing awarded Pratt & Whitney the enginecontract for the U.S. Air Force’s KC-46 aerialrefueling aircraft, calling for as many as368 PW4062 engines to be delivered through2027. The first four F117 engines were deliveredto the Indian Air Force to power its fleet ofBoeing C-17 Globemaster III aircraft and 40additional engines are on contract for delivery.Pratt & Whitney AeroPower, a new divisionrealigned from Hamilton Sundstrand,provides auxiliary and ground power unitsand small turbojet propulsion products tothe aviation market.Pratt & Whitney completed the assemblyof its first engine to test its PurePowerPW1100G-JM engine, which will power thenext-generation Airbus A320neo aircraft.UTC Aerospace Systems achieved a numberof milestones during the year. The EuropeanSafety Agency certified its FH385/386propeller system for the Airbus A400M MilitaryTransport Aircraft. The A400M has a 17.5-footdiameterpropeller system that features eightall-composite blades. It is the largest allcompositepropeller in production.The company delivered to the U.S. NavyReserve the first of 30 Electronic PropellerControl System (EPCS) upgraded aircraft.EPCS uses digital computer software andoffers improved reliability and more preciseperformance than previous technologies.<strong>2012</strong> also marked the delivery of the1,000 th shipset of 777 landing gear to Boeingfor Emirates airline. The company hasproduced landing gear for the Boeing 777for approximately 20 years.A key supplier in the development of theBoeing 787 Dreamliner, UTC AerospaceSystems continues to work with Boeing as itramps up production. During the year UTCAerospace Systems expanded a productionfacility to provide nacelles for the aircraft.UTC Aerospace Systems is working closelywith Southwest Airlines as it updates itsfleet with Boeing’s next-generation 737-800.The company will supply wheels and brakesfor the new aircraft, as well as providemaintenance and asset management.The ORS-1 satellite celebrated its first anniversaryin space in <strong>2012</strong>. The first OperationallyResponsive Space satellite, it went fromdrawing board to delivery in 30 months.Designed, manufactured, integrated andtested in-house, in 2011 it was named one ofthe nation’s 25 most important concepts byC4ISR Journal, which is published by theDefense News Media Group.A number of major contracts were securedduring the year, including one to providewheels, brakes and integrated brake controlsystems for the Cessna Longitude businessjet and one to provide new wheel and carbonbrake equipment for the new Airbus A320neo.Contracts on the military side include an orderby the U.S. Army for 80 spare health and usagemanagement system (HUMS) electronic unitsfor its UH-60 BLACK HAWK helicopters. Thecompany also received a multiyear overhauland repair contract with the U.S. Army forBLACK HAWK T700 fuel controls. UTCAerospace Systems was awarded significantcontent on the new Embraer KC-390, which isbeing developed for the Brazilian Air Force.The popular Airbus A350XWB aircraft isequipped with multiple systems andcomponents from UTC Aerospace Systems,including landing gear, power generation,nacelles, and aircraft wheels and brakes.
24 | UNITED TECHNOLOGIES CORPORATIONOur Commitments definewho we are and how we work.They focus our businesses andmove us forward.PerformanceOur customers have a choice, andhow we perform determines whetherthey choose us. We aim high, setambitious goals and deliver results,and we use customer feedbackto recalibrate when necessary.We move quickly and make timely,well-reasoned decisions because ourfuture depends on them. We investauthority where it needs to be, in thehands of the people closest to thecustomer and the work.InnovationWe are a company of ideas thatare nurtured by a commitment toresearch and development. Theachievements of our foundersinspire us to reach always for thenext innovative and powerfuland marketable idea. We seekand share ideas openly, andencourage diversity of experienceand opinion.opportunityOur employees’ ideas and inspirationcreate opportunities constantly, andwithout limits. We improve continuouslyeverything we do, as a company and asindividuals. We support and pursue lifelonglearning to expand our knowledgeand capabilities and to engage with theworld outside UTC. Confidence spurs usto take prudent risks, to experiment, tocooperate with each other and, always,to learn from the consequences ofour actions.responsibilitySuccessful businesses improve thehuman condition. We maintain the highestethical, environmental and safetystandards everywhere, and we encourageand celebrate our employees’ activeroles in their communities.resultsWe are a preferred investment becausewe meet aggressive targets whateverthe economic environment. We communicatehonestly and forthrightly toinvestors, and deliver consistentlywhat we promise. We are a company ofrealists and optimists, and we projectthese values in everything we do.
<strong>2012</strong> ANNUAL REPORT| 25Financial Table of Contents26 FIVE-YEAR SUMMARY27 MANAGEMENT’S DISCUSSION AND ANALYSIS53 CAUTIONARY NOTE CONCERNING FACTORS THAT MAYAFFECT FUTURE RESULTS54 MANAGEMENT’S REPORT ON INTERNAL CONTROLOVER FINANCIAL REPORTING55 REPORT OF INDEPENDENT REGISTERED PUBLIC ACCOUNTING FIRM56 CONSOLIDATED STATEMENT OF OPERATIONS57 CONSOLIDATED STATEMENT OF COMPREHENSIVE INCOME58 CONSOLIDATED BALANCE SHEET59 CONSOLIDATED STATEMENT OF CASH FLOWS60 CONSOLIDATED STATEMENT OF CHANGES IN EQUITY62 NOTES TO CONSOLIDATED FINANCIAL STATEMENTS98 BOARD OF DIRECTORS98 PERMANENT COMMITTEES99 LEADERSHIP100 SHAREOWNER INFORMATION
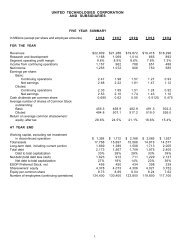
26 UNITED TECHNOLOGIES CORPORATIONFive-Year Summary(DOLLARS IN MILLIONS, EXCEPT PER SHARE AMOUNTS) <strong>2012</strong> 2011 2010 2009 2008For The YearNet sales $ 57,708 $ 55,754 $ 52,275 $ 50,469 $ 56,824Research and development 5 2,371 1,951 1,656 1,460 1,650Restructuring costs 590 315 387 787 328Net income from continuing operations 5,200 5,216 4,523 4,060 4,890Net income from continuing operations attributable to commonshareowners 4,847 4,831 4,195 3,719 4,534Basic earnings per share—Net income from continuing operationsattributable to common shareowners 5.41 5.41 4.62 4.05 4.83Diluted earnings per share—Net income from continuing operationsattributable to common shareowners 5.35 5.33 4.55 4.00 4.74Cash dividends per common share 2.03 1.87 1.70 1.54 1.35Average number of shares of Common Stock outstanding:Basic 895 892 908 917 938Diluted 907 907 923 929 956Cash flows provided by operating activities of continuing operations 6,605 6,460 5,720 5,083 5,962Capital expenditures 1,389 929 838 773 1,137Acquisitions, including debt assumed 4 18,620 372 2,781 676 1,408Repurchases of Common Stock 6 – 2,175 2,200 1,100 3,160Dividends paid on Common Stock 1 1,752 1,602 1,482 1,356 1,210At Year EndWorking capital $ 5,174 $ 7,142 $ 5,778 $ 5,281 $ 4,665Total assets 4 89,409 61,452 58,493 55,762 56,837Long-term debt, including current portion 2 22,718 9,630 10,173 9,490 10,453Total debt 2 23,221 10,260 10,289 9,744 11,476Total debt to total capitalization 2 46% 31% 32% 32% 41%Total equity 2 27,069 22,820 22,323 20,999 16,681Number of employees 3, 4 218,300 199,900 208,200 206,700 223,100Amounts presented for 2008-2011 have been restated to reflect results from continuing operations consistent with <strong>2012</strong>presentation, where applicable. Refer to “Business Overview” section for additional information.Note 1 Excludes dividends paid on Employee Stock Ownership Plan Common Stock.Note 2 The decrease in the 2009 debt to total capitalization ratio, as compared to 2008, reflects the reversal of unrealized losses inour pension plans of approximately $1.1 billion, the beneficial impact of foreign exchange rate movement of approximately$1.0 billion, and the reduction of approximately $1.7 billion of total debt. The increase in the <strong>2012</strong> debt to total capitalizationratio, as compared to 2011, reflects the issuance of $9.8 billion in long-term debt, $1.1 billion in equity units and theassumption of approximately $3 billion in long-term debt in connection with the acquisition of Goodrich. In connection with acash tender offer, approximately $635 million ($761 million fair value) of principal amount of legacy Goodrich debt was retiredin the fourth quarter <strong>2012</strong>.Note 3 The decrease in 2011, as compared with 2010, includes the impact of divestitures primarily within the UTC Climate,Controls & Security segment, as well as net workforce reductions associated with restructuring actions across UTC.Note 4 The increase in <strong>2012</strong>, as compared with 2011, includes the net impact of acquisitions and divestitures across the Company,most notably the <strong>2012</strong> acquisition of Goodrich and divestiture of the legacy Hamilton Sundstrand Industrial business, bothwithin the UTC Aerospace Systems segment, as well as the impact of other acquisitions and dispositions and restructuringactions across UTC.Note 5 The increase in <strong>2012</strong>, as compared with 2011, includes approximately $250 million incremental research and developmentspending related to the Goodrich businesses that were acquired during <strong>2012</strong>, and approximately $65 million at Pratt &Whitney to further advance development of multiple geared turbo fan platforms.Note 6 In connection with the acquisition of Goodrich, repurchases of common stock under our share repurchase program weresuspended for <strong>2012</strong>.
Management’s Discussion and Analysis <strong>2012</strong> ANNUAL REPORT 27Management’s Discussion and AnalysisMANAGEMENT’S DISCUSSION AND ANALYSIS OF FINANCIALCONDITION AND RESULTS OF OPERATIONSBUSINESS OVERVIEWWe are a global provider of high technology products and servicesto the building systems and aerospace industries. Our operationsfor the periods presented herein are classified into five principalbusiness segments: Otis, UTC Climate, Controls & Security, Pratt &Whitney, UTC Aerospace Systems and Sikorsky. Otis and UTCClimate, Controls & Security are referred to as the “commercialbusinesses,” while Pratt & Whitney, UTC Aerospace Systems andSikorsky are collectively referred to as the “aerospace businesses.”Certain reclassifications have been made to the prior year amountsto conform to the current year presentation.In <strong>2012</strong>, we implemented a new organizational structurethat allows us to better serve customers, drive growth and achievefurther efficiencies through greater integration across certain productlines. As part of this new structure, effective January 1, <strong>2012</strong>,we formed the UTC Climate, Controls & Security segment, whichcombines the former Carrier and UTC Fire & Security segments.On July 26, <strong>2012</strong>, we acquired Goodrich Corporation(Goodrich) pursuant to a merger agreement dated September 21,2011 for approximately $18.3 billion including $1.9 billion of netdebt assumed. As a result of the acquisition, Goodrich became awholly-owned subsidiary of UTC in the largest acquisition in UTC’shistory. The acquired Goodrich business and the legacy HamiltonSundstrand business have been combined to form a new segmentnamed UTC Aerospace Systems. This segment and our Pratt &Whitney segment are separately reportable segments although theyare both included within the newly formed UTC Propulsion & AerospaceSystems organizational structure. The increased scale,financial strength and complementary products of the new combinedbusiness are expected to continue to strengthen our positionin the aerospace and defense industry. Further, we expect that thisacquisition will enhance our ability to support our customers withmore integrated systems. The results of the acquired Goodrichbusiness have been included in UTC’s financial statements only forperiods subsequent to the completion of the acquisition. As aresult, the consolidated financial results for the year endedDecember 31, <strong>2012</strong> do not reflect a full year of legacy Goodrichoperations. The acquisition resulted in the inclusion of Goodrich’sassets and liabilities as of the acquisition date at their respective fairvalues. Accordingly, the Goodrich acquisition materially affectedUTC’s results of operations and financial position.On June 29, <strong>2012</strong>, Pratt & Whitney, Rolls-Royce plc(Rolls-Royce), MTU Aero Engines AG (MTU) and Japanese AeroEngines Corporation (JAEC), participants in the IAE InternationalAero Engines AG (IAE) collaboration, completed a restructuringof their interests in IAE. Under the terms of the agreement,Rolls-Royce sold its ownership and collaboration interests in IAE toPratt & Whitney, while also entering into a license for its V2500intellectual property with Pratt & Whitney. In exchange for theincreased ownership and collaboration interests and intellectualproperty license, Pratt & Whitney paid Rolls-Royce $1.5 billion atclosing with additional payments due to Rolls-Royce during the fifteenyear period following closing of the purchase, conditional uponeach hour flown by V2500-powered aircraft in service at the closing.Pratt & Whitney entered into a collaboration arrangement with MTUwith respect to a portion of the collaboration interest in IAE acquiredfrom Rolls-Royce for consideration of approximately $233 millionwith additional payments due to Pratt & Whitney in the future. As aresult of these transactions, Pratt & Whitney has a 61% net interestin the collaboration and a 49.5% ownership interest in IAE, whichhas been consolidated by Pratt & Whitney post-transaction.On March 14, <strong>2012</strong>, the Board of Directors of the Companyapproved a plan for the divestiture of a number of non-corebusinesses. Cash generated from these divestitures has been andwill be used to repay the debt issued to finance the acquisition ofGoodrich. These divestitures are expected to generate approximately$3 billion in net cash, on an after-tax basis, when complete.In the first quarter of <strong>2012</strong>, the legacy Hamilton SundstrandIndustrial businesses, Pratt & Whitney Rocketdyne (Rocketdyne)and Clipper Windpower (Clipper) all met the “held-for-sale” criteria.On June 29, <strong>2012</strong>, management of the Company approved a planfor the divestiture of UTC Power. The results of operations, includingthe net gains/losses expected on disposition, and the relatedcash flows which result from these non-core businesses have beenreclassified to Discontinued Operations in our Consolidated Statementsof Operations and Cash Flows for all periods presented. Thesale of the legacy Hamilton Sundstrand Industrial businesses wascompleted in the fourth quarter of <strong>2012</strong>, while the sale of Clipperwas completed in the third quarter of <strong>2012</strong>. On July 23, <strong>2012</strong>, weannounced an agreement to sell our Rocketdyne unit to GenCorpInc. for $550 million. On December 22, <strong>2012</strong>, we announced anagreement to sell our UTC Power unit to ClearEdge Power.Although the Pratt & Whitney Power Systems business was alsoapproved for sale by the Board of Directors of the Company, it wasnot reclassified to Discontinued Operations due to the level ofexpected continuing involvement in the business post-sale. Thesales of the remaining non-core businesses identified for dispositionare expected to be completed in the first half of 2013.In accordance with conditions imposed for regulatory approvalof UTC’s acquisition of Goodrich, UTC must dispose of the electricpower systems and the pumps and engine controls businesses ofGoodrich. These businesses have been held separate from UTC’s andGoodrich’s ongoing businesses pursuant to regulatory obligationssince the acquisition of Goodrich by UTC. On October 16, <strong>2012</strong>, weannounced an agreement to sell the electric power systems businessfor $400 million to Safran, and on January 18, 2013, we announcedan agreement to sell the pumps and engine controls business to TriumphGroup Inc. Closings of both sales are expected by the end ofthe first quarter of 2013 and are subject to regulatory approvals andother customary closing conditions.
28 UNITED TECHNOLOGIES CORPORATIONIn addition to the divestiture of certain non-core businesses,we also issued $9.8 billion in long-term debt, $3.2 billion in commercialpaper, a $2.0 billion term loan and $1.1 billion of equity units tofund the acquisition of Goodrich. As of December 31, <strong>2012</strong>, we haverepaid all of the term loan and nearly all of the commercial paperissued to finance the acquisition.Our consolidated net sales were derived from the commercialand aerospace businesses as follows (sales from Pratt & Whitney’sindustrial markets are included in “commercial andindustrial”):<strong>2012</strong> 2011 2010Commercial and industrial 51% 57% 57%Military aerospace and space 21% 20% 21%Commercial aerospace 28% 23% 22%100% 100% 100%The significant shift in sales from Commercial and industrialto Commercial aerospace largely reflects the Goodrich and IAEtransactions. In <strong>2012</strong>, approximately 57% of our consolidated saleswere original equipment and 43% were aftermarket parts and services,while in 2011 the amounts were 56% and 44%, respectively.The amounts in 2010 were 57% and 43%, respectively.Our worldwide operations can be affected by industrial,economic and political factors on both a regional and global level.To limit the impact of any one industry, or the economy of any singlecountry on our consolidated operating results, our strategy hasbeen, and continues to be, the maintenance of a balanced anddiversified portfolio of businesses. Our operations include originalequipment manufacturing (OEM) and extensive related aftermarketparts and services in both our commercial and aerospace businesses.Our business mix also reflects the combination of shortercycles at UTC Climate, Controls & Security and in our commercialaerospace aftermarket businesses, and longer cycles at Otis and inour aerospace OEM businesses. Our customers include companiesin the private sector and governments, and our businesses reflectan extensive geographic diversification that has evolved with thecontinued globalization of world economies. The composition of netsales from outside the U.S., including U.S. export sales to theseregions, in U.S. Dollars and as a percentage of total segment sales,is as follows:(DOLLARS IN MILLIONS) <strong>2012</strong> 2011 2010 <strong>2012</strong> 2011 2010Europe $ 11,823 $ 12,344 $ 11,678 20% 22% 22%Asia Pacific 8,733 9,016 7,658 15% 16% 15%Other Non-U.S. 4,964 5,376 5,369 9% 10% 10%U.S. Exports 9,201 7,721 7,102 16% 14% 14%Internationalsegment sales $ 34,721 $ 34,457 $ 31,807 60% 62% 61%As part of our growth strategy, we invest in businesses incertain countries that carry high levels of currency, political and/oreconomic risk, such as Argentina, Brazil, China, India, Mexico,Russia, South Africa and countries in the Middle East. AtDecember 31, <strong>2012</strong>, the net assets in any one of these countriesdid not exceed 5% of consolidated shareowners’ equity.As in the previous year, our short cycle shipments and orderrates were mixed across our businesses. In <strong>2012</strong>, as compared with2011, commercial aerospace spares orders at Pratt & Whitneydecreased 12%, excluding additional orders due primarily to theconsolidation of IAE, and UTC Aerospace Systems’ commercialaerospace orders decreased 4%, excluding additional orders fromGoodrich. Ongoing economic uncertainty and high oil prices have ledto continued cash conservation and constrained spending by majorairlines. Strength in UTC Aerospace Systems commercial and militaryaerospace OEM business and military OEM sales at Pratt & Whitney,were offset by fewer deliveries for foreign military operations at Sikorsky.Conversely, UTC Climate, Controls & Security’s North Americanresidential HVAC orders increased approximately 8% in <strong>2012</strong>, whileOtis’ new equipment orders in <strong>2012</strong> were consistent with 2011 orderlevels. While Otis new equipment orders in China declined early in<strong>2012</strong>, order rates increased late in the year with fourth quarter ordersin China 19% higher than the fourth quarter of 2011. Althoughuncertainty surrounding the resolution of the fiscal debate in the U.S.and the European debt crisis, together with the slowdown in Chinaand other emerging economies drove volatility in financial marketsduring <strong>2012</strong>, the economic environment in Europe has recentlybegun to stabilize while the U.S. and China continue gradual recoveries.The 2013 global GDP forecast is 2.5%, with growth expectedto be slower in the first half of the year and uneven across the globe.We continue to expect growth rates in emerging markets, particularlyin China and India, to outpace the rest of the world. Further, thegradual commercial construction recovery in North America throughout<strong>2012</strong> is expected to continue in 2013.We had no organic sales growth during <strong>2012</strong>. We expectorganic sales growth in 2013 to be 3% to 5%.Although we expect an increase in organic growth, which,if realized, would contribute to operating profit growth, we alsocontinue to invest in new platforms and new markets to position usfor additional growth, while remaining focused on structural costreduction, operational improvements and disciplined cashredeployment. These actions contributed to our earnings during<strong>2012</strong> and positioned us for future earnings growth as the globaleconomy recovers. We undertook a significant restructuring initiativein <strong>2012</strong> to reduce structural and overhead costs across all ofour businesses. Restructuring costs in continuing operationstotaled $590 million, $315 million and $387 million in <strong>2012</strong>, 2011and 2010, respectively. Segment operating margin decreased 110basis points from 15.1% in 2011 to 14.0% in <strong>2012</strong>. This year-overyeardecrease is primarily due to a 50 basis point adverse impact ofrestructuring charges and non-recurring items and a 70 basis pointadverse impact from higher research and development expenses.
Management’s Discussion and Analysis <strong>2012</strong> ANNUAL REPORT 29As discussed below in “Results of Operations,” operatingprofit in both <strong>2012</strong> and 2011 includes the impact from nonrecurringitems such as the adverse effect of asset impairmentcharges and the beneficial impact of gains from business divestitureactivities, primarily those related to UTC Climate, Controls & Security’songoing portfolio transformation. Our earnings growth strategycontemplates earnings from organic sales growth, including growthfrom new product development and product improvements, structuralcost reductions, operational improvements, and incrementalearnings from our investments in acquisitions. We invested $18.6billion (including debt assumed of $2.6 billion) and $372 million(including debt assumed of $15 million) in the acquisition of businessesacross the entire company in <strong>2012</strong> and 2011, respectively.Our investment in businesses in <strong>2012</strong> principally reflected theGoodrich and IAE transactions. Acquisitions completed in 2011consisted principally of a number of smaller acquisitions in both ouraerospace and commercial businesses.Both acquisition and restructuring costs associated withbusiness combinations are expensed as incurred. Depending onthe nature and level of acquisition activity, earnings could beadversely impacted due to acquisition and restructuring actions initiatedin connection with the integration of the businesses acquired.For additional discussion of acquisitions and restructuring,see “Liquidity and Financial Condition,” “Restructuring Costs” andNotes 2 and 13 to the Consolidated Financial Statements.RESULTS OF OPERATIONSNet Sales(DOLLARS IN MILLIONS) <strong>2012</strong> 2011 2010Net sales $ 57,708 $ 55,754 $ 52,275Percentage change year-over-year 3.5% 6.7% 3.6%The factors contributing to the total percentage change year-overyearin total net sales are as follows:<strong>2012</strong> 2011Organic volume – 5%Foreign currency translation (2)% 2%Acquisitions and divestitures, net 6% –Total % Change 4% 7%Organic sales growth during <strong>2012</strong>, at UTC AerospaceSystems (7%) and Pratt & Whitney (2%) was offset by organic salescontraction at Sikorsky (8%). The organic sales growth at UTCAerospace Systems was primarily attributable to higher aerospaceOEM volume, while the organic sales growth at Pratt & Whitney wasa result of higher military engine deliveries and aftermarket sales.The organic sales contraction at Sikorsky was driven primarily byfewer aircraft deliveries to the U.S. Government and foreign militaryoperations. There was no organic sales growth within the commercialbusinesses in <strong>2012</strong>. The sales increase from net acquisitionsand divestitures is a result of Goodrich and IAE sales, partially offsetby the ongoing portfolio transformation initiatives at UTC Climate,Controls & Security.All segments experienced organic sales growth during2011, led by Sikorsky (10%), UTC Aerospace Systems (8%), andUTC Climate, Controls & Security (7%). The organic sales growth atSikorsky was primarily attributable to higher military OEM andaftermarket sales, while the organic sales growth at UTC AerospaceSystems was a result of higher volumes in the aerospace OEM andaftermarket businesses. UTC Climate, Controls & Security’s organicsales growth was driven primarily by the recovery in the transportrefrigeration market. The organic sales growth in the remainingbusinesses reflected higher commercial sales and aftermarketvolume at Pratt & Whitney and higher new equipment volumes inemerging markets for Otis.Cost of Products and Services Sold(DOLLARS IN MILLIONS) <strong>2012</strong> 2011 2010Cost of products sold $ 31,094 $ 29,252 $ 27,513Percentage of product sales 76.3% 75.2% 75.1%Cost of services sold $ 11,059 $ 11,117 $ 10,441Percentage of service sales 65.1% 65.9% 66.7%Total cost of products and services sold $ 42,153 $ 40,369 $ 37,954Percentage change year-over-year 4.4% 6.4% 1.5%The factors contributing to the total percentage changeyear-over-year in total cost of products and services sold are asfollows:<strong>2012</strong> 2011Organic volume – 5%Foreign currency translation (2)% 2%Acquisitions and divestitures, net 6% (1)%Total % Change 4% 6%Total cost of products and services sold increased (4%) ata rate consistent with sales growth (4%) in <strong>2012</strong> as compared with2011. The increase in cost of products and services sold is a resultof the Goodrich and IAE transactions (8%) partially offset by lowercost of products and services sold as a result of the UTC Climate,Controls & Security portfolio transformation (3%) and the beneficialimpact of foreign currency exchange translation (2%).Total cost of products and services sold increased organically(5%) at a rate consistent with organic sales growth (5%) in2011 as compared with 2010. The beneficial impact of cost reductionsand productivity gains were partially offset by higher commodity,pension, and warranty costs in 2011.Gross Margin(DOLLARS IN MILLIONS) <strong>2012</strong> 2011 2010Gross margin $ 15,555 $ 15,385 $ 14,321Percentage of net sales 27.0% 27.6% 27.4%
30 UNITED TECHNOLOGIES CORPORATIONGross margin as a percentage of sales decreased 60 basispoints, in <strong>2012</strong> as compared with 2011, driven primarily by theadverse impact of the Goodrich and IAE transactions (40 basispoints), higher restructuring expense in <strong>2012</strong> (30 basis points), anda loss provision recorded by Sikorsky for a contract with the CanadianGovernment (30 basis points), all of which was partially offsetby benefits from the disposition of lower margin businesses inconnection with the UTC Climate, Controls & Security portfoliotransformation (30 basis points).Gross margin as a percentage of sales increased 20 basispoints, in 2011 as compared with 2010, driven primarily byincreased volumes and lower cost of sales resulting from continuedfocus on cost reductions, savings from previously initiatedrestructuring actions and net operational efficiencies. The beneficialimpacts of the absence of asset impairment charges (10 basispoints) recorded at UTC Climate, Controls & Security and UTCAerospace Systems in 2010 and lower year-over-year restructuringcharges (20 basis points) were partially offset by higher warrantycosts at UTC Aerospace Systems in 2011.Research and Development(DOLLARS IN MILLIONS) <strong>2012</strong> 2011 2010Company-funded $ 2,371 $ 1,951 $ 1,656Percentage of net sales 4.1% 3.5% 3.2%Customer-funded $ 1,670 $ 1,419 $ 1,460Percentage of net sales 2.9% 2.5% 2.8%decrease at Sikorsky (4%) related to a reduction in developmentspending on U.S. Government military platforms. The decrease incustomer-funded research and development in 2011, as comparedwith 2010, was primarily driven by a decrease at Pratt & Whitneyrelated to a reduction in development spending on the Joint StrikeFighter program.Selling, General and Administrative(DOLLARS IN MILLIONS) <strong>2012</strong> 2011 2010Selling, general and administrative $ 6,452 $ 6,161 $ 5,798Percentage of net sales 11.2% 11.1% 11.1%The increase in selling, general and administrativeexpenses in <strong>2012</strong>, as compared with 2011, is due primarily to theimpact of acquisitions, net of divestitures, completed over the precedingtwelve months (3%) and higher restructuring costs (2%).Higher pension costs (1%) were offset by favorable foreignexchange translation.The increase in selling, general and administrativeexpenses in 2011, as compared with 2010, is due primarily to theimpact of acquisitions completed over the year, including theacquisition of the GE Security business in March 2010, adverseforeign exchange translation, and higher pension related costs.Other Income, Net(DOLLARS IN MILLIONS) <strong>2012</strong> 2011 2010Other income, net $ 952 $ 573 $ 31Research and development spending is subject to the variablenature of program development schedules and, therefore, yearover-yearvariations in spending levels are expected. The majority ofthe company-funded spending is incurred by the aerospace businessesand relates largely to the next generation product family atPratt & Whitney, the C-Series, Airbus A350, and Boeing 787 programsat UTC Aerospace Systems, and various programs at Sikorsky.The year-over-year increase in company-funded research anddevelopment in <strong>2012</strong>, compared with 2011, primarily reflectsincreases at UTC Aerospace Systems as a result of incrementalresearch and development spending related to the Goodrich businesses(13%) and at Pratt & Whitney to further advance developmentof multiple geared turbo fan platforms and military engines(5%). The increase in company-funded research and developmentin 2011, compared with 2010, primarily reflects increases at Pratt &Whitney associated with the next generation product family.Company-funded research and development spending for2013 is expected to increase by approximately $225 million over<strong>2012</strong> levels primarily due to the added spending as a result of theGoodrich acquisition.The increase in customer-funded research and developmentin <strong>2012</strong>, as compared with the prior year, reflects spendingrelated to the Goodrich businesses (24%) partially offset by aOther income, net includes the operational impact of equityearnings in unconsolidated entities, royalty income, foreignexchange gains and losses as well as other ongoing and nonrecurringitems. The year-over-year change in other income, net in<strong>2012</strong>, as compared with 2011, largely reflects an approximately$46 million net year-over-year increased gain resulting from UTCClimate, Controls & Security’s ongoing portfolio transformation, a$34 million gain on the fair value re-measurement of the Company’spreviously held shares of Goodrich, a $46 million gain resulting fromthe effective settlement of a pre-existing claim in connection withthe acquisition of Goodrich, an $81 million increase in income fromjoint ventures, as well as the absence of both a $66 million otherthan-temporaryimpairment charge on an equity investment at UTCClimate, Controls & Security, and $45 million of reserves establishedfor legal matters. The remaining increase in other income, netis attributable to net gains recognized on miscellaneous asset salesand normal recurring operational activity as disclosed above.The year-over-year change in other income, net in 2011, ascompared with 2010, largely reflects an approximately $55 millionnet year-over-year increased gain resulting from UTC Climate,Controls & Security’s ongoing portfolio transformation, a $41 milliongain from the sale of an equity investment at Pratt & Whitney, a $73million gain on the contribution of a Sikorsky business into a new
Management’s Discussion and Analysis <strong>2012</strong> ANNUAL REPORT 31venture in the <strong>United</strong> Arab Emirates, a $122 million increase inincome from joint ventures, and $79 million in other, net gains fromdivestitures, all of which was partially offset by a $66 million otherthan-temporaryimpairment charge on an equity investment at UTCClimate, Controls & Security, and $45 million of reserves establishedfor legal matters.Interest Expense, Net(DOLLARS IN MILLIONS) <strong>2012</strong> 2011 2010Interest expense $ 893 $ 673 $ 751Interest income (120) (177) (101)Interest expense, net $ 773 $ 496 $ 650Average interest expense rate during the year on:Short-term borrowings 0.9% 2.0% 1.8%Total debt 4.1% 5.6% 5.6%Interest expense increased in <strong>2012</strong>, as compared with2011, primarily as a result of higher average debt balances in <strong>2012</strong>associated with the financing of our acquisition of Goodrich. Financingfor the Goodrich acquisition included a total of $9.8 billion oflong-term debt, $1.1 billion of equity units which bear contractadjustment payments at a rate of 5.95% per year, and $3.2 billionfrom the issuance of commercial paper. We also entered into aterm loan credit agreement for $2 billion and borrowed the fullamount available under this facility. In connection with the acquisitionof Goodrich, we assumed long term debt of approximately$3.0 billion, which bears interest at rates ranging from 3.6% to7.1%. Subsequent to the acquisition in <strong>2012</strong>, we repaid approximately$635 million of principal ($761 million fair value) of theassumed Goodrich debt, the entire $2.0 billion term loan, andnearly all of the commercial paper issued to finance the acquisition.Interest expense on our long-term debt decreased in 2011as a result of the repayment at maturity in May 2010 of our $600million of 4.375% notes due 2010, the early redemption in June2010 of the entire $500 million outstanding principal amount of our7.125% notes that would have otherwise been due November2010, the early redemption in September 2010 of the entire $500million outstanding principal amount of our 6.350% notes thatwould have otherwise been due March 2011, and as a result of theearly redemption in December 2011 of the entire $500 million outstandingprincipal amount of our 6.100% notes that would otherwisehave been due May 15, <strong>2012</strong>. This impact was partially offsetby the full year impact from the issuance of two series of fixed ratelong-term notes totaling $2.25 billion in February 2010. Lowerinterest charges related to our deferred compensation plan andlower interest accrued on unrecognized tax benefits also contributedto the overall interest expense decline. Interest incomeincreased in 2011, as compared with 2010, as a result of favorablepre-tax interest adjustments of approximately $89 million related tothe settlement of U.S. federal income tax refund claims for yearsprior to 2004, partially offset by the absence of a favorable pre-taxinterest adjustment of approximately $24 million associated with theresolution of an uncertain temporary tax item in the second quarterof 2010.The decline in the weighted-average interest rates forshort-term borrowings was due to the mix of our borrowings with agreater percentage of short-term borrowings at lower interest ratesin <strong>2012</strong> than the percentage of short-term borrowings in 2011. AtDecember 31, <strong>2012</strong> and 2011, we had commercial paper borrowingsoutstanding of $320 million and $455 million, respectively. Thethree month LIBOR rate as of December 31, <strong>2012</strong>, 2011 and 2010was 0.3%, 0.6% and 0.3%, respectively. The decline in the averageinterest rate on total debt is due to the redemptions of higher ratedebt as discussed above and the low interest rates obtained on thedebt issued to fund the Goodrich acquisition.Income Taxes<strong>2012</strong> 2011 2010Effective income tax rate 24.8% 29.0% 27.6%The effective income tax rates for <strong>2012</strong>, 2011 and 2010reflect tax benefits associated with lower tax rates on internationalearnings, which we intend to permanently reinvest outside the<strong>United</strong> States. The <strong>2012</strong> effective tax rate reflects a favorable noncashincome tax adjustment of approximately $203 million related tothe conclusion of the IRS’s examination of the Company’s 2006 –2008 tax years, as well as a reduction in tax expense of $34 millionrelated to the favorable resolution of disputed tax matters with theAppeals division of the IRS for the tax years 2004 and 2005. Alsoincluded in the <strong>2012</strong> effective tax rate is the favorable income taximpact of $225 million related to the release of non-U.S. valuationallowances resulting from internal legal entity reorganizations.The 2011 effective tax rate reflects approximately $63 millionof favorable income tax adjustments related to the settlement oftwo refund claims for years prior to 2004, as well as a favorable taximpact of $17 million related to a U.K. tax rate reduction enacted in2011. These favorable tax adjustments are partially offset by nondeductiblecharges accrued in 2011.The 2010 effective income tax rate reflects a non-recurringtax expense reduction associated with management’s decision torepatriate additional high tax dividends from 2010 earnings to theU.S. as a result of U.S. tax legislation enacted in 2010. This waspartially offset by the non-deductibility of impairment charges, theadverse impact from the health care legislation related to the MedicarePart D program and other increases to UTC’s effective incometax rate.We estimate our full year annual effective income tax rate in2013 to be approximately 29%, absent one-time adjustments. Weanticipate some variability in the tax rate quarter to quarter in 2013.In addition, the Company expects to record a one-time favorabletax adjustment of $80 million in the first quarter of 2013 related to
32 UNITED TECHNOLOGIES CORPORATIONthe legislative corporate tax extenders enacted in January 2013, aspart of the American Taxpayer Relief Act of <strong>2012</strong>. This adjustmentrelates to the <strong>2012</strong> retroactive impact of the new law.For additional discussion of income taxes, see “CriticalAccounting Estimates—Income Taxes” and Note 11 to the ConsolidatedFinancial Statements.Net Income Attributable to Common Shareowners fromContinuing Operations(DOLLARS IN MILLIONS, EXCEPT PER SHARE AMOUNTS) <strong>2012</strong> 2011 2010Net income attributable to commonshareowners from continuing operations $ 4,847 $ 4,831 $ 4,195Diluted earnings per share fromcontinuing operations $ 5.35 $ 5.33 $ 4.55Foreign currency translation, including hedging at Pratt &Whitney Canada (P&WC) generated a net adverse impact of $0.17per diluted share on our operational performance in <strong>2012</strong>. To helpmitigate the volatility of foreign currency exchange rates on ouroperating results, we maintain foreign currency hedging programs,the majority of which are entered into by P&WC. In 2011, foreigncurrency generated a net positive impact on our operational resultsof $0.11 per diluted share, while in 2010 foreign currency had afavorable impact of $0.12 per diluted share. For additional discussionof foreign currency exposure, see “Market Risk and RiskManagement—Foreign Currency Exposures.”Diluted earnings per share from continuing operations for<strong>2012</strong> include a net charge of $0.01 per share from net restructuringand non-recurring items. Besides the restructuring charges of $590million, non-recurring items included approximately $218 million offavorable pre-tax interest and income tax adjustments related to theconclusion of the IRS examination of the 2006 – 2008 tax years,approximately $59 million of favorable pre-tax interest and incometax adjustments related to the resolution of disputes with theAppeals division of the IRS for the 2004 – 2005 tax years, approximately$157 million of net gains resulting from UTC Climate, Controls& Security’s ongoing portfolio transformation, and anapproximately $34 million non-cash gain recognized on the remeasurementto fair value of our previously held shares of Goodrichstock resulting from our acquisition of the company.Net Income Attributable to Common Shareowners fromDiscontinued Operations(DOLLARS IN MILLIONS, EXCEPT PER SHARE AMOUNTS) <strong>2012</strong> 2011 2010Net income attributable to commonshareowners from discontinued operations $ 283 $ 148 $ 178Diluted earnings per share fromdiscontinued operations $ 0.31 $ 0.16 $ 0.19Diluted earnings per share from discontinued operations for<strong>2012</strong> includes $0.82 per share of goodwill and net asset impairmentcharges related to Rocketdyne, Clipper and UTC Power, and$1.01 per share gain on the disposition of the legacy HamiltonSundstrand Industrial businesses. A $0.16 per share benefit fromthe results of operations of discontinued entities was partially offsetby the $0.07 per share Clipper warranty charge.RESTRUCTURING COSTSWe recorded net pre-tax restructuring costs totaling $614 million in<strong>2012</strong> and $336 million in 2011 for new and ongoing restructuringactions. We recorded these charges in the segments as follows:(DOLLARS IN MILLIONS) <strong>2012</strong> 2011Otis $ 164 $ 73UTC Climate, Controls & Security 143 126Pratt & Whitney 96 52UTC Aerospace Systems 115 11Sikorsky 53 53Eliminations and other 19 –Restructuring costs recorded within continuingoperations 590 315Restructuring costs recorded within discontinuedoperations 24 21Total $ 614 $ 336Restructuring charges incurred in <strong>2012</strong> and 2011 were recorded asfollows:(DOLLARS IN MILLIONS) <strong>2012</strong> 2011Cost of sales $ 340 $ 164Selling, general and administrative 249 149Other income, net 1 2Restructuring costs recorded within continuingoperations 590 315Restructuring costs recorded within discontinuedoperations 24 21Total $ 614 $ 336As described below, the <strong>2012</strong> charges relate primarily toactions initiated during <strong>2012</strong> and 2011, while the 2011 chargesrelate primarily to actions initiated during 2011 and 2010. The <strong>2012</strong>restructuring costs reflected in Eliminations and other largely reflectcurtailment charges required under our domestic pension plans dueto the headcount reductions associated with the various restructuringactions.Restructuring actions are an essential component of ouroperating margin improvement efforts and relate to both existingoperations and those recently acquired. We expect to incur additionalrestructuring costs in 2013 of approximately $300 million,including trailing costs related to prior actions, associated with ourcontinuing cost reduction efforts and to the integration of acquisitions.The expected adverse impact on earnings in 2013 fromanticipated additional restructuring costs is expected to be offset bythe beneficial impact from non-recurring items. Although no specificplans for significant actions have been finalized at this time, we
Management’s Discussion and Analysis <strong>2012</strong> ANNUAL REPORT 33continue to closely monitor the economic environment and mayundertake further restructuring actions to keep our cost structurealigned with the demands of the prevailing market conditions.<strong>2012</strong> Actions. During <strong>2012</strong>, we initiated restructuringactions relating to ongoing cost reduction efforts, including workforcereductions and consolidation of manufacturing operations.We recorded net pre-tax restructuring charges totaling $576 millionas follows:(DOLLARS IN MILLIONS) <strong>2012</strong>Otis $ 146UTC Climate, Controls & Security 123Pratt & Whitney 94UTC Aerospace Systems 121Sikorsky 47Eliminations and other 19Restructuring costs recorded within continuing operations 550Restructuring costs recorded within discontinued operations 26Total $ 576The following table summarizes the charges associatedwith the <strong>2012</strong> restructuring actions:(DOLLARS IN MILLIONS) <strong>2012</strong>Cost of sales $ 313Selling, general and administrative 236Other income, net 1Restructuring costs recorded within continuing operations 550Restructuring costs recorded within discontinued operations 26Total $ 576The following table summarizes the charges associatedwith the <strong>2012</strong> restructuring actions by cost type:(DOLLARS IN MILLIONS) <strong>2012</strong>Severance $ 426Asset write-downs 14Facility exit, lease termination and other costs 110Restructuring costs recorded within continuing operations 550Restructuring costs recorded within discontinued operations 26Total $ 576We expect the actions initiated in <strong>2012</strong>, once fully complete,to result in net workforce reductions of approximately 7,000hourly and salaried employees, the exiting of approximately2.6 million net square feet of facilities and the disposal of assetsassociated with the exited facilities. As of December 31, <strong>2012</strong>, withrespect to the actions initiated in <strong>2012</strong>, we have completed networkforce reductions of approximately 4,000 employees, and750,000 net square feet of facilities have been exited. We aretargeting to complete in 2013 the majority of the remaining workforceand facility related cost reduction actions initiated in <strong>2012</strong>.Approximately 80% of the total pre-tax charge will require cashpayments, which we have and expect to continue to fund with cashgenerated from operations. During <strong>2012</strong>, we had cash outflows ofapproximately $199 million related to the <strong>2012</strong> actions. We expectto incur additional restructuring and other charges of $105 million tocomplete these actions. We expect recurring pre-tax savings toincrease over the two-year period subsequent to initiating theactions to approximately $560 million annually, of which, approximately$125 million was realized in <strong>2012</strong>.2011 Actions. During <strong>2012</strong> and 2011, we recorded netpre-tax restructuring charges of $53 million and $286 million,respectively, for actions initiated in 2011. The 2011 actions relate toongoing cost reduction efforts, including workforce reductions andthe consolidation of field operations. We recorded net pre-taxrestructuring charges in <strong>2012</strong> and 2011 as follows:(DOLLARS IN MILLIONS) <strong>2012</strong> 2011Otis $ 19 $ 76UTC Climate, Controls & Security 25 93Pratt & Whitney 3 37UTC Aerospace Systems – 8Sikorsky 5 51Restructuring costs recorded within continuing operations 52 265Restructuring costs recorded within discontinued operations 1 21Total $ 53 $ 286The following table summarizes the charges associatedwith the 2011 restructuring actions:(DOLLARS IN MILLIONS) <strong>2012</strong> 2011Cost of sales $ 33 $ 120Selling, general and administrative 19 142Other income, net – 3Restructuring costs recorded within continuing operations 52 265Restructuring costs recorded within discontinued operations 1 21Total $ 53 $ 286The following table summarizes the <strong>2012</strong> and 2011charges associated with the 2011 restructuring actions by costtype:(DOLLARS IN MILLIONS) <strong>2012</strong> 2011Severance $ 30 $ 242Asset write-downs 1 4Facility exit, lease termination and other costs 21 19Restructuring costs recorded within continuing operations 52 265Restructuring costs recorded within discontinued operations 1 21Total $ 53 $ 286We expect the actions initiated in 2011, once fully completed,to result in net workforce reductions of approximately 4,900
34 UNITED TECHNOLOGIES CORPORATIONhourly and salaried employees, the exiting of approximately 2 millionnet square feet of facilities and the disposal of assets associatedwith the exited facilities. As of December 31, <strong>2012</strong>, we havecompleted, with respect to the actions initiated in 2011, net workforcereductions of approximately 4,200 employees and exited200,000 net square feet of facilities. We are targeting to complete in2013 the majority of the remaining workforce and all facility relatedcost reduction actions initiated in 2011. Approximately 75% of thetotal pre-tax charge will require cash payments, which we have andexpect to continue to fund with cash generated from operations.During <strong>2012</strong>, we had cash outflows of approximately $153 millionrelated to the 2011 actions. We expect to incur additionalrestructuring charges of $29 million to complete these actions. Weexpect recurring pre-tax savings to increase over the two-yearperiod subsequent to initiating the actions to approximately $280million annually.For additional discussion of restructuring, see Note 13 tothe Consolidated Financial Statements.SEGMENT REVIEWNet Sales Operating Profits Operating Profit Margin(DOLLARS IN MILLIONS) <strong>2012</strong> 2011 2010 <strong>2012</strong> 2011 2010 <strong>2012</strong> 2011 2010Otis $ 12,056 $ 12,437 $ 11,579 $ 2,512 $ 2,815 $ 2,575 20.8% 22.6% 22.2%UTC Climate, Controls & Security 17,090 18,864 17,876 2,425 2,212 1,776 14.2% 11.7% 9.9%Pratt & Whitney 13,964 12,711 12,150 1,589 1,867 1,885 11.4% 14.7% 15.5%UTC Aerospace Systems 8,334 4,760 4,399 944 759 654 11.3% 15.9% 14.9%Sikorsky 6,791 7,355 6,684 712 840 716 10.5% 11.4% 10.7%Total segment 58,235 56,127 52,688 8,182 8,493 7,606 14.0% 15.1% 14.4%Eliminations and other (527) (373) (413) (72) (228) (331)General corporate expenses – – – (426) (419) (377)Consolidated $ 57,708 $ 55,754 $ 52,275 $ 7,684 $ 7,846 $ 6,898 13.3% 14.1% 13.2%Commercial BusinessesThe financial performance of our commercial businesses can beinfluenced by a number of external factors including fluctuations inresidential and commercial construction activity, regulatorychanges, interest rates, labor costs, foreign currency exchangerates, customer attrition, raw material and energy costs, creditmarkets and other global and political factors. UTC Climate, Controls& Security’s financial performance can also be influenced byproduction and utilization of transport equipment, and for its residentialbusiness, weather conditions. Geographic and industrydiversity across the commercial businesses help to balance theimpact of such factors on our consolidated operating results,particularly in the face of uneven economic growth. While Otis facedchallenging economic conditions in Europe and lower order rates inChina during the first half of the year, improving market conditionsin China and North America resulted in higher order rates in thesecond half of the year. New equipment orders in China declinedfor the year (3%), but increased during the fourth quarter (19%) ascompared with the fourth quarter of 2011. Organic sales for <strong>2012</strong>within each of our commercial businesses were consistent withprior year levels.In <strong>2012</strong>, 70% of total commercial business sales weregenerated outside the U.S., including U.S. export sales, as comparedto 72% in 2011. The following table shows sales generatedoutside the U.S., including U.S. export sales, for each of thecommercial business segments:<strong>2012</strong> 2011Otis 82% 83%UTC Climate, Controls & Security 62% 65%
Management’s Discussion and Analysis <strong>2012</strong> ANNUAL REPORT 35Otis is the world’s largest elevator and escalator manufacturing,installation and service company. Otis designs, manufactures, sellsand installs a wide range of passenger and freight elevators forlow-, medium- and high-speed applications, as well as a broad lineof escalators and moving walkways. In addition to new equipment,Otis provides modernization products to upgrade elevators andescalators as well as maintenance and repair services for both itsproducts and those of other manufacturers. Otis serves customersin the commercial and residential property industries around theworld. Otis sells directly to the end customer and through salesrepresentatives and distributors.Total Increase (Decrease) Year-Over-Year for:(DOLLARS IN MILLIONS) <strong>2012</strong> 2011 2010 <strong>2012</strong> Compared with 2011 2011 Compared with 2010Net Sales $ 12,056 $ 12,437 $ 11,579 $ (381) (3)% $ 858 7%Cost of Sales 8,008 8,090 7,540 (82) (1)% 550 7%4,048 4,347 4,039Operating Expenses and Other 1,536 1,532 1,464Operating Profits $ 2,512 $ 2,815 $ 2,575 $ (303) (11)% $ 240 9%Factors Contributing to Total % Increase (Decrease) Year-Over-Year in:<strong>2012</strong> 2011Net Sales Cost of SalesOperatingProfits Net Sales Cost of SalesOperatingProfitsOrganic / Operational – 1% (3)% 2% 2% 2%Foreign currency translation (3)% (3)% (4)% 4% 4% 5%Acquisitions and divestitures, net – – – 1% 1% –Restructuring costs – 1 % (4)% – – –Other – – – – – 2%Total % change (3)% (1)% (11)% 7% 7% 9%<strong>2012</strong> Compared with 2011There was no organic sales growth in <strong>2012</strong> as higher service saleswere offset by lower new equipment sales. Higher service sales inAsia and the Americas (2%) were offset by declines in Europe (1%).Lower new equipment volume (1%) primarily in China and Europewas partially offset by a slight increase in the Americas and Russia.The operational profit decline for the year (3%) is due tolower new equipment contribution driven by lower volume and pricingpressures (4%), lower service contribution (1%) resulting fromcontinued pricing pressure primarily in Europe, and the impact ofhigher commodity costs (1%). Partially offsetting these factors werebenefits derived from ongoing cost reduction initiatives (3%).2011 Compared with 2010The organic sales increase (2%) in the year was due to higher newequipment sales volume in China, Russia and Brazil (combined 3%),partially offset by declines in North America (1%). Increased contractualmaintenance and repair volume across all regions was offsetby a decline in modernization volume in Europe. Newequipment orders improved 15% versus the prior year, led bystrong order growth in China. Selling prices remained underpressure.The operational profit improvement (2%) in the period wasdue to higher new equipment volume, increases in contractualmaintenance and repair services, and the benefits of ongoing costreduction initiatives, partially offset by lower pricing, the impact ofhigher commodity costs, and lower modernization volume inEurope.UTC Climate, Controls & Security As described above, on September28, 2011, we announced a new organizational structurethat allows us to better serve customers through greater integrationacross product lines. As part of this new structure, effective January1, <strong>2012</strong>, we formed the UTC Climate, Controls & Securitysegment, which is composed of the former Carrier and UTC Fire &Security segments. UTC Climate, Controls & Security is the leadingprovider of HVAC and refrigeration solutions, including controls forresidential, commercial, industrial and transportation applications.These products and services are sold under the Carrier name andother brand names to building contractors and owners, homeowners,transportation companies, retail stores and food servicecompanies. UTC Climate, Controls & Security is also a global providerof security and fire safety products and services. UTC Climate,Controls & Security provides electronic security products such asintruder alarms, access control systems and video surveillancesystems and designs and manufactures a wide range of fire safetyproducts including specialty hazard detection and fixed suppressionproducts, portable fire extinguishers, fire detection and lifesafety systems, and other firefighting equipment. Services providedto the electronic security and fire safety industries include systemsintegration, video surveillance, installation, maintenance, andinspection. In certain markets, UTC Climate, Controls & Security
36 UNITED TECHNOLOGIES CORPORATIONalso provides monitoring, response and security personnel services,including cash-in-transit security, to complement its electronicsecurity and fire safety businesses. Through its venture with Watsco,Inc., UTC Climate, Controls & Security distributes Carrier, Bryant,Payne and Totaline residential and light commercial HVACproducts in the U.S. and selected territories in the Caribbean andLatin America. UTC Climate, Controls & Security sells directly toend customers and through manufacturers’ representatives,distributors, wholesalers, dealers and retail outlets. Certain of UTCClimate, Controls & Security’s HVAC businesses are seasonal andcan be impacted by weather. UTC Climate, Controls & Securitycustomarily offers its customers incentives to purchase products toensure an adequate supply of its products in the distribution channels.The principal incentive program provides reimbursements todistributors for offering promotional pricing on UTC Climate, Controls& Security products. We account for incentive payments madeas a reduction to sales. UTC Climate, Controls & Security productsand services are used by governments, financial institutions, architects,building owners and developers, security and fire consultants,homeowners and other end-users requiring a high level ofsecurity and fire protection for their businesses and residences.UTC Climate, Controls & Security provides its security and firesafety products and services under Chubb, Kidde and other brandnames and sells directly to customers as well as through manufacturerrepresentatives, distributors, dealers and U.S. retaildistribution.Total Increase (Decrease) Year-Over-Year for:(DOLLARS IN MILLIONS) <strong>2012</strong> 2011 2010 <strong>2012</strong> Compared with 2011 2011 Compared with 2010Net Sales $ 17,090 $ 18,864 $ 17,876 $ (1,774) (9)% $ 988 6%Cost of Sales 12,316 13,848 13,158 (1,532) (11)% 690 5%4,774 5,016 4,718Operating Expenses and Other 2,349 2,804 2,942Operating Profits $ 2,425 $ 2,212 $ 1,776 $ 213 10 % $ 436 25%Factors Contributing to Total % Increase (Decrease) Year-Over-Year in:<strong>2012</strong> 2011Net Sales Cost of SalesOperatingProfits Net Sales Cost of SalesOperatingProfitsOrganic / Operational – – 10 % 7% 8% 13%Foreign currency translation (2)% (3)% (2)% 3% 3% 3%Acquisitions and divestitures, net (7)% (8)% – (4)% (5)% (2)%Restructuring costs – – (1)% – – 2%Other – – 3 % – (1)% 9 %Total % change (9)% (11)% 10 % 6% 5% 25%<strong>2012</strong> Compared with 2011There was no organic sales growth during <strong>2012</strong> as lower volumesin the transport refrigeration business (1%) were offset by growth inthe Americas (1%) attributable to the residential and commercialHVAC businesses. The decrease in “Acquisitions and divestitures,net” (7%) reflects the year-over-year impact of divestitures completedin the preceding twelve months associated with UTC Climate,Controls & Security’s ongoing portfolio transformation.The 10% operational profit increase was driven largely bythe benefits of net cost productivity and restructuring actions(combined 3%) including savings from the consolidation of legacyCarrier and UTC Fire & Security, favorable commodity costs (2%),and higher equity income from joint venture partners (2%). Also,operational profit included the benefit of a special cash dividend(1%) received from an interest in a distribution partner. The 3%increase in “Other” primarily reflects an approximately $46 millionnet year-over-year gain from UTC Climate, Controls & Security’songoing portfolio transformation and the absence of a $66 millionother-than-temporary impairment charge recorded on an Asianequity investment in the prior year. This was partially offset by theabsence of an approximately $25 million favorable litigation resolutionand gain on the disposition of the U.K. Security business,both recorded in 2011. The year-over-year net portfolio transformationgain primarily includes approximately $120 million fromthe sale of a controlling interest in a Canadian distribution business,including a $24 million pension settlement charge, combined withan approximately $215 million net gain from the sale of a controllinginterest in a manufacturing and distribution joint venture in Asia.These gains were partially offset by a $32 million loss on the dispositionof the U.S. Fire & Security branch operations, $142 millionof impairment charges recorded in <strong>2012</strong> related to ongoing businessdispositions, and the absence of an approximately $80 millionprior year gain resulting primarily from the contribution of legacyCarrier’s HVAC operations in Brazil, Argentina and Chile into a newventure controlled by Midea Group of China.
Management’s Discussion and Analysis <strong>2012</strong> ANNUAL REPORT 372011 Compared with 2010Organic sales growth was 7%, with the recovery in the transportrefrigeration market partially offset by declines in the U.K. and U.S.service businesses. The 4% decrease in “Acquisitions and divestitures,net” primarily reflects the net impact from acquisitions andthe business transformation actions completed in the precedingtwelve months as part of UTC Climate, Controls & Security’songoing portfolio transformation initiative.The operational profit improvement of 13% was driven bystrong conversion on organic sales growth (7%), particularly in thehigher margin transport refrigeration business, lower bad debtexpense, and earnings improvement in a joint venture in Japan(2%). This was partially offset by lower margins and unfavorablesales mix primarily within the fire protection products business inthe U.K. and higher net commodity costs (6%). The 9% increase in“Other” primarily reflects the year-over-year impact of net gainsassociated with UTC Climate, Control & Security’s ongoing portfoliotransformation. This includes an approximately $80 million gainrecorded in 2011 as a result of the contribution of legacy Carrier’sHVAC operations in Brazil, Argentina, and Chile into a new venturecontrolled by Midea Group of China. Also included in “Other” is thefavorable resolution of litigation and gains on the dispositions ofU.K. security businesses and the absence of an asset impairmentcharge in 2010 of approximately $58 million, all of which was partiallyoffset by a $66 million other-than-temporary impairment chargerecorded on an equity investment in Asia in 2011.Aerospace BusinessesThe financial performance of Pratt & Whitney, UTC AerospaceSystems and Sikorsky is directly tied to the economic conditions ofthe commercial aerospace and defense aerospace industries. Inparticular, Pratt & Whitney experiences intense competition for newcommercial airframe/engine combinations. Engine suppliers mayoffer substantial discounts and other financial incentives, performanceand operating cost guarantees, participation in financingarrangements and maintenance agreements. At times, the aerospacebusinesses also enter into development programs and firmfixed-price development contracts, which may require the companyto bear cost overruns related to unforeseen technical and designchallenges that arise during the development stage of the program.Customer selections of engines and components can also have asignificant impact on later sales of parts and service. Predicted trafficlevels, load factors, worldwide airline profits, general economicactivity and global defense spending have been reliable indicatorsfor new aircraft and aftermarket orders within the aerospaceindustry. Spare part sales and aftermarket service trends areaffected by many factors, including usage, technological improvements,pricing, regulatory changes and the retirement of older aircraft.Performance in the general aviation sector is closely tied tothe overall health of the economy and is positively correlated tocorporate profits.Our long-term aerospace contracts are subject to strictsafety and performance regulations which can affect our ability toestimate costs precisely. Contract cost estimation for the developmentof complex projects, in particular, requires management tomake significant judgments and assumptions regarding the complexityof the work to be performed, availability of materials, theperformance by subcontractors, the timing of funding fromcustomers and the length of time to complete the contract. As aresult, we review and update our cost estimates on significant contractson a quarterly basis, and no less frequently than annually forall others, or when circumstances change and warrant a modificationto a previous estimate. Changes in estimates relate to thecurrent period impact of revisions to total estimated contract salesand costs at completion. We record changes in contract estimatesusing the cumulative catch-up method in accordance with theRevenue Recognition Topic of the FASB Accounting StandardsCodification (“ASC”). The net decrease in operating profits as aresult of significant changes in aerospace contract estimates was$19 million in <strong>2012</strong>, including the revision in estimate on the SikorskyCH-148 contract discussed further below. The adverse impactof this contract adjustment was partially offset by several positivecontract adjustments recorded throughout the year largely at thePratt & Whitney segment. The impact of these adjustments was notconsidered significant to either the sales or operating profits of thesegment in the quarter in which they were recorded other than theimpact of a contract termination which was disclosed in the Pratt &Whitney segment results in the first quarter of <strong>2012</strong>.The commercial airline industry remained strong throughout<strong>2012</strong>. Airline traffic growth rates, as measured by revenue passengermiles (RPMs), stabilized during <strong>2012</strong> and 2011 afterrebounding in 2010. RPMs grew 5.5% in <strong>2012</strong>, as compared with2011, and we expect RPMs will continue to grow between 4% and6% in 2013. We made significant investment in engineering anddevelopment in <strong>2012</strong> and expect continued investment in 2013,primarily at Pratt & Whitney as we continue to develop five separategeared turbofan platforms to meet demand for new engines whichare fuel efficient and have reduced noise levels and exhaust emissions.Although airlines have generally returned to profitability, highfuel prices continue to challenge the airlines to consider the needfor more fuel efficient aircraft.Deficit reduction measures considered by the U.S. Governmentare expected to pressure the U.S. Department of Defensebudget in the coming years, resulting in a decline in U.S. Departmentof Defense spending. Total sales to the U.S. Government of$10.1 billion in <strong>2012</strong>, $9.1 billion in 2011, and $9.1 billion in 2010were 18%, 16% and 17% of total UTC sales in <strong>2012</strong>, 2011 and2010, respectively. The defense portion of our aerospace businessis affected by changes in market demand and the global politicalenvironment. Our participation in long-term production anddevelopment programs for the U.S. Government has contributedpositively to our results in <strong>2012</strong> and is expected to continue tobenefit results in 2013.
38 UNITED TECHNOLOGIES CORPORATIONSikorsky continued to benefit from military spending, withapproximately 86% of Sikorsky’s <strong>2012</strong> helicopter deliveries basedon military platforms. In July <strong>2012</strong>, the U.S. Government and Sikorskysigned a five-year multiservice contract for approximately 650H-60 helicopters. Actual production quantities will be determinedyear-by-year over the life of the program based on funding allocationsset by Congressional and Pentagon acquisition priorities.Commercial helicopter aftermarket sales volumes were consistentwith the prior year on strong demand for the S-92 helicopter whichwas offset by lower volumes of the S-76 helicopter as Sikorskytransitions to the new S-76D helicopter.As previously reported, Sikorsky is developing the CH-148derivative of the H-92 helicopter (the “Cyclone”), a military variant ofthe S-92 helicopter, for the Canadian Government. The Cyclone isbeing developed under a fixed-price contract that provides for thedevelopment and production of 28 helicopters (the “AcquisitionContract”), and a related In Service Support contract (the “ISSContract”) through March 2028 (collectively, the “Arrangements”).The current contract values of the Arrangements are estimated tobe $4.3 billion. Revenues are subject to changes in underlyingvariables such as the timing of deliveries, future flight hours andfluctuations in foreign currency exchange rates.As previously disclosed, in June 2010 Sikorsky and theCanadian Government signed contract amendments that revisedthe delivery schedule and contract specifications, while also establishingrequirements that enabled initial operational test and evaluationactivities for the first six interim aircraft. The amendments alsoincluded modifications to the liquidated damages schedule,readjustment of payment schedules, resolution of open disputesand other program related enhancements.In accordance with our revenue recognition policy, losses,if any, on long-term contracts are provided for when anticipated.Loss provisions on original equipment contracts are recognized tothe extent that estimated inventoriable manufacturing, engineering,product warranty and product performance guarantee costs, asappropriate, exceed the projected revenue from the products contemplatedunder the contractual arrangement. In 2011, Sikorskycompleted a significant contractual milestone for work on fourinterim configuration helicopters and recognized the revenues andrelated costs. Although the Arrangements were expected to beprofitable on a combined basis in 2011, $56 million of losses wererecorded upon completing the milestones for the four aircraft as theactual costs exceeded revenues. These interim configuration aircraftwill require further software and hardware upgrades before fullmission capability can be achieved.Delivery of the final configuration aircraft, which was scheduledto begin in <strong>2012</strong>, did not occur due to a number of disputesbetween the Canadian Government and Sikorsky that arose duringthe course of <strong>2012</strong> related to contractual requirements and contractperformance. These included issues related to excusabledelays, development, production, logistical support and delays inthe delivery of final configuration aircraft. The parties have beenunable to resolve these disputes and are engaged in the disputeresolution process.As a result of these matters, Sikorsky recorded a loss provisionof $157 million during the fourth quarter of <strong>2012</strong> as the estimatedprofits on the ISS Contract no longer exceeded theestimated remaining losses on the Acquisition Contract. The profiterosion was driven by an increase in total expected costs to beincurred primarily as a result of the delays in delivering the final configurationaircraft, and a reduction of expected flight hour revenueson the ISS Contract. Since the Acquisition Contract’s costs exceedits revenues on a stand-alone basis, we expect to record a $14 millionloss upon the contractual delivery of each aircraft in the future.Sikorsky is prepared to deliver additional aircraft in a configurationthat would allow for the commencement of certain contractuallyrequired activities such as pilot training, customer testing,and limited mission capability. These aircraft would require theincorporation of additional hardware and software upgrades beforefull mission capability can be achieved and final configuration aircraftsubsequently delivered. Sikorsky continues discussions withthe Canadian Government in an effort to resolve the open disputesincluding the establishment of a potential arrangement that allowsfor the delivery of interim configuration aircraft. However, if theseefforts are unsuccessful and the Canadian Government requires thedelivery of only final configuration aircraft under current contractualrequirements, no deliveries are expected to occur until 2015 at theearliest.While Sikorsky is committed to the program, the currentdisputes and unresolved contract status, coupled with the remainingdevelopment issues and long-term nature of this program, providesubstantial uncertainty and risk in regards to the futureprofitability of the overall program. While the loss provisionsrecorded to date reflect management’s best estimate of the projectedcosts to complete the development and manufacture of thefinal configuration aircraft, there is still significant effort required tocomplete the development of the mission system capability as wellas complete the manufacturing, testing and retrofit activities. Futurevariability in internal cost targets related to the aircraft may becaused by increases in holding costs, retrofit estimates, subcontractorperformance and changes in liquidated damages. Withrespect to the multi-year ISS Contract, the future profitability isdependent upon a number of factors including aircraft flight hours,deployed aircraft availability, aircraft performance, availability oftrained pilots and government budgetary pressures. The inability toachieve a satisfactory contractual solution, further unplanneddelays, additional developmental cost growth or variations in any ofthe estimates used in the existing contract analysis could lead tofurther loss provisions on the Arrangements. Additional losses couldhave a material adverse impact on the consolidated results of operationsin the period in which the loss may be recognized.
Management’s Discussion and Analysis <strong>2012</strong> ANNUAL REPORT 39Effective July 1, <strong>2012</strong>, the auxiliary power unit business(APU) of the UTC Aerospace Systems business segment was transferredto the Pratt & Whitney business segment. The APU businessdesigns and manufactures a variety of products for commercial andmilitary aircraft. <strong>Annual</strong> sales for the APU business are approximately$600 million. The reclassification has been made prospectively;prior year results have not been restated for the transferof the business.Pratt & Whitney is among the world’s leading suppliers of aircraftengines for the commercial, military, business jet and general aviationmarkets. Pratt & Whitney Commercial Engines provides maintenance,repair and overhaul services, including the sale of spareparts, as well as fleet management services for large commercialengines. Pratt & Whitney produces families of engines for wide- andnarrow-body and large regional aircraft in the commercial marketand for fighter and transport aircraft in the military market. P&WC isa world leader in the production of engines powering business,regional, light jet, utility and military airplanes and helicopters andprovides related maintenance, repair and overhaul services, includingthe sale of spare parts, as well as fleet management services.Pratt & Whitney’s products are sold principally to aircraft manufacturers,airlines and other aircraft operators, aircraft leasingcompanies, space launch vehicle providers and the U.S. and foreigngovernments. Pratt & Whitney’s products and services mustadhere to strict regulatory and market-driven safety and performancestandards. The frequently changing nature of these standards,along with the long duration of aircraft engine development, productionand support programs, creates uncertainty regardingengine program profitability. The vast majority of sales are madedirectly to the end customer and, to a limited extent, throughindependent distributors and foreign sales representatives.Pratt & Whitney is currently developing technology, includingthe PurePower PW1000G Geared TurboFan engine, intended toenable it to power both currently-proposed and future aircraft. ThePurePower PW1000G engine targets a significant reduction in fuelburn and noise levels with lower environmental emissions andoperating costs than current production engines. In December2010, Airbus announced that it will offer a version of the PurePowerPW1000G engine as a new engine option to power its A320neofamily of aircraft scheduled to enter into service in 2015. InNovember <strong>2012</strong>, Pratt & Whitney commenced testing on this newengine, the PW1100G-JM, being developed as part of a collaborationwith MTU and JAEC. Additionally, PurePower PW1000Gengine models have been selected by Bombardier to power thenew CSeries passenger aircraft, by Mitsubishi Aircraft Corporationto power the new Mitsubishi Regional Jet, and by Irkut Corporationof Russia to power the proposed new Irkut MC-21 passenger aircraft.These aircraft are scheduled to enter into service in 2013,2015 and 2017, respectively. Further, on January 8, 2013, Embraerannounced the selection of the PurePower engine to exclusivelypower the next generation of Embraer’s E-Jet family of aircraftscheduled to enter service in 2018. The success of these aircraftand the PurePower PW1000G family of engines is dependent uponmany factors including technological challenges, aircraft demand,and regulatory approval. Based on these factors, as well as thelevel of success of aircraft program launches by aircraft manufacturersand other conditions, additional investment in the Pure-Power program may be required. P&WC has developed or isdeveloping the PW210 engine family for helicopters manufacturedby Sikorsky, AgustaWestland and The Eurocopter Group and isdeveloping the PurePower PW800 engine for the new generation oflong-range and heavy business jets. Pratt & Whitney continues toenhance its programs through performance improvement measuresand product base expansion.In view of the risks and costs associated with developingnew engines, Pratt & Whitney has entered into collaborationarrangements in which sales, costs and risks are shared. AtDecember 31, <strong>2012</strong>, the interests of third party participants inPratt & Whitney-directed commercial jet engine programs rangedfrom 14 percent to 48 percent. In addition, Pratt & Whitney hasinterests in other engine programs, including a 50 percent ownershipinterest in the Engine Alliance (EA), a joint venture with GEAviation, which markets and manufactures the GP7000 engine forthe Airbus A380 aircraft. Pratt & Whitney has entered into risk andrevenue sharing arrangements with third parties for 40 percent ofthe products and services that Pratt & Whitney is responsible forproviding to the EA. Pratt & Whitney accounts for its interests in theEA joint venture under the equity method of accounting. Pratt &Whitney continues to pursue additional collaborators.On June 29, <strong>2012</strong>, Pratt & Whitney, Rolls-Royce, MTU andJAEC, participants in the IAE collaboration, completed a restructuringof their interests in IAE. Pratt & Whitney now has a 61% netinterest in the collaboration and a 49.5% ownership interest in IAE.See the Business Overview section of Management’s Discussionand Analysis for further information on the IAE transaction.
40 UNITED TECHNOLOGIES CORPORATIONTotal Increase (Decrease) Year-Over-Year for:(DOLLARS IN MILLIONS) <strong>2012</strong> 2011 2010 <strong>2012</strong> Compared with 2011 2011 Compared with 2010Net Sales $ 13,964 $ 12,711 $ 12,150 $ 1,253 10 % $ 561 5 %Cost of Sales 10,600 9,282 9,011 1,318 14 % 271 3 %3,364 3,429 3,139Operating Expenses and Other 1,775 1,562 1,254Operating Profits $ 1,589 $ 1,867 $ 1,885 $ (278) (15)% $ (18) (1)%Factors Contributing to Total % Increase (Decrease) Year-Over-Year in:<strong>2012</strong> 2011Net Sales Cost of SalesOperatingProfits Net Sales Cost of SalesOperatingProfitsOrganic* / Operational* 2 % 5 % (16)% 6 % 3% (3)%Foreign currency (including P&WC net hedging)* (1)% – (3)% (1)% – (2)%Acquisitions and divestitures, net 9% 9% 6% – – –Restructuring costs – – (2)% – – 2%Other – – – – – 2%Total % change 10 % 14 % (15)% 5 % 3% (1)%* As discussed further in the “Business Overview” and “Results of Operations” sections, for Pratt & Whitney only, the transactional impact of foreign exchange hedging at P&WChas been netted against the translational foreign exchange impact for presentation purposes in the above table. For all other segments, these foreign exchange transactionalimpacts are included within the organic sales/operational operating profit caption in their respective tables. Due to its significance to Pratt & Whitney’s overall operating results,we believe it is useful to segregate the foreign exchange transactional impact in order to clearly identify the underlying financial performance.<strong>2012</strong> Compared with 2011Organic sales growth (2%) was driven by higher military engine deliveriesand aftermarket sales (5%), higher P&WC engine and sparesvolume (1%), and higher industrial volume at Pratt & Whitney PowerSystems (1%), offset by a decrease in commercial aftermarket (6%).Sales increased (9%) as a result of the consolidation of IAE and thetransfer of the APU business to Pratt & Whitney from UTC AerospaceSystems.The operational profit decrease (16%) was primarily drivenby lower profit on commercial aftermarket (17%), higher researchand development (8%), partially offset by favorable P&WC enginevolume and delivery mix (3%), higher military engine and sparesvolume (3%) and an increase in contract settlements and close outs(3%). Operating profit increased due to net acquisitions(6%) primarily as a result of the consolidation of IAE.2011 Compared with 2010Organic sales growth (6%) was driven by growth in the largecommercial engine business (5%), higher spares volume across thebusiness (combined 2%), and higher industrial volume at Pratt &Whitney Power Systems (1%). These increases were partially offsetby lower military engine sales.The operational profit decline (3%) primarily reflects higheryear-over-year research and development costs (14%), unfavorablecommercial engine business mix and fewer military engine businessdeliveries (combined 7%), partially offset by higher commercialspares and aftermarket volume (14%). Additionally, gains recordedon contract settlements and contract close-outs were offset, inpart, by losses incurred as a result of increased airline industryexposures during the year (combined 4%). The 2% contributed by“Other” primarily reflects the gain on a sale of an equity investment.UTC Aerospace Systems On July 26, <strong>2012</strong>, UTC acquired Goodrich,pursuant to a merger agreement dated September 21, 2011.As a result of the acquisition, Goodrich became a wholly-ownedsubsidiary of UTC. The acquired Goodrich business and the formerHamilton Sundstrand segment have been combined to form thenew UTC Aerospace Systems segment. UTC Aerospace Systems isamong the world’s leading suppliers of technologically advancedaerospace products and aftermarket services for diversifiedindustries worldwide. UTC Aerospace Systems’ aerospace productsinclude electric power generation, management and distributionsystems, flight control systems, engine control systems,intelligence, surveillance and reconnaissance systems, enginecomponents, environmental control systems, fire protection anddetection systems, propeller systems, aircraft nacelles, and interior,actuation, landing and electronic systems. UTC Aerospace Systemsproducts serve commercial, military, regional, business and generalaviation, as well as military ground vehicle, space and underseaapplications. Aftermarket services include spare parts, overhaul andrepair, engineering and technical support and fleet maintenanceprograms. UTC Aerospace Systems sells aerospace products toairframe manufacturers, the U.S. and foreign governments, aircraftoperators, maintenance, repair and overhaul providers, andindependent distributors.
Management’s Discussion and Analysis <strong>2012</strong> ANNUAL REPORT 41Total Increase (Decrease) Year-Over-Year for:(DOLLARS IN MILLIONS) <strong>2012</strong> 2011 2010 <strong>2012</strong> Compared with 2011 2011 Compared with 2010Net Sales $ 8,334 $ 4,760 $ 4,399 $ 3,574 75% $ 361 8%Cost of Sales 6,090 3,403 3,112 2,687 79% 291 9%2,244 1,357 1,287Operating Expenses and Other 1,300 598 633Operating Profits $ 944 $ 759 $ 654 $ 185 24% $ 105 16%Net SalesFactors Contributing to Total % Increase (Decrease) Year-Over-Year in:<strong>2012</strong> 2011Cost of SalesOperatingProfits Net Sales Cost of SalesOperatingProfitsOrganic / Operational 7% 6% 6% 8 % 10 % 8 %Foreign currency translation (1)% (1)% (1)% 1% 1% 2%Acquisitions and divestitures, net 69 % 73 % 33 % (1)% (1)% (1)%Restructuring costs – 1 % (14)% – – 2%Other – – – – (1)% 5 %Total % change 75 % 79 % 24 % 8% 9% 16%<strong>2012</strong> Compared with 2011The organic sales growth (7%) reflects higher commercial aerospaceOEM (4%), military aerospace OEM (2%), and aftermarket(1%) volume.The organic increase in operational profit (6%) primarilyreflects the benefit of profit contribution on higher sales (11%) andlower warranty costs (5%) partially offset by higher engineering anddevelopment (4%) and pension costs (6%). “Acquisitions anddivestitures, net” is principally a result of the acquisition of Goodrich.2011 Compared with 2010The organic sales growth (8%), primarily reflects higher aftermarket(6%) and OEM (2%) volumes. The organic cost of sales growth(10%) exceeded the organic sales growth due largely to an adversemix within aerospace OEM and higher warranty costs.The increase in operational profit (8%) reflects an increasein aftermarket volume, partially offset by adverse mix within OEM,including a reduction in military ground vehicle volumes and anincrease in volume of lower margin commercial programs (8%).Also, operational profit growth reflects the benefit of lower researchand development costs (5%), offset by higher warranty costs (6%).The increase contributed by “Other” primarily reflects the absenceof approximately $28 million of asset impairment charges recordedin the second quarter of 2010. These charges related primarily tothe disposition of an aerospace business as part of UTC AerospaceSystem’s efforts to implement low cost sourcing initiatives.Sikorsky is one of the world’s largest helicopter companies. Sikorskymanufactures military and commercial helicopters and alsoprovides aftermarket helicopter and aircraft parts and services.Current major production programs at Sikorsky include the UH-60M Black Hawk medium-transport helicopters and HH-60MMedevac helicopters for the U.S. and foreign governments, theS-70 Black Hawk for foreign governments, the MH-60S and MH-60R helicopters for the U.S. Navy, the International Naval Hawk formultiple naval missions, and the S-76 and S-92 helicopters forcommercial operations. The UH-60M helicopter is the latest andmost modern in a series of Black Hawk variants that Sikorsky hasbeen delivering to the U.S. Army since 1978. In July <strong>2012</strong>, the U.S.Government and Sikorsky signed a five-year multi-service contractfor approximately 650 H-60 helicopters. Actual production quantitieswill be determined year-by-year over the life of the programbased on funding allocations set by Congress and the U.S.Department of Defense acquisition priorities, as well as the level ofForeign Military Sales. Sikorsky is also developing the CH-53K nextgeneration heavy lift helicopter for the U.S. Marine Corps and theCH-148 derivative of the H-92 helicopter, a military variant of theS-92 helicopter, for the Canadian Government. See the AerospaceBusiness section of Management’s Discussion and Analysis, above,for further discussion of Sikorsky’s contract with the CanadianGovernment.Sikorsky’s aftermarket business includes spare parts sales,mission equipment, overhaul and repair services, maintenancecontracts and logistics support programs for helicopters and otheraircraft. Sales are principally made to the U.S. and foreign governments,and commercial helicopter operators. Sikorsky is increasinglyengaging in logistics support programs and partnering with itsgovernment and commercial customers to manage and providelogistics, maintenance and repair services.
42 UNITED TECHNOLOGIES CORPORATIONTotal Increase (Decrease) Year-Over-Year for:(DOLLARS IN MILLIONS) <strong>2012</strong> 2011 2010 <strong>2012</strong> Compared with 2011 2011 Compared with 2010Net Sales $ 6,791 $ 7,355 $ 6,684 $ (564) (8)% $ 671 10%Cost of Sales 5,643 6,120 5,539 (477) (8)% 581 10%1,148 1,235 1,145Operating Expenses and Other 436 395 429Operating Profits $ 712 $ 840 $ 716 $ (128) (15)% $ 124 17%Factors Contributing to Total % Increase (Decrease) Year-Over-Year in:<strong>2012</strong> 2011Net Sales Cost of SalesOperatingProfits Net Sales Cost of SalesOperatingProfitsOrganic / Operational (8)% (8)% (7)% 10% 10% 12 %Restructuring costs – – – – – (5)%Other – – (8)% – – 10 %Total % change (8)% (8)% (15)% 10% 10% 17 %<strong>2012</strong> Compared with 2011The organic sales decrease (8%) reflects reduced aircraft deliveriesand completions from foreign military operations (6%) across variousprograms including four fewer CH-148 aircraft for the Canadian Government,reduced U.S. Government sales (2%) and lower volume fromcustomer funded development programs (2%). These decreases werepartially offset by increased commercial aircraft volume (2%) dueprimarily to increased S-92 sales, which were partially offset by lowerS-76 sales as Sikorsky transitions to the new S-76D model.The operational profit decrease (7%) is a result of lowersales to the U.S. Government (12%), higher engineering anddevelopment costs (1%) and lower profits from foreign military operations(8%) due in large part to the previously noted $157 million lossprovision for the CH-148 contract with the Canadian Government,partially offset by favorable aircraft mix within the foreign militaryoperations business. These decreases were partially offset by anincrease in commercial profits (10%) due primarily to strong S-92volume and profitability, and increased aftermarket support (5%) dueprimarily to increased U.S. Government spares sales, favorable contractperformance and savings from restructuring initiatives. The 8%decrease in “Other” primarily reflects the absence of a gain recognizedon the contribution of a business to a venture in the <strong>United</strong>Arab Emirates in 2011.2011 Compared with 2010The increase in organic sales (10%) was primarily attributable tohigher military aircraft sales including higher international developmentaircraft sales and favorable military aircraft configuration mix(8% combined), which more than offset a decrease from commercialoperations (2%) due to fewer aircraft deliveries. Net sales fromaftermarket support increased (4%) primarily driven by higherspares volume.The operational profit improvement (12%) was primarilyattributable to an increase in aftermarket support (10%) driven byhigher spares volume. Operating profits in the military businessincreased as higher aircraft deliveries and favorable aircraft configurationmix more than offset the adverse impact of losses associatedwith higher than expected development costs on international militarydevelopment aircraft sales (2% combined). The remainder of theoperational profit increase was primarily driven by lower manufacturingcosts, higher volume on customer funded development andlower research and development costs, which more than offset theimpact of fewer aircraft deliveries from commercial operations. The10% increase contributed by “Other” reflects the gain recognized oncontribution of a business to a venture in the <strong>United</strong> Arab Emirates.Eliminations and otherEliminations and other reflects the elimination of sales, other incomeand operating profit transacted between segments, as well as theoperating results of certain smaller businesses. We have previouslyreported the results of UTC Power and Clipper within eliminations andother but have reclassified the results of these businesses to discontinuedoperations for all periods presented. The change in sales in<strong>2012</strong>, as compared with 2011, reflects an increase in the amount ofinter-segment sales eliminations due to our acquisition of Goodrich.The change in the operating profit elimination in <strong>2012</strong>, as comparedwith 2011, primarily reflects the benefit of lower insurance and legalcosts and gains on corporate-held investments.LIQUIDITY AND FINANCIAL CONDITION(DOLLARS IN MILLIONS) <strong>2012</strong> 2011Cash and cash equivalents $ 4,819 $ 5,960Total debt 23,221 10,260Net debt (total debt less cash and cash equivalents) 18,402 4,300Total equity 27,069 22,820Total capitalization (total debt plus total equity) 50,290 33,080Net capitalization (total debt plus total equity lesscash and cash equivalents) 45,471 27,120Total debt to total capitalization 46% 31%Net debt to net capitalization 40% 16%
Management’s Discussion and Analysis <strong>2012</strong> ANNUAL REPORT 43We assess our liquidity in terms of our ability to generate cash tofund our operating, investing and financing activities. Our principalsource of liquidity is operating cash flows from continuing operations,which, after netting out capital expenditures, we target toequal or exceed net income attributable to common shareownersfrom continuing operations. In addition to operating cash flows,other significant factors that affect our overall management of liquidityinclude: capital expenditures, customer financing requirements,investments in businesses, dividends, common stock repurchases,pension funding, access to the commercial paper markets,adequacy of available bank lines of credit, and the ability to attractlong-term capital at satisfactory terms.Improvement in the global economy remains uneven. Whilethere continues to be a level of fiscal uncertainty in Europe and theU.S., we have seen signs of stabilization in Europe, gradual recoveryin the U.S., and continued but modest strength in emergingmarkets. In light of these circumstances, we continue to assess ourcurrent business and closely monitor the impact on our customersand suppliers, and have determined that overall there has not beena significant impact on our financial position, results of operationsor liquidity during <strong>2012</strong>.Our domestic pension funds, excluding the acquired Goodrichdomestic pension funds, experienced a positive return onassets of approximately 14% and 7% during <strong>2012</strong> and 2011,respectively. Approximately 89% of these domestic pension plansare invested in readily-liquid investments, including equity, fixedincome, asset-backed receivables and structured products. Thebalance of these domestic pension plans (11%) is invested in lessliquidbut market-valued investments, including real estate and privateequity. Across our global pension plans, the continuedrecognition of prior pension losses and the impact of a lower discountrate, partially offset by additional funding and the positivereturns experienced during <strong>2012</strong>, are expected to result inincreased pension expense in 2013 of approximately $250 millionas compared to <strong>2012</strong>. As part of the Goodrich acquisition, weassumed approximately $5.2 billion of pension projected benefitobligation and $3.8 billion of plan assets.As discussed further below, despite our increased debtlevels incurred to finance the Goodrich acquisition, our strong debtratings and financial position have historically enabled us to issuelong-term debt at favorable market rates, including our issuance of$9.8 billion of long-term debt in June <strong>2012</strong>. Our ability to obtaindebt financing at comparable risk-based interest rates is partly afunction of our existing debt-to-total-capitalization level as well asour current credit standing.The purchase price of Goodrich of $127.50 per share incash equated to a total enterprise value of $18.3 billion, including$1.9 billion in net debt assumed. To finance the cash considerationfor the Goodrich acquisition and pay related fees, expenses andother amounts due and payable as a result of the acquisition, weutilized the net proceeds of approximately $9.6 billion from the $9.8billion of long-term notes issued on June 1, <strong>2012</strong>, the net proceedsof approximately $1.1 billion from the equity units issued onJune 18, <strong>2012</strong>, $3.2 billion from the issuance of commercial paperduring July <strong>2012</strong> and $2.0 billion of proceeds borrowed on July 26,<strong>2012</strong> pursuant to our April 24, <strong>2012</strong> term loan credit agreement, allof which are discussed below. The $2.0 billion borrowed pursuantto our April 24, <strong>2012</strong> term loan credit agreement was prepaid inNovember and December <strong>2012</strong>. For the remainder of the cashconsideration, we utilized approximately $0.5 billion of cash andcash equivalents generated from operating activities.On December 6, <strong>2012</strong>, we announced that we had commencedcash tender offers for six series of outstanding notes originallyissued by Goodrich and assumed by us through theacquisition. These offers expired on January 7, 2013. Holders validlytendering their notes by December 19, <strong>2012</strong> received considerationdetermined by reference to a fixed spread over the yield tomaturity (or in the case of one series, yield to call) of the applicableU.S. Treasury security with the same maturity, plus an early tenderpayment of $30 per $1,000 principal amount of notes accepted forpurchase. Holders validly tendering their notes after December 19,<strong>2012</strong> but prior to January 8, 2013 received considerationdetermined by reference to a fixed spread over the yield to maturity(or in the case of one series, yield to call) of the applicable U.S.Treasury security with the same maturity. Approximately $637 millionin aggregate principal amount of the outstanding Goodrichnotes were tendered under these offers, with $635 million inaggregate principal amount being eligible for the early tender premium.Total payments under these tender offers were approximately$790 million including principal, premium and interest.In <strong>2012</strong>, we approved plans for the divestiture of a numberof non-core businesses. On December 13, <strong>2012</strong>, we completed thesale of the legacy Hamilton Sundstrand Industrial businesses to aprivate limited liability company formed by affiliates of BC Partnersand affiliates of The Carlyle Group for $3.4 billion. The tax expenseassociated with this transaction was approximately $1.2 billion. Asignificant portion of the tax will be included in our net tax paymentsfor 2013. On July 23, <strong>2012</strong>, we announced an agreement to sell ourRocketdyne unit to GenCorp Inc. for $550 million. On December 12,<strong>2012</strong>, we announced an agreement to sell our Pratt & Whitney PowerSystems unit to Mitsubishi Heavy Industries. Both transactions areexpected to close in the first half of 2013. On December 22, <strong>2012</strong> weannounced an agreement to sell our UTC Power unit to ClearEdgePower with an expected closing in the first quarter of 2013. Cashgenerated from these divestitures is intended to be used to repaydebt incurred to finance the Goodrich acquisition.To manage the cash flow and liquidity impacts of theseactions, we suspended share repurchases in <strong>2012</strong> and the fourthquarter of 2011, and will significantly reduce repurchases fromhistorical levels for 2013 and 2014. In addition, we will reduceour budgeted acquisition spending for the next few years, whichfor 2013 we expect to approximate $1 billion; however, actual
44 UNITED TECHNOLOGIES CORPORATIONacquisition spending may vary depending on the timing, availabilityand appropriate value of acquisition opportunities.On June 1, <strong>2012</strong>, we issued a total of $9.8 billion of longtermdebt, which is comprised of $1.0 billion aggregate principalamount of 1.200% notes due 2015, $1.5 billion aggregate principalamount of 1.800% notes due 2017, $2.3 billion aggregate principalamount of 3.100% notes due 2022, $3.5 billion aggregate principalamount of 4.500% notes due 2042, $1.0 billion aggregate principalamount of three-month LIBOR plus 0.270% floating rate notes due2013, and $0.5 billion aggregate principal amount of three-monthLIBOR plus 0.500% floating rate notes due 2015. The three-monthLIBOR rate as of December 31, <strong>2012</strong> was approximately 0.3%.On June 18, <strong>2012</strong>, we issued 22,000,000 equity units andreceived approximately $1.1 billion in net proceeds. Each equityunit has a stated amount of $50 and initially is in the form of acorporate unit consisting of (a) a freestanding stock purchase contractunder which the holder will purchase from us on August 1,2015, a number of shares of our common stock determined pursuantto the terms of the agreement and (b) a 1/20, or 5.0%,undivided beneficial ownership interest in $1,000 principal amounton our 1.55% junior subordinated notes due 2022. Holders of theequity units are entitled to receive quarterly contract adjustmentpayments at a rate of 5.95% per year of the stated amount of $50per equity unit, subject to our right to defer such payments.At December 31, <strong>2012</strong>, we had revolving credit agreementswith various banks permitting aggregate borrowings of up to $4.0billion pursuant to a $2.0 billion revolving credit agreement and a$2.0 billion multicurrency revolving credit agreement, both of whichexpire in November 2016. As of December 31, <strong>2012</strong> and 2011,there were no borrowings under either of these revolving creditagreements. The undrawn portions of our revolving credit agreementsare also available to serve as backup facilities for the issuanceof commercial paper. As of December 31, <strong>2012</strong>, our maximumcommercial paper borrowing authority as set by our Board of Directorswas $4 billion. We generally use our commercial paper borrowingsfor general corporate purposes, including the funding ofpotential acquisitions and repurchases of our common stock.We continue to have access to the commercial paper marketsand our existing credit facilities, and expect to continue to generatestrong operating cash flows. While the impact of marketvolatility cannot be predicted, we believe we have sufficient operatingflexibility, cash reserves and funding sources to maintain adequateamounts of liquidity and to meet our future operating cash needs.Given our extensive international operations, most of ourcash is denominated in foreign currencies. We manage our worldwidecash requirements by reviewing available funds among themany subsidiaries through which we conduct our business and thecost effectiveness with which those funds can be accessed. Therepatriation of cash balances from certain of our subsidiaries couldhave adverse tax consequences or be subject to capital controls;however, those balances are generally available without legalrestrictions to fund ordinary business operations. As discussed inNote 11, with few exceptions, U.S. income taxes have not beenprovided on undistributed earnings of international subsidiaries. Ourintention is to reinvest these earnings permanently or to repatriatethe earnings only when it is tax effective to do so.On occasion, we are required to maintain cash depositswith certain banks with respect to contractual obligations related toacquisitions or divestitures or other legal obligations. As ofDecember 31, <strong>2012</strong> and 2011, the amount of such restricted cashwas approximately $35 million and $37 million, respectively, and isincluded in current assets.We believe our future operating cash flows will be sufficientto meet our future operating cash needs. Further, our ability toobtain debt or equity financing, as well as the availability undercommitted credit lines, provides additional potential sources of liquidityshould they be required or appropriate.Cash Flow—Operating Activities of Continuing Operations(DOLLARS IN MILLIONS) <strong>2012</strong> 2011Net cash flows provided by operating activities ofcontinuing operations $ 6,605 $ 6,460The increase in net cash flows provided by operating activitiesof continuing operations in <strong>2012</strong> as compared with 2011 wasdriven primarily by lower working capital cash requirements, and adecrease in global pension contributions of $121 million. Included inincome from continuing operations in <strong>2012</strong> were approximately$157 million of net non-cash gains from the portfolio transformationactivities at UTC Climate, Controls & Security, an approximately$218 million non-cash tax and interest benefit from the conclusionof the examination by the Internal Revenue Service (IRS) of our2006 – 2008 tax years and an approximately $59 million non-cashtax and interest benefit from the resolution of disputes with theAppeals Division of the IRS for our 2004 – 2005 tax years. In <strong>2012</strong>,the net decrease in working capital provided positive cash flow of$103 million, including a $157 million loss provision recorded on theCH-148 contract at Sikorsky, compared to a cash outflow of $291million in 2011. This increase of $394 million was primarily driven bya decrease in accounts receivable due to strong collections, partiallyoffset by an increase in inventories largely associated withanticipated volume changes at Sikorsky and Pratt & Whitney.The funded status of our defined benefit pension plans isdependent upon many factors, including returns on invested assetsand the level of market interest rates. We can contribute cash orUTC shares to our plans at our discretion, subject to applicableregulations. Total cash contributions to our global defined benefitpension plans were $430 million and $551 million during <strong>2012</strong> and2011, respectively. During 2011, we also contributed $450 million inUTC common stock to our defined benefit pension plans. As ofDecember 31, <strong>2012</strong>, the total investment by the global definedbenefit pension plans in our securities was approximately 3% of total
Management’s Discussion and Analysis <strong>2012</strong> ANNUAL REPORT 45plan assets. We expect to make contributions of approximately $200million to our foreign defined benefit pension plans in 2013. Althoughour domestic defined benefit pension plans are approximately 84%funded on a projected benefit obligation basis, and we are notrequired to make additional contributions through the end of 2013,we may elect to make discretionary contributions in 2013. Contributionsto our global defined benefit pension plans in 2013 areexpected to meet or exceed the current funding requirements.Cash Flow—Investing Activities of Continuing Operations(DOLLARS IN MILLIONS) <strong>2012</strong> 2011Net cash flows used in investing activities ofcontinuing operations $ (18,795) $ (672)The increase in cash used in investing activities of continuingoperations was primarily a result of the Goodrich acquisition,which required cash payments, net of cash acquired, of $15.8 billion,as well as payments made to Rolls-Royce, net of cashacquired, to acquire their ownership and collaboration interests inIAE and license its V2500 intellectual property to Pratt & Whitney ofapproximately $1.7 billion in total, reflected in acquisitions of businessesand as an increase in collaboration intangible assets. Partiallyoffsetting these increases, concurrent with the closing of thepurchase of Rolls-Royce’s interests in IAE, Pratt & Whitney enteredinto a collaboration arrangement with MTU with respect to a portionof the acquired collaboration interest in IAE for consideration ofapproximately $233 million, with additional payments due to Pratt &Whitney in the future. Investments in businesses during <strong>2012</strong> alsoincluded a number of additional small acquisitions in our commercialand aerospace businesses. We expect total cash investmentsfor acquisitions in 2013 to be approximately $1 billion; however,actual acquisition spending may vary depending upon the timing,availability and appropriate value of acquisition opportunities. Capitalexpenditures increased $460 million primarily at Pratt & Whitneyand Otis, reflecting expenditures related to investments in newprograms and low-cost manufacturing facilities, as well as at UTCAerospace Systems due to spending at legacy Goodrich businessessubsequent to acquisition.Customer financing activities were a net use of cash of $25million in <strong>2012</strong>, compared to a net source of cash of $50 million in2011. While we expect that 2013 customer financing activity will be anet use of funds, actual funding is subject to usage under existingcustomer financing commitments during the year. We may alsoarrange for third-party investors to assume a portion of our commitments.At December 31, <strong>2012</strong>, we had commercial aerospacefinancing and other contractual commitments of approximately $10.9billion, which includes approximately $5.8 billion of IAE commitments,related to commercial aircraft and certain contractual rights to provideproduct on new aircraft platforms, of which as much as $1.1 billionmay be required to be disbursed during 2013. As discussed in Note17, we have entered into certain collaboration arrangements, whichmay include participation by our collaborators in these commitments.At December 31, <strong>2012</strong>, our collaborators’ share of these commitmentswas approximately $2.0 billion, which includes approximately$1.1 billion of IAE commitments, of which as much as $252 millionmay be required to be disbursed during 2013. Refer to Note 5 to theConsolidated Financial Statements for additional discussion of ourcommercial aerospace industry assets and commitments.Cash Flow—Financing Activities of Continuing Operations(DOLLARS IN MILLIONS) <strong>2012</strong> 2011Net cash flows provided by (used in) financingactivities of continuing operations $ 8,021 $ (3,983)The timing and levels of certain cash flow activities, such asacquisitions and repurchases of our stock, have resulted in theissuance of both long-term and short-term debt. In June <strong>2012</strong>, weissued $9.8 billion of long-term debt and $1.1 billion of equity units,and in July <strong>2012</strong>, we borrowed $2.0 billion from our term loancredit agreement and issued $3.2 billion of commercial paper primarilyto partially finance the Goodrich acquisition and pay relatedfees, expenses and other amounts due and payable by UTC as aresult of the acquisition. Commercial paper borrowings and revolvingcredit facilities provide short-term liquidity to supplement operatingcash flows and are used for general corporate purposes,including the funding of potential acquisitions and repurchases ofour stock. We had $320 million and $455 million of commercialpaper outstanding at December 31, <strong>2012</strong> and 2011, respectively.In December 2011, we redeemed the entire $500 million outstandingprincipal amount of our 6.100% notes that would otherwisehave been due May 15, <strong>2012</strong>.In connection with the Goodrich acquisition, we suspendedshare repurchases for <strong>2012</strong> and the fourth quarter of 2011, andwill significantly reduce repurchases from historical levels for 2013and 2014. At December 31, <strong>2012</strong>, management had authority torepurchase approximately 7 million shares under the previouslyannounced share repurchase program. When we repurchaseshares, our share repurchases vary depending upon various factorsincluding the level of other investing activities. Financing cash outflowsfor 2011 included the repurchase of 26.9 million shares of ourcommon stock for approximately $2.2 billion under the previouslyannounced share repurchase program.In <strong>2012</strong>, we paid aggregate dividends on common stock ofapproximately $1.8 billion, consisting of $0.48 per share in the firstquarter of <strong>2012</strong> totaling $412 million, $0.48 per share in the secondquarter of <strong>2012</strong> totaling $413 million, $0.535 per share in the thirdquarter of <strong>2012</strong> totaling $463 million, and $0.535 per share in thefourth quarter of <strong>2012</strong> totaling $464 million. During 2011, anaggregate $1.6 billion of cash dividends were paid to commonstock shareowners.We have an existing universal shelf registration statement filedwith the SEC for an indeterminate amount of debt and equity securities
46 UNITED TECHNOLOGIES CORPORATIONfor future issuance, subject to our internal limitations on the amount ofsecurities to be issued under this shelf registration statement.Cash Flow—Discontinued Operations(DOLLARS IN MILLIONS) <strong>2012</strong> 2011Net cash flows provided by discontinued operations $ 3,015 $ 73Cash flows provided by discontinued operations primarilyrelate to the completed divestitures of two businesses. As discussedabove, on December 13, <strong>2012</strong> we completed the sale of the legacyHamilton Sundstrand Industrial businesses for $3.4 billion. The taxexpense associated with this transaction was approximately $1.2billion. A significant portion of the tax will be included in our net taxpayments for 2013. Also, on August 7, <strong>2012</strong>, we completed thedisposition of Clipper to a private equity acquirer. The dispositionresulted in payments totaling approximately $367 million, whichincluded capitalization of the business prior to sale, transaction fees,and funding of operations as the acquirer took control of a businesswith significant net liabilities.CRITICAL ACCOUNTING ESTIMATESPreparation of our financial statements requires management tomake estimates and assumptions that affect the reported amountsof assets, liabilities, revenues and expenses. Note 1 to the ConsolidatedFinancial Statements describes the significant accountingpolicies used in preparation of the Consolidated Financial Statements.Management believes the most complex and sensitivejudgments, because of their significance to the Consolidated FinancialStatements, result primarily from the need to make estimatesabout the effects of matters that are inherently uncertain. The mostsignificant areas involving management judgments and estimatesare described below. Actual results in these areas could differ frommanagement’s estimates.Long-Term Contract Accounting. We utilize percentageof-completionaccounting on certain of our long-term contracts.The percentage-of-completion method requires estimates of futurerevenues and costs over the full term of product and/or servicedelivery. We also utilize the completed-contract method of accountingon certain lesser value commercial contracts. Under thecompleted-contract method, sales and cost of sales are recognizedwhen a contract is completed.Losses, if any, on long-term contracts are provided for whenanticipated. We recognize loss provisions on original equipmentcontracts to the extent that estimated inventoriable manufacturing,engineering, product warranty and product performance guaranteecosts, as appropriate, exceed the projected revenue from the productscontemplated under the contractual arrangement. For newcommitments, we generally record loss provisions at the earlier ofcontract announcement or contract signing except for certainrequirements contracts under which losses are recorded based uponreceipt of the purchase order. For existing commitments, anticipatedlosses on contracts are recognized in the period in which lossesbecome evident. Products contemplated under the contractualarrangement include products purchased under the contract and, inthe large commercial engine and wheels and brakes businesses,future highly probable sales of replacement parts required by regulationthat are expected to be purchased subsequently forincorporation into the original equipment. Revenue projections usedin determining contract loss provisions are based upon estimates ofthe quantity, pricing and timing of future product deliveries. We generallyrecognize losses on shipment to the extent that inventoriablemanufacturing costs, estimated warranty costs and productperformance guarantee costs, as appropriate, exceed revenue realized.We measure the extent of progress toward completion on ourlong-term commercial aerospace equipment and helicopter contractsusing units-of-delivery. In addition, we use the cost-to-costmethod for elevator and escalator sales, installation and modernizationcontracts in the commercial businesses. For long-term aftermarketcontracts, we recognize revenue over the contract period inproportion to the costs expected to be incurred in performing servicesunder the contract. Contract accounting also requires estimatesof future costs over the performance period of the contract as well asan estimate of award fees and other sources of revenue.Contract costs are incurred over a period of time, which canbe several years, and the estimation of these costs requiresmanagement’s judgment. The long-term nature of these contracts,the complexity of the products, and the strict safety and performancestandards under which they are regulated can affect our ability toestimate costs precisely. As a result, we review and update our costestimates on significant contracts on a quarterly basis, and no lessfrequently than annually for all others, or when circumstances changeand warrant a modification to a previous estimate. We recordchanges in contract estimates using the cumulative catch-up methodin accordance with the Revenue Recognition Topic of the FASB ASC.Income Taxes. The future tax benefit arising from netdeductible temporary differences and tax carryforwards was $3.2 billionat December 31, <strong>2012</strong> and $4.0 billion at December 31, 2011.Management believes that our earnings during the periods when thetemporary differences become deductible will be sufficient to realizethe related future income tax benefits. For those jurisdictions wherethe expiration date of tax carryforwards or the projected operatingresults indicate that realization is not likely, a valuation allowance isprovided.In assessing the need for a valuation allowance, we estimatefuture taxable income, considering the feasibility of ongoingtax planning strategies and the realizability of tax loss carryforwards.Valuation allowances related to deferred tax assets can be affectedby changes to tax laws, changes to statutory tax rates and futuretaxable income levels. In the event we were to determine that wewould not be able to realize all or a portion of our deferred taxassets in the future, we would reduce such amounts through an
Management’s Discussion and Analysis <strong>2012</strong> ANNUAL REPORT 47increase to tax expense in the period in which that determination ismade or when tax law changes are enacted. Conversely, if we wereto determine that we would be able to realize our deferred taxassets in the future in excess of the net carrying amounts, we woulddecrease the recorded valuation allowance through a decrease totax expense in the period in which that determination is made.In the ordinary course of business there is inherentuncertainty in quantifying our income tax positions. We assess ourincome tax positions and record tax benefits for all years subject toexamination based upon management’s evaluation of the facts,circumstances and information available at the reporting date. Forthose tax positions where it is more likely than not that a tax benefitwill be sustained, we have recorded the largest amount of tax benefitwith a greater than 50% likelihood of being realized upon ultimatesettlement with a taxing authority that has full knowledge of all relevantinformation. For those income tax positions where it is notmore likely than not that a tax benefit will be sustained, no tax benefithas been recognized in the financial statements. See Notes 1 and11 to the Consolidated Financial Statements for further discussion.Goodwill and Intangible Assets. Our investments inbusinesses in <strong>2012</strong> totaled $18.6 billion, including approximately$2.6 billion of debt assumed. The assets and liabilities of acquiredbusinesses are recorded under the acquisition method of accountingat their estimated fair values at the dates of acquisition. Goodwillrepresents costs in excess of fair values assigned to theunderlying identifiable net assets of acquired businesses. Intangibleassets consist of service portfolios, patents, trademarks/tradenames, customer relationships and other intangible assetsincluding a collaboration asset established in connection with therestructuring of IAE as discussed above and in Note 2 to the ConsolidatedFinancial Statements. Also included within other intangibleassets are commercial aerospace payments made to secure certaincontractual rights to provide product on new aircraft platforms.Payments made on these contractual commitments are to beamortized as the related OEM and aftermarket units are delivered.The gross value of these contractual commitments atDecember 31, <strong>2012</strong> was approximately $2.6 billion, of whichapproximately $700 million has been paid to date. We record thesepayments as intangible assets when such payments are no longerconditional. The recoverability of these intangibles is dependentupon the future success and profitability of the underlying aircraftplatforms including the associated aftermarket revenue streams.Goodwill and intangible assets deemed to have indefinitelives are not amortized, but are subject to annual impairment testingusing the guidance and criteria described in the “Intangibles—Goodwill and Other” Topic of the FASB ASC. This testing comparescarrying values to fair values and, when appropriate, the carryingvalues of these assets is reduced to fair value. During <strong>2012</strong> we earlyadopted the FASB Accounting Standards Update (ASU) No. <strong>2012</strong>-02, “Testing Indefinite-Lived Intangible Assets for Impairment” inconnection with the performance of our annual goodwill andindefinite lived intangible assets impairment test. This ASU intends toalign impairment testing guidance among long-lived asset categories.This ASU allows the assessment based on qualitative factors todetermine whether it is more likely than not that an indefinite-livedintangible asset is impaired prior to determining whether it is necessaryto perform the quantitative impairment test in accordance withASC Subtopic 350-30, “Intangibles—Goodwill and Other—GeneralIntangibles Other than Goodwill.” We completed our annual impairmenttesting as of July 1, <strong>2012</strong> and determined that no significantadjustments to the carrying value of goodwill or indefinite livedintangible assets were necessary based on the results of theimpairment tests, other than those impairment charges associatedwith certain businesses reclassified to discontinued operations.During <strong>2012</strong>, we recorded goodwill impairment charges of $980 millionin discontinued operations in connection with the disposition ofRocketdyne, Clipper and UTC Power. The goodwill impairmentcharges on both Rocketdyne and Clipper result from the decision todispose of the businesses within a relatively short period after theywere acquired. Consequently, there has not been sufficient opportunityfor the long-term operations to recover the value implicit ingoodwill at the initial date of acquisition. The impairment charge atUTC Power resulted from the disposition of the business before thebenefits of the technology investments were fully realized. Althoughthe remaining goodwill is not currently impaired, there can be noassurances that future goodwill impairments will not occur. See Note2 to the Consolidated Financial Statements for further discussion.Product Performance. We extend performance andoperating cost guarantees beyond our normal service and warrantypolicies for extended periods on some of our products, particularlycommercial aircraft engines. Liability under such guarantees isbased upon future product performance and durability. In addition,we incur discretionary costs to service our products in connectionwith product performance issues. We accrue for such costs thatare probable and can be reasonably estimated. The costs associatedwith these product performance and operating cost guaranteesrequire estimates over the full terms of the agreements, andrequire management to consider factors such as the extent offuture maintenance requirements and the future cost of materialand labor to perform the services. These cost estimates are largelybased upon historical experience. See Note 16 to the ConsolidatedFinancial Statements for further discussion.Contracting with the U.S. Government. Our contractswith the U.S. Government are subject to government oversight andaudit. Like many defense contractors, we have received auditreports which recommend that certain contract prices should bereduced to comply with various government regulations. Some ofthese audit reports have involved substantial amounts. We havemade voluntary refunds in those cases we believe appropriate, havesettled some allegations and continue to litigate certain cases. Inaddition, we accrue for liabilities associated with those governmentcontracting matters that are probable and can be reasonably
48 UNITED TECHNOLOGIES CORPORATIONestimated. The inherent uncertainty related to the outcome of thesematters can result in amounts materially different from any provisionsmade with respect to their resolution. See Note 18 to theConsolidated Financial Statements for further discussion. Werecorded sales to the U.S. Government of $10.1 billion in <strong>2012</strong>,$9.1 billion in 2011, and $9.1 billion in 2010.Employee Benefit Plans. We sponsor domestic and foreigndefined benefit pension and other postretirement plans. Majorassumptions used in the accounting for these employee benefitplans include the discount rate, expected return on plan assets, rateof increase in employee compensation levels, and health care costincrease projections. Assumptions are determined based on companydata and appropriate market indicators, and are evaluatedeach year at December 31. A change in any of these assumptionswould have an effect on net periodic pension and postretirementbenefit costs reported in the Consolidated Financial Statements.In the following table, we show the sensitivity of our pensionand other postretirement benefit plan liabilities and net annualperiodic cost to a 25 basis point change in the discount rate as ofDecember 31, <strong>2012</strong>:(DOLLARS IN MILLIONS)Increase inDiscount Rateof 25 bpsDecrease inDiscount Rateof 25 bpsPension plansProjected benefit obligation $ (1,073) $ 1,111Net periodic pension cost (85) 88Other postretirement benefit plansAccumulated postretirement benefit obligation (20) 21Net periodic postretirement benefit cost 1 (1)Pension expense is also sensitive to changes in theexpected long-term rate of asset return. An increase or decrease of25 basis points in the expected long-term rate of asset return wouldhave decreased or increased <strong>2012</strong> pension expense by approximately$67 million.The weighted-average discount rate used to measure pensionliabilities and costs is set by reference to UTC specific analysisusing each plan’s specific cash flows and is then compared tohigh-quality bond indices for reasonableness. Global marketinterest rates have decreased in <strong>2012</strong> as compared with 2011 and,as a result, the weighted-average discount rate used to measurepension liabilities decreased from 4.7% in 2011 to 4.0% in <strong>2012</strong>. InDecember 2009, we amended the salaried retirement plans(qualified and non-qualified) to change the retirement formula effectiveJanuary 1, 2015. At that time, final average earnings (FAE) andcredited service will stop under the formula applicable for hiresbefore July 1, 2002. Employees hired after 2009 are not eligible forany defined benefit pension plan and will instead receive anenhanced benefit under the UTC Savings Plan. As of July 26, <strong>2012</strong>the same amendment was applied to legacy Goodrich salariedemployees. The continued recognition of prior pension losses andthe impact of a lower discount rate, partially offset by additionalfunding and the positive returns experienced during <strong>2012</strong>, areexpected to increase pension expense in 2013 by approximately$250 million as compared to <strong>2012</strong>. See Note 12 to the ConsolidatedFinancial Statements for further discussion.Inventory Valuation Reserves. Inventory valuationreserves are established in order to report inventories at the lower ofcost or market value on our Consolidated Balance Sheet. Thedetermination of inventory valuation reserves requires managementto make estimates and judgments on the future salability ofinventories. Valuation reserves for excess, obsolete, and slowmovinginventory are estimated by comparing the inventory levels ofindividual parts to both future sales forecasts or production requirementsand historical usage rates in order to identify inventory wherethe resale value or replacement value is less than inventoriable cost.Other factors that management considers in determining theadequacy of these reserves include whether individual inventoryparts meet current specifications and cannot be substituted for apart currently being sold or used as a service part, overall marketconditions, and other inventory management initiatives.As of December 31, <strong>2012</strong> and 2011, we had $866 millionand $884 million, respectively, of inventory valuation reservesrecorded. Although management believes these reserves areadequate, any abrupt changes in market conditions may require usto record additional inventory valuation reserves.OFF-BALANCE SHEET ARRANGEMENTS AND CONTRACTUALOBLIGATIONSWe extend a variety of financial guarantees to third parties in supportof unconsolidated affiliates and for potential financing requirementsof commercial aerospace customers. We also haveobligations arising from sales of certain businesses and assets,including indemnities for representations and warranties and environmental,health and safety, tax and employment matters.Circumstances that could cause the contingent obligations andliabilities arising from these arrangements to come to fruition includechanges in an underlying transaction (e.g., hazardous wastediscoveries, etc.), nonperformance under a contract, customerrequests for financing, or deterioration in the financial condition ofthe guaranteed party.A summary of our consolidated contractual obligations andcommitments as of December 31, <strong>2012</strong> is as follows:Payments Due by Period(DOLLARS IN MILLIONS) Total 2013 2014 – 2015 2016 – 2017 ThereafterLong-term debt—principal $ 22,365 $ 1,121 $ 2,773 $ 2,841 $ 15,630Long-term debt—futureinterest 14,628 1,023 1,982 1,708 9,915Operating leases 2,486 646 888 413 539Purchase obligations 16,076 8,389 5,376 982 1,329Other long-term liabilities 4,586 862 1,369 1,272 1,083Total contractual obligations $ 60,141 $ 12,041 $ 12,388 $ 7,216 $ 28,496
Management’s Discussion and Analysis <strong>2012</strong> ANNUAL REPORT 49Purchase obligations include amounts committed underlegally enforceable contracts or purchase orders for goods andservices with defined terms as to price, quantity, delivery and terminationliability. Approximately 21% of the purchase obligations disclosedabove represent purchase orders for products to bedelivered under firm contracts with the U.S. Government for whichwe have full recourse under customary contract termination clauses.Other long-term liabilities primarily include those amountson our December 31, <strong>2012</strong> balance sheet representing obligationsunder product service and warranty policies, performance andoperating cost guarantees, estimated environmental remediationcosts and expected contributions under employee benefit programs.The timing of expected cash flows associated with theseobligations is based upon management’s estimates over the termsof these agreements and is largely based upon historical experience.In connection with the acquisition of Goodrich, werecorded customer contractual obligations of approximately $2.0billion relating to certain Goodrich OEM development programswhere the expected costs exceed the expected revenues undercontract. These liabilities will be liquidated in accordance with theunderlying economic pattern of obligations, as reflected by the netcash outflows incurred on the OEM contracts. We expect thesecustomer contractual obligations will be liquidated as follows: $283million in 2013, $513 million in 2014 through 2015, $456 million in2016 through 2017, and $634 million thereafter. These amountsare not included in the table above.The above table also does not reflect unrecognized taxbenefits of $1,073 million, the timing of which is uncertain, exceptfor approximately $129 million that may become payable during2013. Refer to Note 11 to the Consolidated Financial Statementsfor additional discussion on unrecognized tax benefits.COMMERCIAL COMMITMENTSAmount of Commitment Expiration per Period(DOLLARS IN MILLIONS) Committed 2013 2014 – 2015 2016 – 2017 ThereafterCommercial aerospacefinancing commitments $ 3,237 $ 339 $ 1,150 $ 798 $ 950Other commercial aerospacecommitments 7,628 736 1,196 1,314 4,382Commercial aerospacefinancing arrangements 346 42 118 14 172Unconsolidated subsidiarydebt guarantees 240 108 35 – 97Performance guarantees 33 33 – – –Total commercialcommitments $ 11,484 $ 1,258 $ 2,499 $ 2,126 $ 5,601The table above includes IAE’s gross obligation at December 31, <strong>2012</strong>; our proportionateshare of IAE’s obligations was 61%. Refer to the Segment Review for additionaldiscussion of our agreement with Rolls-Royce to restructure the IAE interests.Other commercial aerospace commitments include amounts related to our agreementwith Embraer, which we announced on January 8, 2013, to power the next generationEmbraer E-Jet family.In exchange for the increased ownership and collaborationinterests and intellectual property license, Pratt & Whitney paidRolls-Royce $1.5 billion at closing with additional payments due toRolls-Royce contingent upon each hour flown by the V2500-powered aircraft in service as of June 29, <strong>2012</strong> during the fifteenyear period following closing of the purchase. These payments willbe capitalized as a collaboration intangible asset and amortized inrelation to the economic benefits received over the projectedremaining 30 year life of the V2500 program. The flight hour paymentsare included in other commercial aerospace commitments inthe table above. As previously reported, Pratt & Whitney enteredinto a collaboration arrangement with MTU with respect to a portionof the collaboration interest in IAE acquired from Rolls-Royce forconsideration of approximately $233 million with additional paymentsdue to Pratt & Whitney in the future.Refer to Notes 5, 16, and 18 to the Consolidated FinancialStatements for additional discussion on contractual and commercialcommitments.MARKET RISK AND RISK MANAGEMENTWe are exposed to fluctuations in foreign currency exchange rates,interest rates and commodity prices. To manage certain of thoseexposures, we use derivative instruments, including swaps, forwardcontracts and options. Derivative instruments utilized by us in ourhedging activities are viewed as risk management tools, involve littlecomplexity and are not used for trading or speculative purposes.We diversify the counterparties used and monitor the concentrationof risk to limit our counterparty exposure.We have evaluated our exposure to changes in foreigncurrency exchange rates, interest rates and commodity prices inour market risk sensitive instruments, which are primarily cash, debtand derivative instruments, using a value at risk analysis. Based ona 95% confidence level and a one-day holding period, atDecember 31, <strong>2012</strong>, the potential loss in fair value on our marketrisk sensitive instruments was not material in relation to our financialposition, results of operations or cash flows. Our calculated value atrisk exposure represents an estimate of reasonably possible netlosses based on volatilities and correlations and is not necessarilyindicative of actual results. Refer to Notes 1, 9 and 14 to the ConsolidatedFinancial Statements for additional discussion of foreigncurrency exchange, interest rates and financial instruments.Foreign Currency Exposures. We have a large volume offoreign currency exposures that result from our international sales,purchases, investments, borrowings and other international transactions.International segment sales, including U.S. export sales,averaged approximately $34 billion over the last three years. Weactively manage foreign currency exposures that are associatedwith committed foreign currency purchases and sales and otherassets and liabilities created in the normal course of business at the
50 UNITED TECHNOLOGIES CORPORATIONoperating unit level. More than insignificant exposures that cannotbe naturally offset within an operating unit are hedged with foreigncurrency derivatives. We also have a significant amount of foreigncurrency net asset exposures. Currently, we do not hold anyderivative contracts that hedge our foreign currency net assetexposures but may consider such strategies in the future.Within aerospace, our sales are typically denominated inU.S. Dollars under accepted industry convention. However, for ournon-U.S. based entities, such as P&WC, a substantial portion oftheir costs are incurred in local currencies. Consequently, there is aforeign currency exchange impact and risk to operational results asU.S. Dollars must be converted to local currencies such as theCanadian Dollar in order to meet local currency cost obligations. Inorder to minimize the exposure that exists from changes in theexchange rate of the U.S. Dollar against these other currencies, wehedge a certain portion of sales to secure the rates at which U.S.Dollars will be converted. The majority of this hedging activityoccurs at P&WC. At P&WC, firm and forecasted sales for bothengines and spare parts are hedged at varying amounts up to 24months on the U.S. Dollar sales exposure as represented by theexcess of U.S. Dollar sales over U.S. Dollar denominated purchases.Hedging gains and losses resulting from movements inforeign currency exchange rates are partially offset by the foreigncurrency translation impacts that are generated on the translation oflocal currency operating results into U.S. Dollars for reporting purposes.While the objective of the hedging program is to minimizethe foreign currency exchange impact on operating results, thereare typically variances between the hedging gains or losses and thetranslational impact due to the length of hedging contracts,changes in the sales profile, volatility in the exchange rates andother such operational considerations.Interest Rate Exposures. Our long-term debt portfolioconsists mostly of fixed-rate instruments. From time to time, wemay hedge to floating rates using interest rate swaps. The hedgesare designated as fair value hedges and the gains and losses onthe swaps are reported in interest expense, reflecting that portion ofinterest expense at a variable rate. We issue commercial paper,which exposes us to changes in interest rates. Currently, we do nothold any derivative contracts that hedge our interest exposures, butmay consider such strategies in the future.Commodity Price Exposures. We are exposed to volatilityin the prices of raw materials used in some of our products and fromtime to time we may use forward contracts in limited circumstancesto manage some of those exposures. In the future, if hedges areused, gains and losses may affect earnings. There were no significantoutstanding commodity hedges as of December 31, <strong>2012</strong>.ENVIRONMENTAL MATTERSOur operations are subject to environmental regulation by federal,state and local authorities in the <strong>United</strong> States and regulatoryauthorities with jurisdiction over our foreign operations. As a result,we have established, and continually update, policies relating toenvironmental standards of performance for our operations worldwide.We believe that expenditures necessary to comply with thepresent regulations governing environmental protection will nothave a material effect upon our competitive position, results ofoperations, cash flows or financial condition.We have identified 708 locations, mostly in the <strong>United</strong>States, at which we may have some liability for remediating contamination.We have resolved our liability at 261 of these locations.We do not believe that any individual location’s exposure will have amaterial effect on our results of operations. Sites in the investigation,remediation or operation and maintenance stage represent approximately94% of our accrued environmental remediation reserve.We have been identified as a potentially responsible partyunder the Comprehensive Environmental Response Compensationand Liability Act (CERCLA or Superfund) at 125 sites. The numberof Superfund sites, in and of itself, does not represent a relevantmeasure of liability because the nature and extent of environmentalconcerns vary from site to site and our share of responsibility variesfrom sole responsibility to very little responsibility. In estimating ourliability for remediation, we consider our likely proportionate share ofthe anticipated remediation expense and the ability of other potentiallyresponsible parties to fulfill their obligations.At December 31, <strong>2012</strong> and 2011, we had $847 million and$617 million reserved for environmental remediation, respectively.Cash outflows for environmental remediation were $35 million in<strong>2012</strong>, $54 million in 2011 and $44 million in 2010. We estimate thatongoing environmental remediation expenditures in each of the nexttwo years will not exceed approximately $70 million. The abovedescribed increase in reserves for environmental remediation as ofDecember 31, <strong>2012</strong> compared to December 31, 2011 and theincrease in estimated environmental expenditures in each of thenext two years are primarily attributable to the Goodrich acquisition.GOVERNMENT MATTERSAs described in “Critical Accounting Estimates—Contracting withthe U.S. Government,” our contracts with the U.S. Government aresubject to audits. Such audits may recommend that certain contractprices should be reduced to comply with various governmentregulations. We are also the subject of one or more investigationsand legal proceedings initiated by the U.S. Government withrespect to government contract matters.
Management’s Discussion and Analysis <strong>2012</strong> ANNUAL REPORT 51As previously disclosed, the U.S. Department of Justice(DOJ) sued us in 1999 in the U.S. District Court for the SouthernDistrict of Ohio, claiming that Pratt & Whitney violated the civil FalseClaims Act and common law. This lawsuit relates to the “FighterEngine Competition” between Pratt & Whitney’s F100 engine andGeneral Electric’s F110 engine. The DOJ alleges that the governmentoverpaid for F100 engines under contracts awarded by theU.S. Air Force in fiscal years 1985 through 1990 because Pratt &Whitney inflated its estimated costs for some purchased parts andwithheld data that would have revealed the overstatements. At trialof this matter, completed in December 2004, the governmentclaimed Pratt & Whitney’s liability to be $624 million. On August 1,2008, the trial court judge held that the Air Force had not sufferedany actual damages because Pratt & Whitney had made significantprice concessions. However, the trial court judge found that Pratt &Whitney violated the False Claims Act due to inaccurate statementscontained in its 1983 offer. In the absence of actual damages, thetrial court judge awarded the DOJ the maximum civil penalty of$7.09 million, or $10,000 for each of the 709 invoices Pratt & Whitneysubmitted in 1989 and later under the contracts. In September2008, both the DOJ and UTC appealed the decision to the SixthCircuit Court of Appeals. In November 2010, the Sixth Circuitaffirmed Pratt & Whitney’s liability under the False Claims Act andremanded the case to the trial court for further proceedings.On June 18, <strong>2012</strong>, the trial court found that Pratt & Whitneyhad breached other obligations imposed by common lawbased on the same conduct with respect to which the court previouslyfound liability under the False Claims Act. Under the commonlaw claims, the U.S. Air Force may seek damages for eventsoccurring before March 3, 1989, which are not recoverable underthe False Claims Act. Further proceedings at the trial court willdetermine the damages, if any, relating to the False Claims Act andcommon law claims. The government continues to seek damagesof $624 million, plus interest. Pratt & Whitney continues to contendthat the government suffered no actual damages. The parties havesubmitted briefs and await a decision from the trial court. Shouldthe government ultimately prevail, the outcome of this matter couldresult in a material adverse effect on our results of operations in theperiod in which a liability would be recognized or cash flows for theperiod in which damages would be paid.As previously disclosed, in December 2008, the Departmentof Defense (DOD) issued a contract claim against Sikorsky torecover overpayments the DOD alleges it has incurred since January2003 in connection with cost accounting changes approvedby the DOD and implemented by Sikorsky in 1999 and 2006. Thesechanges relate to the calculation of material overhead rates in governmentcontracts. The DOD claims that Sikorsky’s liability isapproximately $94 million (including interest through December 31,<strong>2012</strong>). We believe this claim is without merit and Sikorsky filed anappeal in December 2009 with the U.S. Court of Federal Claims.Trial in the matter concluded in January 2013 and we await a decisionfrom the court. We do not believe the resolution of this matterwill have a material adverse effect on our competitive position,results of operations, cash flows or financial condition.A significant portion of our activities are subject to exportcontrol regulation by the U.S. Department of State (State Department)under the U.S. Arms Export Control Act (AECA) and InternationalTraffic in Arms Regulations (ITAR). From time to time, weidentify, investigate, remediate and voluntarily disclose to the StateDepartment’s Office of Defense Trade Controls Compliance (DTCC)potential violations of the AECA and ITAR. DTCC administers theState Department’s authority under the AECA and ITAR to imposecivil penalties and other administrative sanctions for violations,including debarment from engaging in the export of defense articlesor defense services. Most of our voluntary disclosures are resolvedwithout the imposition of penalties or other sanctions. However, aspreviously disclosed, in November 2011, DTCC informed us that itconsiders certain of our voluntary disclosures filed since 2005 toreflect deficiencies warranting penalties and sanctions. On June 28,<strong>2012</strong>, we entered into a Consent Agreement (CA) with DTCC toresolve a Proposed Charging Letter that references approximately45 of our previous disclosures. The CA has a four-year term, andprovides that we will: (1) pay a civil penalty of $55 million, up to $20million of which can be suspended based on qualifying complianceinvestments made by us prior to or during the term of the CA;(2) appoint, subject to DTCC approval, an outside Special ComplianceOfficial (SCO) to oversee our compliance with the CA andthe AECA and ITAR; (3) continue and undertake additional remedialactions to strengthen AECA and ITAR compliance, with emphasison human resources and organization, training, automation, andsecurity of electronic data; and (4) sponsor two Company-wideoutside compliance audits during the term of the CA.The voluntary disclosures addressed in the CA include disclosuresmade in 2006 and 2007 regarding the export by HamiltonSundstrand to P&WC of certain modifications to dual-use electronicengine control software, and the re-export by P&WC of those softwaremodifications and subsequent P&WC-developed modificationsto China during the period 2002-2004 for use in thedevelopment of the Z-10 Chinese military helicopter. As previouslydisclosed, the DOJ separately conducted a criminal investigation ofthe matters addressed in these disclosures, as well as the accuracy,adequacy, and timeliness of the disclosures. We cooperatedwith the DOJ’s investigation. On June 28, <strong>2012</strong>, the U.S. Attorneyfor the District of Connecticut filed a three-count criminalinformation alleging: (1) that in 2002-2003, P&WC caused HamiltonSundstrand to export ITAR-controlled software modifications toCanada and re-exported them to China without the requiredlicense; (2) that in 2006, P&WC, Hamilton Sundstrand and UTCmade false statements in disclosures to DTCC regarding theseAECA and ITAR violations; and (3) that P&WC and Hamilton Sund-
52 UNITED TECHNOLOGIES CORPORATIONstrand violated a separate provision of the AECA and ITAR by failingtimely to notify DTCC of the unlicensed software shipments toChina. P&WC pleaded guilty to violating the AECA and the ITARand making false statements as alleged, and was sentenced toprobation and to pay fines and forfeitures totaling $6.9 million.P&WC, Hamilton Sundstrand and UTC (the UTC Entities) enteredinto a Deferred Prosecution Agreement (DPA) regarding the remainingoffenses charged with respect to each UTC Entity. The DPA hasa two-year term, and provides that the UTC Entities will: (1) pay anadditional penalty of $13.8 million; (2) appoint, subject to DOJapproval, an independent monitor (who may be the same person asthe SCO appointed under the CA) to oversee compliance with theDPA; (3) provide annual senior officer certifications that all knownviolations of the AECA and ITAR, Export Administration Regulationsand sanctions regimes implemented under the International EmergencyEconomic Powers Act occurring after the execution date ofthe DPA have been reported by UTC, its subsidiaries, and itsmajority-owned or controlled affiliates to the appropriate official(s) ofthe U.S. Government; (4) cooperate with law enforcement inspecified areas; and (5) implement specified compliance traininginitiatives.We believe the previously disclosed potential liabilityrecognized at March 31, <strong>2012</strong> of $55 million will be sufficient todischarge all amounts due under the CA and DPA.On June 28, <strong>2012</strong>, by reason of P&WC’s guilty plea to acriminal violation of the AECA and the ITAR, DTCC imposed apartial statutory debarment on P&WC with respect to obtaining newor renewed ITAR license privileges. The debarment does not affectexisting ITAR licenses/authorities, nor does it extend to programssupporting: (1) the U.S. Government; (2) NATO allies; or (3) “majornon-NATO allies” (as defined in the ITAR). P&WC may seek“transaction exception” approvals on a case-by-case basis for newor renewed ITAR licensing in other cases during the period ofdebarment. P&WC may apply for full reinstatement of ITARprivileges after one year. On December 20, <strong>2012</strong>, UTC entered intoan administrative agreement with the Department of the ArmySuspension and Debarment Official, where Army officialsdetermined that the UTC Entities are presently responsible and thatfurther action is not necessary to protect the U.S. Government’sinterests pursuant to the Federal Acquisition Regulation and theNational Defense Appropriations Act. The agreement with theDepartment of the Army Suspension and Debarment Official completesthe Department of Defense review of the UTC Entities’ presentresponsibility under the Federal Acquisition Regulation andP&WC’s eligibility to receive funds appropriated for fiscal year <strong>2012</strong>under the National Defense Appropriations Act.As previously disclosed, UTC has been involved in administrativereview proceedings with the German Tax Office, whichconcerns €203 million (approximately $270 million) of tax benefitsthat we have claimed related to a 1998 reorganization of the corporatestructure of Otis operations in Germany. A portion of these taxbenefits were disallowed by the local German Tax Office on July 5,<strong>2012</strong>, as a result of the audit of tax years 1999 to 2000. The legaland factual issues relating to the denial of the tax benefits center onthe interpretation and application of a German tax law. OnAugust 3, <strong>2012</strong>, the Company filed suit in the local German taxcourt and intends to litigate vigorously the matter to conclusion. Wedo not believe the resolution of this matter will have a materialadverse effect on our results of operations, cash flows or financialcondition.OTHER MATTERSAdditional discussion of our environmental, U.S. Government contractmatters, product performance and other contingent liabilities isincluded in “Critical Accounting Estimates” and Notes 1, 16 and 18to the Consolidated Financial Statements. For additional discussionof our legal proceedings, see Item 3, “Legal Proceedings,” in our<strong>Annual</strong> <strong>Report</strong> on Form 10-K for <strong>2012</strong> (<strong>2012</strong> Form 10-K).
Cautionary Note Concerning Factors That May Affect Future Results <strong>2012</strong> ANNUAL REPORT 53Cautionary Note Concerning Factors That May Affect Future ResultsThis <strong>2012</strong> <strong>Annual</strong> <strong>Report</strong> to Shareowners (<strong>2012</strong> <strong>Annual</strong> <strong>Report</strong>)contains statements which, to the extent they are not statements ofhistorical or present fact, constitute “forward-looking statements”under the securities laws. From time to time, oral or written forwardlookingstatements may also be included in other materials releasedto the public. These forward-looking statements are intended toprovide management’s current expectations or plans for our futureoperating and financial performance, based on assumptions currentlybelieved to be valid. Forward-looking statements can be identifiedby the use of words such as “believe,” “expect,”“expectations,” “plans,” “strategy,” “prospects,” “estimate,”“project,” “target,” “anticipate,” “will,” “should,” “see,” “guidance,”“confident” and other words of similar meaning in connection with adiscussion of future operating or financial performance. Forwardlookingstatements may include, among other things, statementsrelating to future sales, earnings, cash flow, results of operations,uses of cash and other measures of financial performance. Allforward-looking statements involve risks, uncertainties and otherfactors that may cause actual results to differ materially from thoseexpressed or implied in the forward-looking statements. For thosestatements we claim the protection of the safe harbor for forwardlookingstatements contained in the U.S. Private Securities LitigationReform Act of 1995. Such risks, uncertainties and otherfactors include, without limitation:• the effect of economic conditions in the markets in which weoperate in the U.S. and globally and any changes therein, includingfinancial market conditions, fluctuations in commodity prices,interest rates and foreign currency exchange rates, levels of endmarket demand in construction and in both the commercial anddefense segments of the aerospace industry, levels of air travel,financial difficulties (including bankruptcy) of commercial airlines,the impact of weather conditions and natural disasters and thefinancial condition of our customers and suppliers;• our ability to integrate the acquired Goodrich operations and torealize synergies and opportunities for growth and innovation;• our ability to realize the intended benefits of recently announcedorganizational changes;• future levels of indebtedness and capital spending and researchand development spending;• future availability of credit and factors that may affect such availability,including credit market conditions and our capital structure;• delays and disruption in delivery of materials and services fromsuppliers;• new business opportunities;• cost reduction efforts and restructuring costs and savings andother consequences thereof;• the scope, nature or impact of other acquisition and divestitureactivity, including integration of acquired businesses into ourexisting businesses;• the development, production, delivery, support, performanceand anticipated benefits of advanced technologies and newproducts and services;• the anticipated benefits of diversification and balance of operationsacross product lines, regions and industries;• the impact of the negotiation of collective bargaining agreementsand labor disputes;• the outcome of legal proceedings and other contingencies;• future repurchases of our common stock;• pension plan assumptions and future contributions; and• the effect of changes in tax, environmental and other laws andregulations or political conditions in the <strong>United</strong> States and othercountries in which we operate.In addition, our <strong>Annual</strong> <strong>Report</strong> on Form 10-K for <strong>2012</strong>includes important information as to risks, uncertainties and otherfactors that may cause actual results to differ materially from thoseexpressed or implied in the forward-looking statements. See the“Notes to Consolidated Financial Statements” under the heading“Contingent Liabilities,” the section titled “Management’s Discussionand Analysis of Financial Condition and Results of Operations”under the headings “Business Overview,” “CriticalAccounting Estimates,” “Results of Operations,” and “Liquidity andFinancial Condition,” and the section titled “Risk Factors.” Our<strong>Annual</strong> <strong>Report</strong> on Form 10-K for <strong>2012</strong> also includes importantinformation as to these factors in the “Business” section under theheadings “General,” “Description of Business by Segment” and“Other Matters Relating to Our Business as a Whole,” and in the“Legal Proceedings” section. Additional important information as tothese factors is included in this <strong>2012</strong> <strong>Annual</strong> <strong>Report</strong> in the sectiontitled “Management’s Discussion and Analysis of Financial Conditionand Results of Operations” under the headings“Environmental Matters” and “Restructuring Costs.” The forwardlookingstatements speak only as of the date of this report or, in thecase of any document incorporated by reference, the date of thatdocument. We undertake no obligation to publicly update or reviseany forward-looking statements, whether as a result of newinformation, future events or otherwise, except as required byapplicable law. Additional information as to factors that may causeactual results to differ materially from those expressed or implied inthe forward-looking statements are disclosed from time to time inour other filings with the SEC.
54 UNITED TECHNOLOGIES CORPORATIONManagement’s <strong>Report</strong> on Internal Controlover Financial <strong>Report</strong>ingThe management of UTC is responsible for establishing and maintainingadequate internal control over financial reporting. Internalcontrol over financial reporting is a process designed to providereasonable assurance regarding the reliability of financial reportingand the preparation of financial statements for external reportingpurposes in accordance with accounting principles generallyaccepted in the <strong>United</strong> States of America. Because of its inherentlimitations, internal control over financial reporting may not preventor detect misstatements. Management has assessed the effectivenessof UTC’s internal control over financial reporting as ofDecember 31, <strong>2012</strong>. In making its assessment, management hasutilized the criteria set forth by the Committee of Sponsoring Organizationsof the Treadway Commission in its Internal Control—Integrated Framework, released in 1992. Management concludedthat based on its assessment, UTC’s internal control over financialreporting was effective as of December 31, <strong>2012</strong>. The effectivenessof UTC’s internal control over financial reporting, as ofDecember 31, <strong>2012</strong>, has been audited by PricewaterhouseCoopersLLP, an independent registered public accounting firm, as stated intheir report which is included herein.Louis R. ChênevertChairman & Chief Executive OfficerGregory J. HayesSenior Vice President and Chief Financial OfficerPeter F. LongoVice President, Controller
<strong>Report</strong> of Independent Registered Public Accounting Firm <strong>2012</strong> ANNUAL REPORT 55<strong>Report</strong> of Independent Registered Public Accounting FirmTO THE BOARD OF DIRECTORS AND SHAREOWNERS OFUNITED TECHNOLOGIES CORPORATION:In our opinion, the accompanying consolidated balance sheets andthe related consolidated statements of operations, of comprehensiveincome, of cash flows and of changes in equity present fairly,in all material respects, the financial position of <strong>United</strong><strong>Technologies</strong> Corporation and its subsidiaries at December 31,<strong>2012</strong> and December 31, 2011, and the results of their operationsand their cash flows for each of the three years in the period endedDecember 31, <strong>2012</strong> in conformity with accounting principles generallyaccepted in the <strong>United</strong> States of America. Also in our opinion,the Corporation maintained, in all material respects, effectiveinternal control over financial reporting as of December 31, <strong>2012</strong>,based on criteria established in Internal Control—IntegratedFramework issued by the Committee of Sponsoring Organizationsof the Treadway Commission (COSO). The Corporation’s managementis responsible for these financial statements, for maintainingeffective internal control over financial reporting and for its assessmentof the effectiveness of internal control over financial reportingincluded in the accompanying Management’s <strong>Report</strong> on InternalControl Over Financial <strong>Report</strong>ing. Our responsibility is to expressopinions on these financial statements and on the Corporation’sinternal control over financial reporting based on our integratedaudits. We conducted our audits in accordance with the standardsof the Public Company Accounting Oversight Board (<strong>United</strong> States).Those standards require that we plan and perform the audits toobtain reasonable assurance about whether the financial statementsare free of material misstatement and whether effectiveinternal control over financial reporting was maintained in allmaterial respects. Our audits of the financial statements includedexamining, on a test basis, evidence supporting the amounts anddisclosures in the financial statements, assessing the accountingprinciples used and significant estimates made by management,and evaluating the overall financial statement presentation. Ouraudit of internal control over financial reporting included obtainingan understanding of internal control over financial reporting,assessing the risk that a material weakness exists, and testing andevaluating the design and operating effectiveness of internal controlbased on the assessed risk. Our audits also included performingsuch other procedures as we considered necessary in the circumstances.We believe that our audits provide a reasonable basis forour opinions.A corporation’s internal control over financial reporting is aprocess designed to provide reasonable assurance regarding thereliability of financial reporting and the preparation of financialstatements for external purposes in accordance with generallyaccepted accounting principles. A corporation’s internal controlover financial reporting includes those policies and procedures that(i) pertain to the maintenance of records that, in reasonable detail,accurately and fairly reflect the transactions and dispositions of theassets of the corporation; (ii) provide reasonable assurance thattransactions are recorded as necessary to permit preparation offinancial statements in accordance with generally acceptedaccounting principles, and that receipts and expenditures of thecorporation are being made only in accordance with authorizationsof management and directors of the corporation; and (iii) providereasonable assurance regarding prevention or timely detection ofunauthorized acquisition, use, or disposition of the corporation’sassets that could have a material effect on the financial statements.Because of its inherent limitations, internal control overfinancial reporting may not prevent or detect misstatements. Also,projections of any evaluation of effectiveness to future periods aresubject to the risk that controls may become inadequate becauseof changes in conditions, or that the degree of compliance with thepolicies or procedures may deteriorate.Hartford, ConnecticutFebruary 7, 2013
56 UNITED TECHNOLOGIES CORPORATIONConsolidated Statement of Operations(DOLLARS IN MILLIONS, EXCEPT PER SHARE AMOUNTS; SHARES IN MILLIONS) <strong>2012</strong> 2011 2010Net Sales:Product sales $ 40,729 $ 38,882 $ 36,615Service sales 16,979 16,872 15,66057,708 55,754 52,275Costs and Expenses:Cost of products sold 31,094 29,252 27,513Cost of services sold 11,059 11,117 10,441Research and development 2,371 1,951 1,656Selling, general and administrative 6,452 6,161 5,79850,976 48,481 45,408Other income, net 952 573 31Operating profit 7,684 7,846 6,898Interest expense, net 773 496 650Income from continuing operations before income taxes 6,911 7,350 6,248Income tax expense 1,711 2,134 1,725Net income from continuing operations 5,200 5,216 4,523Discontinued operations (Note 3):Income from operations 171 255 290Gain on disposal 861 – –Income tax expense (742) (97) (102)Net income from discontinued operations 290 158 188Net income 5,490 5,374 4,711Less: Non-controlling interest in subsidiaries’ earnings 360 395 338Net income attributable to common shareowners $ 5,130 $ 4,979 $ 4,373Net income attributable to common shareowners:Net income from continuing operations $ 4,847 $ 4,831 $ 4,195Net income from discontinued operations $ 283 $ 148 $ 178Earnings Per Share of Common Stock—Basic:Net income from continuing operations $ 5.41 $ 5.41 $ 4.62Net income attributable to common shareowners $ 5.73 $ 5.58 $ 4.82Earnings Per Share of Common Stock—Diluted:Net income from continuing operations $ 5.35 $ 5.33 $ 4.55Net income attributable to common shareowners $ 5.66 $ 5.49 $ 4.74Dividends Per Share of Common Stock $ 2.030 $ 1.865 $ 1.700Weighted average number of shares outstanding:Basic shares 895.2 892.3 907.9Diluted shares 906.6 906.8 922.7See accompanying Notes to Consolidated Financial Statements
Consolidated Financial Statements <strong>2012</strong> ANNUAL REPORT 57Consolidated Statement of Comprehensive Income(DOLLARS IN MILLIONS) <strong>2012</strong> 2011 2010Net income $ 5,490 $ 5,374 $ 4,711Other comprehensive income (loss), net of tax (expense) benefit:Foreign currency translation adjustmentsForeign currency translation adjustments arising during period 556 (278) (39)Less: reclassification adjustments for (gain) loss on sale of an investment in a foreign entity recognized in netincome (100) 115 21456 (163) (18)Change in pension and post-retirement benefit plansNet actuarial loss arising during period (1,542) (2,692) (701)Prior service credit (cost) arising during period 211 (21) (121)Other (3) (9) (3)Less: amortization of actuarial loss, prior service cost and transition obligation 689 441 265(645) (2,281) (560)Tax benefit 205 796 224(440) (1,485) (336)Unrealized (loss) gain on available-for-sale securitiesUnrealized holding gain arising during period 91 78 149Less: reclassification adjustments for (gain) loss included in net income (123) (27) 8(32) 51 157Tax benefit (expense) 13 (21) (61)(19) 30 96Change in unrealized cash flow hedgingUnrealized cash flow hedging gain (loss) arising during period 88 (46) 72Less: gain reclassified into Product sales (31) (96) (119)57 (142) (47)Tax (expense) benefit (4) 36 1853 (106) (29)Other comprehensive income (loss), net of tax (expense) benefit 50 (1,724) (287)Comprehensive income 5,540 3,650 4,424Less: comprehensive income attributable to noncontrolling interest (368) (392) (333)Comprehensive income attributable to common shareowners $ 5,172 $ 3,258 $ 4,091See accompanying Notes to Consolidated Financial Statements
58 UNITED TECHNOLOGIES CORPORATIONConsolidated Balance Sheet(DOLLARS IN MILLIONS, EXCEPT PER SHARE AMOUNTS; SHARES IN THOUSANDS) <strong>2012</strong> 2011AssetsCash and cash equivalents $ 4,819 $ 5,960Accounts receivable (net of allowance for doubtful accounts of $443 and $394) 11,099 9,546Inventories and contracts in progress, net 9,537 7,797Future income tax benefits, current 1,611 1,662Assets held for sale 1,071 –Other assets, current 1,473 793Total Current Assets 29,610 25,758Customer financing assets 1,150 1,035Future income tax benefits 1,599 2,387Fixed assets, net 8,518 6,201Goodwill 27,801 17,943Intangible assets, net 15,189 3,918Other assets 5,542 4,210Total Assets $ 89,409 $ 61,452Liabilities and EquityShort-term borrowings $ 503 $ 630Accounts payable 6,431 5,570Accrued liabilities 15,310 12,287Liabilities held for sale 421 –Long-term debt currently due 1,121 129Total Current Liabilities 23,786 18,616Long-term debt 21,597 9,501Future pension and postretirement benefit obligations 7,520 5,007Other long-term liabilities 9,199 5,150Total Liabilities 62,102 38,274Commitments and contingent liabilities (Notes 5 and 18)Redeemable non-controlling interest 238 358Shareowners’ Equity:Capital Stock:Preferred Stock, $1 par value; 250,000 shares authorized; None issued or outstanding – –Common Stock, $1 par value; 4,000,000 shares authorized; 1,407,780 and 1,400,212 shares issued 13,976 13,445Treasury Stock—488,931 and 492,990 common shares at average cost (19,251) (19,410)Retained earnings 36,776 33,487Unearned ESOP shares (139) (152)Total Accumulated other comprehensive loss (5,448) (5,490)Total Shareowners’ Equity 25,914 21,880Non-controlling interest 1,155 940Total Equity 27,069 22,820Total Liabilities and Equity $ 89,409 $ 61,452See accompanying Notes to Consolidated Financial Statements
Consolidated Financial Statements <strong>2012</strong> ANNUAL REPORT 59Consolidated Statement of Cash Flows(DOLLARS IN MILLIONS) <strong>2012</strong> 2011 2010Operating Activities of Continuing Operations:Net income attributable to common shareowners $ 5,130 $ 4,979 $ 4,373Non-controlling interest in subsidiaries’ earnings 360 395 338Net income 5,490 5,374 4,711Less: Net income from discontinued operations 290 158 188Income from continuing operations 5,200 5,216 4,523Adjustments to reconcile income from continuing operations to net cash flows provided by operating activitiesof continuing operations:Depreciation and amortization 1,524 1,263 1,300Deferred income tax provision 120 334 425Stock compensation cost 210 221 148Change in:Accounts receivable (165) (697) (313)Inventories and contracts in progress (539) (330) (259)Other current assets (4) (24) (20)Accounts payable and accrued liabilities 811 760 1,168Global pension contributions (430) (551) (1,299)Other operating activities, net (122) 268 47Net cash flows provided by operating activities of continuing operations 6,605 6,460 5,720Investing Activities of Continuing Operations:Capital expenditures (1,389) (929) (838)Increase in customer financing assets (100) (42) (219)Decrease in customer financing assets 75 92 162Investments in businesses (16,026) (357) (2,742)Dispositions of businesses 425 494 205Increase in collaboration intangible assets (1,543) – –Other investing activities, net (237) 70 282Net cash flows used in investing activities of continuing operations (18,795) (672) (3,150)Financing Activities of Continuing Operations:Issuance of long-term debt 10,899 59 2,362Repayment of long-term debt (842) (616) (1,751)(Decrease) increase in short-term borrowings, net (214) 562 (141)Common Stock issued under employee stock plans 522 226 386Dividends paid on Common Stock (1,752) (1,602) (1,482)Repurchase of Common Stock – (2,175) (2,200)Other financing activities, net (592) (437) (314)Net cash flows provided by (used in) financing activities of continuing operations 8,021 (3,983) (3,140)Discontinued Operations:Net cash provided by operating activities 41 130 186Net cash provided by (used in) investing activities 2,974 (35) (37)Net cash used in financing activities – (22) (13)Net cash flows provided by discontinued operations 3,015 73 136Effect of foreign exchange rate changes on cash and cash equivalents 30 (1) 68Net (decrease) increase in cash and cash equivalents (1,124) 1,877 (366)Cash and cash equivalents, beginning of year 5,960 4,083 4,449Cash and cash equivalents, end of year 4,836 5,960 4,083Less: Cash and cash equivalents of businesses held for sale 17 – –Cash and cash equivalents of continuing operations, end of year $ 4,819 $ 5,960 $ 4,083Supplemental Disclosure of Cash Flow Information:Interest paid, net of amounts capitalized $ 725 $ 642 $ 753Income taxes paid, net of refunds $ 1,772 $ 1,432 $ 1,222Non-cash investing and financing activities include:Contributions of UTC Common Stock to domestic defined benefit pension plans $ – $ 450 $ 250See accompanying Notes to Consolidated Financial Statements
60 UNITED TECHNOLOGIES CORPORATIONConsolidated Statement of Changes In Equity(DOLLARS IN MILLIONS) Common Stock Treasury StockBalance at December 31, 2009 $ 11,746 $ (15,408)Comprehensive income (loss):Net incomeRedeemable non-controlling interest in subsidiaries’ earningsOther comprehensive income (loss), net of taxCommon Stock issued under employee plans (11.8 million shares), net of tax benefit of $94 746 7Common Stock contributed to defined benefit pension plans (3.8 million shares) 117 133Common Stock repurchased (31.0 million shares) (2,200)Dividends on Common StockDividends on ESOP Common StockDividends attributable to non-controlling interestRedeemable non-controlling interest accretionPurchase of subsidiary shares from non-controlling interest (12)Sale of subsidiary shares in non-controlling interestOther changes in non-controlling interestBalance at December 31, 2010 $ 12,597 $ (17,468)Comprehensive income (loss):Net incomeRedeemable non-controlling interest in subsidiaries’ earningsOther comprehensive income (loss), net of taxCommon Stock issued under employee plans (7.2 million shares), net of tax benefit of $81 672 10Common Stock contributed to defined benefit pension plans (5.7 million shares) 227 223Common Stock repurchased (26.9 million shares) (2,175)Dividends on Common StockDividends on ESOP Common StockDividends attributable to non-controlling interestRedeemable non-controlling interest accretionPurchase of subsidiary shares from non-controlling interest (54)Sale of subsidiary shares in non-controlling interest 3Other changes in non-controlling interestBalance at December 31, 2011 $ 13,445 $ (19,410)Comprehensive income (loss):Net incomeRedeemable non-controlling interest in subsidiaries’ earningsOther comprehensive income (loss), net of taxCommon Stock issued under employee plans (8.0 million shares), net of tax benefit of $67 643 18Treasury Stock reissued under employee plans (3.6 million shares) 138 141Equity Units issuance (216)Dividends on Common StockDividends on ESOP Common StockDividends attributable to non-controlling interestRedeemable non-controlling interest accretionPurchase of subsidiary shares from non-controlling interest (34)Sale of subsidiary shares in non-controlling interestOther changes in non-controlling interestRedeemable non-controlling interest reclassification to non-controlling interestBalance at December 31, <strong>2012</strong> $ 13,976 $ (19,251)See accompanying Notes to Consolidated Financial Statements
Consolidated Financial Statements <strong>2012</strong> ANNUAL REPORT 61Shareowners’ EquityAccumulated OtherRetained EarningsUnearned ESOP SharesComprehensiveIncome (Loss) Non-controlling Interest Total EquityRedeemableNon-controlling Interest$ 27,396 $ (181) $ (3,487) $ 933 $ 20,999 $ 3894,373 338 4,711(24) (24) 24(282) (282) (5)(43) 15 725250(2,200)(1,482) (1,482)(62) (62)(338) (338) (19)9 9 (9)(12) (24) (65)38 3812 12 2$ 30,191 $ (166) $ (3,769) $ 947 $ 22,332 $ 3174,979 395 5,374(25) (25) 25(1,721) (6) (1,727) 3(9) 14 687450(2,175)(1,602) (1,602)(63) (63)(363) (363) (15)(9) (9) 9(19) (73) (2)23 26(12) (12) 21$ 33,487 $ (152) $ (5,490) $ 940 $ 22,820 $ 3585,130 360 5,490(24) (24) 2442 2 44 6(20) 13 654279(216)(1,752) (1,752)(67) (67)(337) (337) (18)(2) (2) 2(4) (38) (34)52 5266 66100 100 (100)$ 36,776 $ (139) $ (5,448) $ 1,155 $ 27,069 $ 238
62 UNITED TECHNOLOGIES CORPORATIONNotes to Consolidated Financial StatementsNOTE 1: SUMMARY OF ACCOUNTING PRINCIPLESThe preparation of financial statements requires management tomake estimates and assumptions that affect the reported amountsof assets, liabilities, revenues and expenses. Actual results coulddiffer from those estimates. Certain reclassifications have beenmade to the prior year amounts to conform to the current yearpresentation. On September 28, 2011, we announced a neworganizational structure that allows us to better serve customersthrough greater integration across product lines. Effective January1, <strong>2012</strong>, we formed the UTC Climate, Controls & Securitysegment which combines the former Carrier and UTC Fire & Securitysegments. On July 26, <strong>2012</strong> we acquired Goodrich Corporation(Goodrich). As a result of the acquisition, Goodrich became awholly-owned subsidiary of UTC. The acquired Goodrich businessand legacy Hamilton Sundstrand business have been combined toform a new segment named UTC Aerospace Systems. This segmentand our Pratt & Whitney segment are separately reportablesegments, although they are both included within the newly formedUTC Propulsion & Aerospace Systems organizational structure. In<strong>2012</strong>, UTC’s Board of Directors approved plans for the divestitureof a number of non-core businesses to help fund the Goodrichacquisition. The results of operations, including any realized gainsand realized or expected losses on disposition and the related cashflows, which result from these non-core businesses have beenreclassified to Discontinued Operations in our Consolidated Statementof Operations and Consolidated Statement of Cash Flows forall periods presented. See Note 3 for further discussion.Consolidation. The Consolidated Financial Statementsinclude the accounts of <strong>United</strong> <strong>Technologies</strong> Corporation (UTC) andits controlled subsidiaries. Intercompany transactions have beeneliminated.Cash and Cash Equivalents. Cash and cash equivalentsincludes cash on hand, demand deposits and short-term cashinvestments that are highly liquid in nature and have original maturitiesof three months or less.On occasion, we are required to maintain cash depositswith certain banks with respect to contractual obligations related toacquisitions or divestitures or other legal obligations. As ofDecember 31, <strong>2012</strong> and 2011, the amount of such restricted cashwas approximately $35 million and $37 million, respectively and isincluded in Other assets, current.Accounts Receivable. Current and long-term accountsreceivable include retainage of $172 million and $154 million andunbilled receivables of $1,363 million and $1,060 million as ofDecember 31, <strong>2012</strong> and 2011, respectively.Retainage represents amounts that, pursuant to the applicablecontract, are not due until project completion and acceptanceby the customer. Unbilled receivables represent revenues thatare not currently billable to the customer under the terms of thecontract. These items are expected to be collected in the normalcourse of business. Long-term accounts receivable are included inOther assets in the Consolidated Balance Sheet.Marketable Equity Securities. Equity securities that havea readily determinable fair value and that we do not intend to tradeare classified as available-for-sale and carried at fair value. Unrealizedholding gains and losses are recorded as a separate componentof shareowners’ equity, net of deferred income taxes.Inventories and Contracts in Progress. Inventories andcontracts in progress are stated at the lower of cost or estimatedrealizable value and are primarily based on first-in, first-out (FIFO) oraverage cost methods; however, certain UTC Aerospace Systemsand UTC Climate, Controls & Security entities use the last-in, firstout(LIFO) method. If inventories that were valued using the LIFOmethod had been valued under the FIFO method, they would havebeen higher by $139 million and $144 million at December 31,<strong>2012</strong> and 2011, respectively.Costs accumulated against specific contracts or orders areat actual cost. Inventory in excess of requirements for contractsand current or anticipated orders have been reserved as appropriate.Manufacturing costs are allocated to current production andfirm contracts.Fixed Assets. Fixed assets are stated at cost. Depreciationis recorded over the fixed assets’ useful lives using the straightlinemethod.Goodwill and Intangible Assets. Goodwill representscosts in excess of fair values assigned to the underlying net assetsof acquired businesses. Goodwill and intangible assets deemed tohave indefinite lives are not amortized. Goodwill and indefinite-livedintangible assets are subject to annual impairment testing using theguidance and criteria described in the FASB ASC Topic“Intangibles—Goodwill and Other.” This testing compares carryingvalues to fair values and, when appropriate, the carrying value ofthese assets is reduced to fair value. During <strong>2012</strong> weearly-adopted the FASB Accounting Standards Update (ASU)No. <strong>2012</strong>-02, “Testing Indefinite-Lived Intangible Assets for Impairment”in connection with the performance of our annual goodwilland indefinite-lived intangible assets impairment test. This ASUintends to align impairment testing guidance among indefinite-livedasset categories. This ASU allows an assessment based on qualitativefactors to determine whether it is more likely than not that anindefinite-lived intangible asset is impaired prior to determiningwhether it is necessary to perform the quantitative impairment testin accordance with FASB ASC Subtopic 350-30, “Intangibles—Goodwill and Other—General Intangibles Other than Goodwill.”During <strong>2012</strong>, we recorded pre-tax goodwill impairment charges ofapproximately $360 million and $590 million related to Pratt &Whitney Rocketdyne (Rocketdyne) and Clipper Windpower(Clipper), respectively. The goodwill impairment charges result fromthe decision to dispose of both Rocketdyne and Clipper within arelatively short period after acquiring the businesses.
Notes to Consolidated Financial Statements <strong>2012</strong> ANNUAL REPORT 63Consequently, there has not been sufficient opportunity for thelong-term operations to recover the value implicit in goodwill at theinitial date of acquisition. During 2011 and 2010, we did not recordany significant impairments to the carrying value of goodwill orindefinite-lived intangible assets.Intangible assets consist of service portfolios, patents,trademarks/tradenames, customer relationships and other intangibleassets including a collaboration asset established in connection withthe restructuring of IAE International Aero Engines AG (IAE) as discussedfurther in Note 2. Also included within other intangible assetsare commercial aerospace payments made to secure certain contractualrights to provide product on new aircraft platforms. Paymentsmade on these contractual commitments are to be amortizedas the related OEM and Aftermarket units are delivered.Useful lives of finite-lived intangible assets are estimatedbased upon the nature of the intangible asset and the industry inwhich the intangible asset is used. These intangible assets are amortizedbased on the pattern in which the economic benefits of theintangible assets are consumed. For both our commercial aerospacecollaboration assets and exclusivity arrangements, the patternof economic benefit generally results in lower amortization during thedevelopment period with increasing amortization as programs enterfull rate production and aftermarket cycles. If a pattern of economicbenefit cannot be reliably determined, a straight-line amortizationmethod is used. The range of estimated useful lives is as follows:Collaboration assetCustomer relationships and related programsPurchased service contractsPatents & trademarksExclusivity assets30 years2 to 32 years5 to 30 years3 to 40 years3 to 25 yearsOther Long-Lived Assets. We evaluate the potentialimpairment of other long-lived assets when appropriate. If the carryingvalue of other long-lived assets exceeds the sum of the undiscountedexpected future cash flows, the carrying value is writtendown to fair value. During the years ended December 31, <strong>2012</strong> and2011, we had certain non-recurring fair value measurements resultingin impairment charges of $168 million and $66 million,respectively. See Note 14. Additionally, in <strong>2012</strong> we recorded pretaxnet asset impairment charges of approximately $179 millionrelated to UTC Power in discontinued operations. The impairmentcharge at UTC Power results from the disposition of the businessbefore the benefits of technology investments were fully realized.Income Taxes. In the ordinary course of business there isinherent uncertainty in quantifying our income tax positions. Weassess our income tax positions and record tax benefits for all yearssubject to examination based upon management’s evaluation of thefacts, circumstances, and information available at the reportingdate. For those tax positions where it is more-likely-than-not that atax benefit will be sustained, we have recorded the largest amountof tax benefit with a greater than 50% likelihood of being realizedupon ultimate settlement with a taxing authority that has full knowledgeof all relevant information. For those income tax positionswhere it is not more-likely-than-not that a tax benefit will be sustained,no tax benefit has been recognized in the financial statements.Where applicable, associated interest expense has alsobeen recognized. We recognize accrued interest related tounrecognized tax benefits in interest expense. Penalties, if incurred,would be recognized as a component of income tax expense.Revenue Recognition. Sales under government andcommercial fixed-price contracts and government fixed-priceincentivecontracts are recorded at the time deliveries are made or,in some cases, on a percentage-of-completion basis. Sales undercost-reimbursement contracts are recorded as work is performed.Sales for elevators, escalators, installation and modernization contractsare accounted for under the percentage-of-completionmethod.Losses, if any, on long-term contracts are provided forwhen anticipated. Loss provisions on original equipment contractsare recognized to the extent that estimated inventoriable manufacturing,engineering, product warranty and product performanceguarantee costs, as appropriate, exceed the projected revenuefrom the products contemplated under the contractual arrangement.For new commitments, we generally record loss provisions atthe earlier of contract announcement or contract signing except forcertain requirements contracts under which losses are recordedupon receipt of the purchase order. For existing commitments,anticipated losses on contracts are recognized in the period inwhich losses become evident. Products contemplated under contractualarrangement include products purchased under contractand, in the large commercial engine and wheels and brakes businesses,future highly probable sales of replacement parts requiredby regulation that are expected to be purchased subsequently forincorporation into the original equipment. Revenue projections usedin determining contract loss provisions are based upon estimates ofthe quantity, pricing and timing of future product deliveries. Lossesare generally recognized on shipment to the extent thatinventoriable manufacturing costs, estimated warranty costs andproduct performance guarantee costs, as appropriate, exceedrevenue realized. Contract accounting requires estimates of futurecosts over the performance period of the contract as well as estimatesof award fees and other sources of revenue. These estimatesare subject to change and result in adjustments to margins on contractsin progress. The extent of progress toward completion on ourlong-term commercial aerospace equipment and helicopter contractsis measured using units of delivery. In addition, we use thecost-to-cost method for elevator and escalator sales, installationand modernization contracts in the commercial businesses. Forlong-term aftermarket contracts, revenue is recognized over thecontract period in proportion to the costs expected to be incurredin performing services under the contract. We review our cost esti-
64 UNITED TECHNOLOGIES CORPORATIONmates on significant contracts on a quarterly basis, and for others, noless frequently than annually or when circumstances change andwarrant a modification to a previous estimate. We record changes incontract estimates using the cumulative catch-up method in accordancewith the Revenue Recognition Topic of the FASB ASC. In <strong>2012</strong>,we recorded a $157 million charge on the CH-148 Canadian MaritimeHelicopter program resulting from ongoing program delays.Service sales, representing aftermarket repair and maintenanceactivities, are recognized over the contractual period or asservices are performed. In the commercial businesses, revenue isgenerally recognized on a straight-line basis. In the aerospacebusinesses, revenue is generally recognized in proportion to cost.Sales generated from engine programs, spare parts sales,and aftermarket business under collaboration arrangements arerecorded as earned in our financial statements. Amounts attributableto our collaborators for their share of revenues are recorded asan expense in our financial statements based upon the terms andnature of the arrangement. Costs associated with engine programsunder collaborative arrangements are expensed as incurred. Underthese arrangements, collaborators contribute their program share ofengine parts, incur their own production costs and make certainpayments to Pratt & Whitney for shared or joint program costs. Thereimbursement of a collaborator’s share of program costs isrecorded as a reduction of the related expense item at that time.UTC Climate, Controls & Security customarily offers itscustomers incentives to purchase products to ensure an adequatesupply of its products in the distribution channels. The principalincentive program provides reimbursements to distributors for offeringpromotional pricing for our products. We account for incentivepayments made as a reduction in sales.Research and Development. Research and developmentcosts not specifically covered by contracts and those related to thecompany sponsored share of research and development activity inconnection with cost-sharing arrangements are charged to expenseas incurred. Government research and development support, notassociated with specific contracts, is recorded as a reduction toresearch and development expense in the period earned. Repayment,if any, is in the form of future royalties and is conditionedupon the achievement of certain financial targets including specificaircraft engine sales, total aircraft engine sales volume and totalyear-over-year sales growth of the entity receiving the governmentfunding. Given the conditional and uncertain nature of any repaymentobligations, royalty expense is typically recorded only uponengine shipment or is otherwise accrued monthly based upon theforecasted impact for the current year. The cumulative fundingreceived under existing relationships has been approximately $2.0billion of which approximately $450 million has been repaid to datein the form of royalties.Research and development costs incurred under contractswith customers are included as a contract cost and reported as acomponent of cost of products sold when revenue from such contractsis recognized. Research and development costs in excess ofcontractual consideration is expensed as incurred.Foreign Exchange and Hedging Activity. We conductbusiness in many different currencies and, accordingly, are subjectto the inherent risks associated with foreign exchange rate movements.The financial position and results of operations of substantiallyall of our foreign subsidiaries are measured using the localcurrency as the functional currency. Foreign currency denominatedassets and liabilities are translated into U.S. Dollars at the exchangerates existing at the respective balance sheet dates, and incomeand expense items are translated at the average exchange ratesduring the respective periods. The aggregate effects of translatingthe balance sheets of these subsidiaries are deferred as a separatecomponent of shareowners’ equity.We have used derivative instruments, including swaps,forward contracts and options, to help manage certain foreign currency,interest rate and commodity price exposures. Derivativeinstruments are viewed as risk management tools by us and are notused for trading or speculative purposes. Derivatives used for hedgingpurposes may be designated and effective as a hedge of theidentified risk exposure at the inception of the contract.All derivative instruments are recorded on the balancesheet at fair value. Derivatives used to hedge foreign-currencydenominatedbalance sheet items are reported directly in earningsalong with offsetting transaction gains and losses on the itemsbeing hedged. Derivatives used to hedge forecasted cash flowsassociated with foreign currency commitments or forecastedcommodity purchases may be accounted for as cash flow hedges,as deemed appropriate. Gains and losses on derivatives designatedas cash flow hedges are recorded in other comprehensive incomeand reclassified to earnings in a manner that matches the timing ofthe earnings impact of the hedged transactions. The ineffectiveportion of all hedges, if any, is recognized currently in earnings.Additional information pertaining to foreign currency forwardcontracts is included in Note 14.Environmental. Environmental investigatory, remediation,operating and maintenance costs are accrued when it is probablethat a liability has been incurred and the amount can be reasonablyestimated. The most likely cost to be incurred is accrued based onan evaluation of currently available facts with respect to eachindividual site, including existing technology, current laws and regulationsand prior remediation experience. Where no amount within arange of estimates is more likely, the minimum is accrued. For siteswith multiple responsible parties, we consider our likely proportionateshare of the anticipated remediation costs and the ability ofthe other parties to fulfill their obligations in establishing a provisionfor those costs. Liabilities with fixed or reliably determinable futurecash payments are discounted. Accrued environmental liabilities arenot reduced by potential insurance reimbursements.
Notes to Consolidated Financial Statements <strong>2012</strong> ANNUAL REPORT 65Asset Retirement Obligations. We record the fair valueof legal obligations associated with the retirement of tangible longlivedassets in the period in which it is determined to exist, if a reasonableestimate of fair value can be made. Upon initial recognitionof a liability, we capitalize the cost of the asset retirement obligationby increasing the carrying amount of the related long-lived asset.Over time, the liability is increased for changes in its present valueand the capitalized cost is depreciated over the useful life of therelated asset. We have determined that conditional legal obligationsexist for certain of our worldwide owned and leased facilities relatedprimarily to building materials. As of December 31, <strong>2012</strong> and 2011,the outstanding liability for asset retirement obligations was $174million and $164 million, respectively.Pension and Postretirement Obligations. Guidanceunder the FASB ASC Topic Compensation—Retirement Benefitsrequires balance sheet recognition of the overfunded or underfundedstatus of pension and postretirement benefit plans. Underthis guidance, actuarial gains and losses, prior service costs orcredits, and any remaining transition assets or obligations that havenot been recognized under previous accounting standards must berecognized in other comprehensive income, net of tax effects, untilthey are amortized as a component of net periodic benefit cost.NOTE 2: BUSINESS ACQUISITIONS, DISPOSITIONS, GOODWILLAND INTANGIBLE ASSETSBusiness Acquisitions and Dispositions. Our investments inbusinesses in <strong>2012</strong>, 2011 and 2010 totaled $18.6 billion (includingdebt assumed of $2.6 billion), $372 million (including debt assumedof $15 million) and $2.8 billion (including debt assumed of $39million), respectively.On July 26, <strong>2012</strong>, we completed the acquisition of Goodrich,a global supplier of systems and services to the aerospaceand defense industry with 2011 sales of $8.1 billion. Goodrichproducts include aircraft nacelles and interior, actuation, landingand electronic systems. Under the terms of the agreement, Goodrichshareholders received $127.50 in cash for each share of Goodrichcommon stock they owned on July 26, <strong>2012</strong>. This equated to atotal enterprise value of $18.3 billion, including $1.9 billion in netdebt assumed. The acquired Goodrich businesses were combinedwith the legacy Hamilton Sundstrand businesses to form the newUTC Aerospace Systems segment. The Goodrich acquisition andthe formation of UTC Aerospace Systems provide increased scale,financial strength and complementary product offerings, allowing usto significantly strengthen our position in the aerospace anddefense industry, create aftermarket efficiencies for our customers,accelerate our ability to drive innovation within the aerospaceindustry, and enhance our ability to support our customers withmore integrated systems. This acquisition, coupled with our acquisitionof an additional interest in IAE, as discussed below, furtheradvances UTC’s strategy of focusing on our core businesses.To finance the cash consideration for the Goodrich acquisitionand pay related fees, expenses and other amounts due andpayable, we utilized the previously disclosed net proceeds ofapproximately $9.6 billion from the $9.8 billion of long-term notesissued on June 1, <strong>2012</strong>, the net proceeds of approximately $1.1billion from the equity units issued on June 18, <strong>2012</strong>, $3.2 billionfrom the issuance of commercial paper during July <strong>2012</strong>, and $2.0billion of proceeds borrowed under our April 24, <strong>2012</strong> term loancredit agreement. For the remainder of the cash consideration, weutilized approximately $0.5 billion of cash and cash equivalentsgenerated from operating activities.
66 UNITED TECHNOLOGIES CORPORATIONPreliminary Allocation of Consideration Transferred to NetAssets Acquired:The following amounts represent the preliminary determinationof the fair value of identifiable assets acquired and liabilitiesassumed from the Goodrich acquisition. The final determination ofthe fair value of certain assets and liabilities will be completed withinthe one year measurement period from the date of acquisition asrequired by the FASB ASC Topic 805, “Business Combinations”.The size and breadth of the Goodrich acquisition will necessitatethe use of this measurement period to adequately analyze andassess a number of the factors used in establishing the asset andliability fair values as of the acquisition date including the significantcontractual and operational factors underlying the customerrelationship intangible asset; the final negotiated sales values forbusinesses that are required to be sold as part of the regulatoryapproval of the Goodrich acquisition; the assumptions underpinningcertain reserves such as those for environmental obligations, andthe related tax impacts of any changes made. Any potentialadjustments made could be material in relation to the preliminaryvalues presented below:(DOLLARS IN MILLIONS)Cash and cash equivalents $ 538Accounts receivable, net 1,182Inventories and contracts in progress, net 1,729Future income tax benefits, current 280Other assets, current 574Fixed assets 2,342Intangible assets:Customer relationships and related program assets 8,550Trademarks 1,550Other assets 1,831Short-term borrowings (83)Accounts payable (443)Accrued liabilities (2,242)Long-term debt (2,961)Future pension and postretirement benefit obligations (1,745)Other long-term liabilities:Customer contractual obligations (2,050)Other long-term liabilities (3,758)Non-controlling interests (41)Total identifiable net assets 5,253Goodwill 11,167Total consideration transferred $ 16,420In order to allocate the consideration transferred for Goodrich,the fair values of all identifiable assets and liabilities needed tobe established. For accounting and financial reporting purposes,fair value is defined under FASB ASC Topic 820, “Fair Value Measurementsand Disclosures” as the price that would be receivedupon sale of an asset or the amount paid to transfer a liability in anorderly transaction between market participants at the measurementdate. Market participants are assumed to be buyers and sellersin the principal (most advantageous) market for the asset orliability. Additionally, fair value measurements for an asset assumethe highest and best use of that asset by market participants. Useof different estimates and judgments could yield different results.In determining the fair value of identifiable assets acquiredand liabilities assumed, a review was conducted for any significantcontingent assets or liabilities existing as of the acquisition date.The preliminary assessment did not note any significant contingenciesrelated to existing legal or government action. Basedupon our existing practices and phase II environmental assessmentsdone on a number of Goodrich sites, we determined thatenvironmental liability obligations of $232 million were assumed inconnection with the acquisition.The fair values of the customer relationship and relatedprogram intangible assets, which include the related aerospaceprogram OEM and aftermarket cash flows, were determined byusing an “income approach” which is the most common valuationapproach utilized. Under this approach, the net earnings attributableto the asset or liability being measured are isolated using thediscounted projected net cash flows. These projected cash flowsare isolated from the projected cash flows of the combined assetgroup over the remaining economic life of the intangible asset orliability being measured. Both the amount and the duration of thecash flows are considered from a market participant perspective.Our estimates of market participant net cash flows considered historicaland projected pricing, remaining developmental effort,operational performance including company specific synergies,aftermarket retention, product life cycles, material and labor pricing,and other relevant customer, contractual and market factors.Where appropriate, the net cash flows are probability-adjusted toreflect the uncertainties associated with the underlying assumptions,as well as the risk profile of the net cash flows utilized in thevaluation. The probability-adjusted future cash flows are then discountedto present value using an appropriate discount rate. Thecustomer relationship and related program intangible assets arebeing amortized on a straight-line basis (which approximates theeconomic pattern of benefits) over the estimated economic life oftheunderlyingprogramsof10to25years.We also identified customer contractual obligations oncertain original equipment manufacturing (OEM) development programswhere the expected costs exceed the expected revenueunder contract. We measured these liabilities under the measurementprovisions of FASB ASC Topic 820, “Fair Value Measurementsand Disclosures”, which is based on the price to transfer theobligation to a market participant at the measurement date, assumingthat the liability will remain outstanding in the marketplace.Based on the estimated net cash outflows of the OEM developmentalprograms plus a reasonable contracting profit marginrequired to transfer the contracts to market participants, werecorded assumed liabilities of approximately $2 billion. These
Notes to Consolidated Financial Statements <strong>2012</strong> ANNUAL REPORT 67liabilities will be liquidated in accordance with the underlying economicpattern of obligations, as reflected by the net cash outflowsincurred on the OEM contracts. Total consumption of the contractualobligation for the next five years is expected to be as follows:$283 million in 2013, $292 million in 2014, $221 million in2015, $236 million in 2016, and $220 million in 2017.Goodrich had not recorded an income tax liability on theunremitted earnings of its non-U.S. subsidiaries, which wereapproximately $853 million as of December 31, 2011. In connectionwith the Goodrich acquisition, UTC has made a determination torepatriate certain of these unremitted earnings, making suchamounts subject to both U.S. and non-U.S. income taxes. Accordingly,an income tax liability of $219 million was recorded in purchaseaccounting for the unremitted earnings no longer consideredpermanently reinvested.In accordance with conditions imposed for regulatoryapproval the Goodrich acquisition, UTC must dispose of the electricpower systems and pumps and engine controls businesses ofGoodrich. These businesses have been held separate from UTC’sand Goodrich’s ongoing businesses pursuant to regulatory obligations.On October 16, <strong>2012</strong>, we announced an agreement to sellthe electric power systems business for $400 million to Safran S.A.,and on January 18, 2013, we announced an agreement to sell thepumps and engine controls business to Triumph Group, Inc. Theclosings of both sales are expected by the end of the first quarter of2013 and are subject to regulatory approvals and other customaryclosing conditions.Pre-Existing Relationships:Our Pratt & Whitney division entered into a preferredsupplier contract in 2010 with Goodrich for the development andsubsequent production of nacelles for the PW1500G (BombardierC Series) and PW1200G (Mitsubishi Regional Jet). That preferredsupplier contract replaced previous contracts and preliminaryMemorandum of Understandings entered into in 2006 and 2008.Under the 2010 agreement, Pratt & Whitney agreed to fund Goodrich’snon-recurring development effort and established a recurringprice for the production nacelles. Prior to the date of the Goodrichacquisition, Pratt & Whitney and Goodrich had asserted claimsagainst each other in a contractual dispute and would have ultimatelyarbitrated the matter were it not for the acquisition. Inaccordance with FASB ASC Topic 805, “Business Combinations”,pre-existing relationships must be effectively settled at acquisitionas the relationships become intercompany relationships uponacquisition and are eliminated in the post-combination financialstatements. Any resulting settlement gains or losses should bemeasured at fair value and recorded on the acquisition date.Accordingly, a $46 million gain was recorded in other income byPratt & Whitney in <strong>2012</strong> based upon a third party determinationof the probability-weighted outcome had the matter gone toarbitration.Acquisition-Related Costs:Acquisition-related costs have been expensed as incurred.In <strong>2012</strong> and 2011, approximately $95 million and $84 million,respectively, of transaction costs (including integration costs) havebeen incurred in addition to approximately $67 million of restructuringcosts, including exit costs in connection with the acquisition(see additional discussion in Note 13). In connection with the financingof the Goodrich acquisition, approximately $199 million in interestcosts have been recorded in <strong>2012</strong>.Under Goodrich’s pre-existing management continuityarrangements (MCAs), we assumed change-in-control obligationsrelated to certain executives at Goodrich. We evaluated thechange-in-control provisions governed by the MCAs and for certainof the executives, we determined that we had assumed liabilities ofapproximately $74 million as the benefit payments were effectivelysingle trigger arrangements in substance. We measured theassumed liability based on fair value concepts of FASB ASC Topic820, “Fair Value Measurements”, using weighted average techniquesof possible outcomes of the employees electing to receivesuch benefits. We expensed approximately $12 million for MCAswhereweamendedthetermoftheMCAsbeyondtheoriginalexpiration date for certain executives.Supplemental Pro-Forma Data:Goodrich’s results of operations have been included inUTC’s financial statements for the period subsequent to the completionof the acquisition on July 26, <strong>2012</strong>. Goodrich contributedsales of approximately $3.6 billion and operating profit of approximately$245 million for the period from the completion of theacquisition through December 31, <strong>2012</strong>. The following unauditedsupplemental pro-forma data presents consolidated information asif the acquisition had been completed on January 1, 2011. The proformaresults were calculated by combining the results of UTC withthe stand-alone results of Goodrich for the pre-acquisition periods,which were adjusted to account for certain costs which would havebeen incurred during this pre-acquisition period:(DOLLARS IN MILLIONS, EXCEPT PER SHARE AMOUNTS) <strong>2012</strong> 2011Net sales $ 62,173 $ 63,233Net income attributable to common shareownersfrom continuing operations 5,095 4,969Basic earnings per share of common stock fromcontinuing operations 5.69 5.57Diluted earnings per share of common stock fromcontinuing operations 5.62 5.48
68 UNITED TECHNOLOGIES CORPORATIONThe unaudited supplemental pro-forma data aboveincludes the following significant adjustments made to account forcertain costs which would have been incurred if the acquisition hadbeen completed on January 1, 2011, as adjusted for the applicabletax impact. As the Goodrich acquisition was completed on July 26,<strong>2012</strong>, the pro-forma adjustments for <strong>2012</strong> and 2011 in the tablebelow only include the required adjustments through July 26, <strong>2012</strong>:(DOLLARS IN MILLIONS) <strong>2012</strong> 2011Amortization of inventory fair value adjustment 1 $ (103) $ 103Amortization of acquired Goodrich intangible assets, net 2 108 184Utilization of contractual customer obligation 3 (96) (200)UTC/Goodrich fees for advisory, legal, accountingservices 4 – 196Interest expense incurred on acquisition financing, net 5 63 1751 Added the expense for inventory fair value adjustments which would have beenamortized as the corresponding inventory would have been completely sold duringthe first two quarters of 2011, and removed the corresponding expense recognizedduring the last two quarters of <strong>2012</strong>.2 Added the additional amortization of the acquired Goodrich intangible assetsrecognized at fair value in purchase accounting and eliminated the historicalGoodrich intangible asset amortization expense.3 Added the additional utilization of the Goodrich contractual customer obligationrecognized in purchase accounting.4 Added the UTC/Goodrich fees that were incurred in connection with the acquisitionof Goodrich to the first quarter of 2011.5 Added the additional interest expense for the debt incurred to finance our acquisitionof Goodrich and reduced interest expense for the debt fair value adjustmentwhich would have been amortized.The unaudited supplemental pro-forma financial informationdoes not reflect the potential realization of cost savings relating tothe integration of the two companies. Further, the pro-forma datashould not be considered indicative of the results that would haveoccurred if the acquisition and related financing been consummatedon January 1, 2011, nor are they indicative of futureresults.Other Acquisition and Disposition Activity:In <strong>2012</strong>, UTC approved plans for the divestiture of a numberof non-core businesses. Cash generated from these divestituresis intended to be used to repay debt incurred to finance theGoodrich acquisition. See Note 3 for further discussion.On June 29, <strong>2012</strong>, Pratt & Whitney, Rolls-Royce plc (Rolls-Royce), MTU Aero Engines AG (MTU), and Japanese Aero EnginesCorporation (JAEC), participants in the IAE collaboration, completeda restructuring of their interests in IAE. Under the terms of theagreement, Rolls-Royce sold its ownership and collaboration interestsin IAE to Pratt & Whitney, while also entering into an agreementto license its V2500 intellectual property to Pratt & Whitney. Inexchange for the increased ownership and collaboration interestsand intellectual property license, Pratt & Whitney paid Rolls-Royce$1.5 billion at closing with additional payments due to Rolls-Royceduring the fifteen year period following closing of the purchase,conditional upon each hour flown by V2500-powered aircraft inservice at the closing. The collaboration interest and intellectualproperty licenses are reflected as intangible assets and will beamortized in relation to the economic benefits received over theremaining estimated 30 year life of the V2500 program. Rolls-Roycewill continue to support the program as a strategic supplier for theV2500 engine and continue to manufacture parts and assembleengines. Pratt & Whitney entered into a collaboration arrangementwith MTU with respect to a portion of the acquired collaborationinterest in IAE for consideration of approximately $233 million withadditional payments due to Pratt & Whitney in the future. As a resultof these transactions, Pratt & Whitney holds a 61% net interest inthe collaboration and a 49.5% ownership interest in IAE. IAE’sbusiness purpose is to coordinate the design, development, manufacturingand product support of the V2500 program throughinvolvement with the collaborators. IAE retains limited equity withthe primary economics of the V2500 program passed to the participantsin the separate collaboration arrangement. As such, IAE wasdetermined to be a variable interest entity (VIE), and Pratt & Whitneyits primary beneficiary under the criteria established in the FASBASC Topic “Consolidations” and has, therefore, been consolidatedpost-transaction. The consolidation of IAE resulted in a gain of $21million recognized during the second quarter of <strong>2012</strong> on the remeasurementto fair value of our previously held equity interest. Thecarrying amounts and classification of assets and liabilities for IAE inour Consolidated Balance Sheet as of December 31, <strong>2012</strong> are asfollows:(DOLLARS IN MILLIONS)Current assets $ 1,308Noncurrent assets 899Total assets $ 2,207Current liabilities $ 1,468Noncurrent liabilities 781Total liabilities $ 2,249UTC Climate, Controls & Security continued its portfoliotransformation efforts in <strong>2012</strong> with the completed and pendingdisposition of a number of businesses resulting in impairment andother charges totaling approximately $180 million. UTC Climate,Controls & Security also sold a controlling interest in a manufacturingand distribution joint venture in Asia generating a gain of approximately$215 million, and a controlling interest in a Canadiandistribution business generating a gain of approximately $120million.In November 2011, UTC Climate, Controls & Securityformed a venture controlled by Midea Group of China (Midea) forthe manufacture and distribution of heating, ventilating, and airconditioning(HVAC) products in Brazil, Argentina, and Chile. Theventure is comprised of UTC Climate, Controls & Security’s existingHVAC operations in the three countries and Midea’s distribution
Notes to Consolidated Financial Statements <strong>2012</strong> ANNUAL REPORT 69entity. Midea owns 51% of the venture and UTC Climate, Controls& Security 49%. This joint venture strengthened UTC Climate,Controls & Security’s global strategic relationship with Midea andexpands the manufacturing and distribution of residential and lightcommercial HVAC systems in Brazil, Argentina, and Chile. UTCClimate, Controls & Security recognized a gain of approximately$80 million in 2011 as a result of this transaction.During 2011, we recorded an other-than-temporary impairmentcharge totaling $66 million on an equity investment held byUTC Climate, Controls & Security, in order to write-down ourinvestment to market value as of December 31, 2011. This impairmentis recorded within “Other income, net” on our ConsolidatedStatement of Operations.On March 1, 2010, we completed the acquisition of the GESecurity business for approximately $1.8 billion, including debtassumed of $32 million. The GE Security business supplies securityand fire safety technologies for commercial and residential applicationsthrough a broad product portfolio that includes fire detectionand life safety systems, intrusion alarms, and video surveillance andaccess control systems. This business, which has been integratedinto our UTC Climate, Controls & Security segment, enhanced UTCClimate, Controls & Security’s geographic diversity through GESecurity’s strong North American presence, while increasing totalproduct and technology offerings. In connection with the acquisitionof GE Security, we recorded approximately $600 million of identifiableintangible assets and $1.1 billion of goodwill. The goodwillrecorded reflects synergies expected to be realized through thecombination of GE Security’s products, resources and managementtalent with those of the existing UTC Climate, Controls &Security business to enhance competitiveness, accelerate thedevelopment of certain product offerings, drive improved operationalperformance and secure additional service channels.Additionally, the combined business has provided the opportunityfor significant improvements to the cost structure through therationalization of general and administrative expenditures as well asresearch and development efforts.During 2010, we recorded approximately $86 million ofasset impairment charges, for assets that have met the “held-forsale”criteria, related to disposition activity within both UTC Climate,Controls & Security and UTC Aerospace Systems. These assetimpairment charges are recorded within Cost of products sold onour Consolidated Statement of Operations. The asset impairmentcharges consist of an approximately $58 million charge associatedwith UTC Climate, Controls & Security’s ongoing portfolio transformationand an approximately $28 million charge at UTC AerospaceSystems related to the disposition of an aerospace businessas part of UTC Aerospace System’s efforts to implement low costsourcing initiatives.During 2010, we completed the acquisition of Clipper. In2010, we recorded net charges related to declines in fair valuerelated to our investment in Clipper of approximately $138 million.These amounts remain in 2010 Other income, net in results of continuingoperations, as Clipper was accounted for as an equitymethodinvestment through December 2010. Clipper has beenreclassified to discontinued operations for <strong>2012</strong> and 2011, as it wasa wholly-owned entity of UTC, and was sold in the third quarter of<strong>2012</strong>. See additional discussion at Note 3.Goodwill. The changes in the carrying amount of goodwill,by segment, are as follows:(DOLLARS IN MILLIONS)Balance as ofJanuary 1,<strong>2012</strong>Goodwillresulting frombusinesscombinationsForeigncurrencytranslationand otherBalance as ofDecember 31,<strong>2012</strong>Otis $ 1,516 $ 24 $ 43 $ 1,583UTC Climate,Controls & Security 9,758 89 21 9,868Pratt & Whitney 1,223 280 (265) 1,238UTC AerospaceSystems 4,475 11,283 (1,004) 14,754Sikorsky 348 — 5 353Total Segments 17,320 11,676 (1,200) 27,796Eliminations and other 623 4 (622) 5Total $ 17,943 $ 11,680 $ (1,822) $ 27,801UTC Aerospace Systems goodwill increased $11.3 billionprincipally as a result of the Goodrich acquisition. The goodwillresults from the workforce acquired with the business as well as thesignificant synergies that are expected to be realized through theconsolidation of manufacturing facilities and overhead functions. Noamount of this goodwill is deductible for tax purposes. The goodwillacquired has been allocated to the two reporting units within theUTC Aerospace Systems segment.Pratt & Whitney goodwill increased $280 million due to theincrease in ownership interest and consolidation of IAE. The goodwillis deductible for tax purposes.The approximately $1.8 billion decrease reflected under“Foreign currency translation and other” in the table above primarilyreflects the decision to divest a number of non-core businesses andthe resulting reclassification to assets held for sale. See Note 3 forfurther discussion. In addition, approximately $360 million of goodwillwas transferred from UTC Aerospace Systems to Pratt & Whitneyin connection with the transfer of the auxiliary power unit (APU)business from UTC Aerospace Systems to Pratt & Whitney. SeeNote 19 for further discussion of the transfer of the APU business.We early adopted FASB ASU No. <strong>2012</strong>-02, “TestingIndefinite-Lived Intangible Assets for Impairment” in connectionwith the performance of our annual goodwill and indefinite-livedintangible assets impairment tests. This ASU intends to alignimpairment testing guidance among long-lived asset categories.This ASU allows for an assessment based on qualitative factors todetermine whether it is more likely than not that an indefinite-lived
70 UNITED TECHNOLOGIES CORPORATIONintangible asset is impaired prior to determining whether it is necessaryto perform the quantitative impairment test in accordance withFASB ASC Subtopic 350-30, “Intangibles—Goodwill and Other—General Intangibles Other than Goodwill.” We completed our annualimpairment testing in the third quarter of <strong>2012</strong> and determined thatno significant adjustments to the carrying amount of goodwill orindefinite-lived intangible assets were necessary beyond thosecharges recorded in connection with certain non-core businessesto be disposed as discussed further in Note 3.Intangible Assets. Identifiable intangible assets are comprisedof the following:(DOLLARS IN MILLIONS)GrossAmount<strong>2012</strong> 2011AccumulatedAmortizationGross AmountAccumulatedAmortizationAmortized:Service portfolios $ 2,127 $ (1,202) $ 2,036 $ (1,060)Patents andtrademarks 412 (167) 463 (183)IAE collaboration 1,526 – – –Customerrelationshipsand other 11,901 (1,718) 3,329 (1,429)15,966 (3,087) 5,828 (2,672)Unamortized:Trademarksand other 2,310 762Total $ 18,276 $ (3,087) $ 6,590 $ (2,672)The increase to amortized and unamortized intangibleassets pertains to the Goodrich and IAE transactions. Acquiredintangible assets are recognized at fair value in purchase accountingand then amortized to cost of sales and selling, general &administrative expenses over the applicable useful lives. The customerrelationship intangible assets are being amortized on astraight line basis as it approximates the underlying economic patternof benefit. The IAE collaboration intangible was not amortizedin <strong>2012</strong> as the underlying cash flows were negative for the year.Amortization of intangible assets in <strong>2012</strong> and 2011 was $547 millionand $398 million, respectively.The following is the expected amortization of intangibleassets for 2013 through 2017:(DOLLARS IN MILLIONS) 2013 2014 2015 2016 2017Amortization expense $ 688 $ 664 $ 633 $ 611 $ 650NOTE 3: DISCONTINUED OPERATIONSIn <strong>2012</strong>, the UTC Board of Directors approved plans for the divestitureof a number of non-core businesses. Cash generated fromthese divestitures is intended to be used to repay debt incurred tofinance the Goodrich acquisition. These divestitures, when completed,are expected to generate approximately $3 billion in netcash, on an after-tax basis.In the first quarter of <strong>2012</strong>, the legacy Hamilton SundstrandIndustrial businesses, Rocketdyne, and Clipper all met the “heldfor-sale”criteria. On June 29, <strong>2012</strong>, management approved a planfor the divestiture of UTC Power. The operating results of Clipperand UTC Power had previously been reported within “Eliminations &other” in our segment disclosure. The results of operations, includingthe net gains/losses realized or expected on disposition, andthe related cash flows which result from these non-core businesseshave been reclassified to discontinued operations in our ConsolidatedStatement of Operations and Consolidated Statement ofCash Flows for all periods presented. The remaining assets andliabilities of these non-core businesses to be sold in the first half of2013, have been reclassified to Assets held for sale and Liabilitiesheld for sale in our Consolidated Balance Sheet as ofDecember 31, <strong>2012</strong>. The sale of the legacy Hamilton SundstrandIndustrials business was completed in December <strong>2012</strong>, while thedivestiture of Clipper was completed in the third quarter of <strong>2012</strong>.Cash flows from the operation of Rocketdyne and UTC Power willcontinue to be reported in discontinued operations until their disposalsare completed.As a result of the decision to dispose of these businesses,UTC has recorded pre-tax goodwill impairment charges of approximately$360 million and $590 million related to Rocketdyne andClipper, respectively, and other pre-tax net asset impairmentcharges of approximately $179 million related to UTC Power in discontinuedoperations during <strong>2012</strong>. The goodwill impairment chargesresult from the decision to dispose of both Rocketdyne and Clipperwithin a relatively short period after acquiring the businesses. Consequently,there has not been sufficient opportunity for the long-termoperations to recover the value implicit in goodwill at the initial dateof acquisition. The impairment charge at UTC Power results fromadjusting the net assets of the business to the estimated fair valueexpected to be realized upon sale, less costs to sell the business,and further reflects the loss in value from the disposition of the businessbefore the benefits of the technology investments were fullyrealized. There could be gains or additional losses recorded upon
Notes to Consolidated Financial Statements <strong>2012</strong> ANNUAL REPORT 71final disposition of these businesses based upon the values, termsand conditions that are ultimately negotiated.On December 13, <strong>2012</strong>, we completed the sale of thelegacy Hamilton Sundstrand Industrial businesses to BC Partnersand The Carlyle Group for $3.4 billion. The sale generated a pre-taxgain of approximately $2.1 billion ($0.9 billion after tax) which hasbeen included in discontinued operations in the accompanyingConsolidated Statement of Operations. The high effective tax rate isprimarily attributable to non-deductible goodwill.On December 22, <strong>2012</strong>, we announced an agreement tosell UTC Power to ClearEdge Power. The transaction is expected toclose in the first quarter of 2013 and is largely subject only to thecompletion of certain administrative matters. On December 12,<strong>2012</strong>, we announced an agreement to sell Pratt & Whitney PowerSystems to Mitsubishi Heavy Industries. The transaction isexpected to close in the first half of 2013. The sale is subject tocustomary closing conditions, including receipt of regulatory approvals.The financial results of Pratt & Whitney Power Systems havenot been reclassified to discontinued operations as Pratt & Whitneyis expected to have a continuing involvement with the businesspost disposition.On August 7, <strong>2012</strong>, we completed the disposition of Clipperto a private equity acquirer. The disposition resulted in paymentstotaling approximately $367 million, which includedcapitalization of the business prior to sale, transaction fees, andfunding of operations as the acquirer took control of a businesswith significant net liabilities. These payments are largely reflected inNet cash flows provided by (used in) investing activities within thediscontinued operations section of the Consolidated Statement ofCash Flows. We have no continuing involvement with the Clipperbusiness following disposition.On July 23, <strong>2012</strong>, we announced an agreement to sellRocketdyne to GenCorp Inc. for $550 million. The transaction isexpected to close in the first half of 2013. The sale is subject tocustomary closing conditions, including receipt of regulatoryapprovals.The following summarized financial information related tothese non-core businesses has been segregated from continuingoperations, as applicable, and is included in Net income from discontinuedoperations in the accompanying Consolidated Statementof Operations:(DOLLARS IN MILLIONS) <strong>2012</strong> 2011Discontinued Operations:Net sales $ 2,075 $ 2,436Income from operations $ 171 $ 255Income tax expense (65) (97)Income from operations, net of income taxes 106 158Gain on disposal 861 –Income tax expense (677) –Net income from discontinued operations $ 290 $ 158The assets and liabilities held for sale on the ConsolidatedBalance Sheet as December 31, <strong>2012</strong> are as follows:(DOLLARS IN MILLIONS)AssetsCash and cash equivalents $ 17Accounts receivable, net 284Inventories and contracts in progress, net 155Future income tax benefits, current 5Other assets, current 7Future income tax benefits 2Fixed assets, net 224Goodwill 276Intangible assets, net 14Other assets 87Assets held for sale $ 1,071LiabilitiesShort-term borrowings $ 1Accounts payable 111Accrued liabilities 258Future pension and postretirement benefit obligations 3Other long-term liabilities 48Liabilities held for sale $ 421
72 UNITED TECHNOLOGIES CORPORATIONNOTE 4: EARNINGS PER SHARE(DOLLARS IN MILLIONS, EXCEPT PER SHARE AMOUNTS;SHARES IN MILLIONS) <strong>2012</strong> 2011 2010Net income attributable to commonshareowners:Net income from continuing operations $ 4,847 $ 4,831 $ 4,195Net income from discontinued operations 283 148 178Net income attributable to commonshareowners $ 5,130 $ 4,979 $ 4,373Basic weighted average number of sharesoutstanding 895.2 892.3 907.9Stock awards 11.4 14.5 14.8Diluted weighted average number of sharesoutstanding 906.6 906.8 922.7Earnings Per Share of Common Stock—Basic:Net income from continuing operations $ 5.41 $ 5.41 $ 4.62Net income from discontinued operations 0.32 0.17 0.20Net income attributable to commonshareowners 5.73 5.58 4.82Earnings Per Share of Common Stock—Diluted:Net income from continuing operations $ 5.35 $ 5.33 $ 4.55Net income from discontinued operations 0.31 0.16 0.19Net income attributable to commonshareowners 5.66 5.49 4.74The computation of diluted earnings per share excludes theeffect of the potential exercise of stock awards, including stockappreciation rights and stock options when the average marketprice of the common stock is lower than the exercise price of therelated stock awards during the period. These outstanding stockawards are not included in the computation of diluted earnings pershare because the effect would have been anti-dilutive. For <strong>2012</strong>,there were 4.7 million anti-dilutive stock awards excluded from thecomputation. For 2011, there were no anti-dilutive stock awardsexcluded from the computation. For 2010, the number of stockawards excluded from the computation was 11.4 million. There wasno impact on diluted earnings per share due to our equity unit offeringin <strong>2012</strong>.NOTE 5: COMMERCIAL AEROSPACE INDUSTRY ASSETS ANDCOMMITMENTSWe have receivables and other financing assets with commercialaerospace industry customers totaling $5,731 million and $3,736million at December 31, <strong>2012</strong> and 2011, respectively. Customerfinancing assets related to commercial aerospace industry customersconsist of products under lease of $644 million and notes andleases receivable of $584 million.Financing commitments, in the form of secured debt, guaranteesor lease financing, are provided to commercial aerospacecustomers. The extent to which the financing commitments will beutilized is not currently known, since customers may be able toobtain more favorable terms from other financing sources. We mayalso arrange for third-party investors to assume a portion of thesecommitments. If financing commitments are exercised, debt financingis generally secured by assets with fair market values equal to orexceeding the financed amounts with interest rates established atthe time of funding. We may also lease aircraft and subsequentlysublease the aircraft to customers under long-term non-cancelableoperating leases. In some instances, customers may have minimumlease terms that result in sublease periods shorter than our leaseobligation. Lastly, we have made residual value and other guaranteesrelated to various commercial aerospace customer financingarrangements. The estimated fair market values of the guaranteedassets equal or exceed the value of the related guarantees, net ofexisting reserves.We also have other contractual commitments, includingcommitments to secure certain contractual rights to provide producton new aircraft platforms. Payments made on these contractualcommitments are included within other intangible assets and are tobe amortized as the related OEM and aftermarket units are deliveredover the estimated program life. Our commercial aerospacefinancing and other contractual commitments as of December 31,<strong>2012</strong> were approximately $10.9 billion, which include approximately$5.8 billion of IAE commitments. We have entered into certain collaborationarrangements, which may include participation by ourcollaboration partners in these commitments.
Notes to Consolidated Financial Statements <strong>2012</strong> ANNUAL REPORT 73The following is the expected maturity of commercial aerospaceindustry assets and commitments as of December 31, <strong>2012</strong>:(DOLLARS IN MILLIONS) Committed 2013 2014 2015 2016 2017 ThereafterNotes and leases receivable $ 584 $ 99 $ 99 $ 68 $ 44 $ 59 $ 215Commercial aerospace financing commitments $ 3,237 $ 339 $ 785 $ 365 $ 464 $ 334 $ 950Other commercial aerospace commitments 7,628 736 567 629 676 638 4,382Collaboration partners’ share (2,027) (252) (287) (228) (193) (165) (902)Total commercial commitments $ 8,838 $ 823 $ 1,065 $ 766 $ 947 $ 807 $ 4,430Other commercial aerospace commitments includeamounts related to our agreement with Embraer, which weannounced on January 8, 2013, to power the next generationEmbraer E-Jet family.In exchange for the increased ownership and collaborationinterests and intellectual property license, Pratt & Whitney paidRolls-Royce $1.5 billion at closing with additional payments due toRolls-Royce contingent upon each hour flown by the V2500-powered aircraft in service as of June 29, <strong>2012</strong> during the fifteenyear period following closing of the purchase. These payments willbe capitalized as a collaboration intangible asset and amortized inrelation to the economic benefits received over the projectedremaining 30 year life of the V2500 program. The flight hour paymentsare included in other commercial aerospace commitments inthe table above.Our financing obligations with customers are contingentupon maintenance of certain levels of financial condition by thecustomers. In addition, we have residual value and other guaranteesof $346 million as of December 31, <strong>2012</strong>.We have long-term aftermarket maintenance contracts withcommercial aerospace industry customers for which revenue isrecognized in proportion to actual costs incurred relative to totalexpected costs to be incurred over the respective contract periods.Billings, however, are typically based on factors such as engineflight hours. The timing differences between the billings and themaintenance costs incurred generates both deferred assets anddeferred revenues. Deferred assets under these long-term aftermarketcontracts totaled $391 million and $235 million atDecember 31, <strong>2012</strong> and 2011, respectively, and are included in“Other assets” in the accompanying Consolidated Balance Sheet.Deferred revenues generated totaled $2,760 million and $1,708 millionat December 31, <strong>2012</strong> and 2011, respectively, and areincluded in “Accrued liabilities” and “Other long-term liabilities” inthe accompanying Consolidated Balance Sheet.The increases reflected above as of December 31, <strong>2012</strong>,as compared to December 31, 2011, primarily reflect the impacts ofthe Goodrich acquisition and our consolidation of IAE. See Note 2for further discussion related to acquisitions.Reserves related to aerospace receivables and financingassets were $210 million and $169 million at December 31, <strong>2012</strong>and 2011, respectively. Reserves related to financing commitmentsand guarantees were $67 million and $73 million at December 31,<strong>2012</strong> and 2011, respectively.NOTE 6: INVENTORIES & CONTRACTS IN PROGRESS(DOLLARS IN MILLIONS) <strong>2012</strong> 2011Raw materials $ 1,861 $ 1,321Work-in-process 4,151 3,175Finished goods 3,205 3,078Contracts in progress 7,354 6,89916,571 14,473Less:Progress payments, secured by lien, on U.S.Government contracts (274) (422)Billings on contracts in progress (6,760) (6,254)$ 9,537 $ 7,797Raw materials, work-in-process and finished goods are netof valuation reserves of $866 million and $884 million as ofDecember 31, <strong>2012</strong> and 2011, respectively. As of December 31,<strong>2012</strong> and 2011, inventory also includes capitalized contract developmentcosts of $823 million and $776 million, respectively, relatedto certain aerospace programs. These capitalized costs will beliquidated as production units are delivered to the customer. Thecapitalized contract development costs within inventory principallyrelate to capitalized costs on Sikorsky’s CH-148 contract with theCanadian Government. The CH-148 is a derivative of the H-92, amilitary variant of the S-92 helicopter.Contracts in progress principally relate to elevator andescalator contracts and include costs of manufactured components,accumulated installation costs and estimated earnings onincomplete contracts.Our sales contracts in many cases are long-term contractsexpected to be performed over periods exceeding twelve months.At both December 31, <strong>2012</strong> and 2011, approximately 66% of totalinventories and contracts in progress have been acquired or manufacturedunder such long-term contracts, a portion of which is notscheduled for delivery within the next twelve months.
74 UNITED TECHNOLOGIES CORPORATIONNOTE 7: FIXED ASSETS(DOLLARS IN MILLIONS)EstimatedUseful Lives <strong>2012</strong> 2011Land $ 433 $ 335Buildings and improvements 12-40 years 5,436 4,885Machinery, tools and equipment 3-20 years 10,880 9,994Other, including assetsunder construction 1,316 76618,065 15,980Accumulated depreciation (9,547) (9,779)$ 8,518 $ 6,201Depreciation expense was $920 million in <strong>2012</strong>, $823 million in2011 and $863 million in 2010.NOTE 8: ACCRUED LIABILITIES(DOLLARS IN MILLIONS) <strong>2012</strong> 2011Advances on sales contracts and service billings $ 5,936 $ 5,028Accrued salaries, wages and employee benefits 2,176 1,910Income taxes payable 1,143 547Litigation and contract matters 563 535Interest payable 494 325Service and warranty accruals 479 702Accrued restructuring costs 389 248Accrued workers compensation 233 215Accrued property, sales and use taxes 291 197Other 3,606 2,580$ 15,310 $ 12,287NOTE 9: BORROWINGS AND LINES OF CREDIT(DOLLARS IN MILLIONS) <strong>2012</strong> 2011Short-term borrowings:Commercial paper $ 320 $ 455Other borrowings 183 175Total short-term borrowings $ 503 $ 630At December 31, <strong>2012</strong>, we had revolving credit agreementswith various banks permitting aggregate borrowings of up to$4 billion pursuant to a $2 billion revolving credit agreement and a$2 billion multicurrency revolving credit agreement, both of whichexpire in November 2016. As of December 31, <strong>2012</strong>, there were noborrowings under either of these revolving credit agreements. Theundrawn portions of these revolving credit agreements are alsoavailable to serve as backup facilities for the issuance of commercialpaper. As of December 31, <strong>2012</strong>, our maximum commercialpaper borrowing authority as set by our Board of Directors was $4billion. We generally use our commercial paper borrowings forgeneral corporate purposes, including the funding of potentialacquisitions and repurchases of our common stock.The weighted-average interest rates applicable to shorttermborrowings outstanding at December 31, <strong>2012</strong> and 2011were 0.9% and 1.5%, respectively. At December 31, <strong>2012</strong>, approximately$1.7 billion was available under short-term lines of creditwith local banks at our various domestic and internationalsubsidiaries.On April 24, <strong>2012</strong>, we entered into a term loan credit agreement with various financial institutions that provides for a $2 billionunsecured term loan facility due December 31, <strong>2012</strong>. On July 26,<strong>2012</strong> we borrowed the full $2 billion available under this facility topartially finance the cash consideration of the Goodrich acquisitionand pay related fees, expenses and other amounts due and payableby UTC as a result of the acquisition. The outstanding principalbalance under this term loan credit agreement was prepaid in twoequal payments on November 5 and December 5, <strong>2012</strong>.On June 1, <strong>2012</strong>, we issued a total of $9.8 billion of longtermdebt, which is comprised of $1.0 billion aggregate principalamount of 1.200% notes due 2015, $1.5 billion aggregate principalamount of 1.800% notes due 2017, $2.3 billion aggregate principalamount of 3.100% notes due 2022, $3.5 billion aggregate principalamount of 4.500% notes due 2042, $1.0 billion aggregate principalamount of three-month LIBOR plus 0.270% floating rate notes due2013, and $0.5 billion aggregate principal amount of three-monthLIBOR plus 0.500% floating rate notes due 2015. We utilized thenet proceeds of these notes of approximately $9.6 billion to partiallyfinance the cash consideration of the Goodrich acquisition and payrelated fees, expenses and other amounts due and payable by UTCas a result of the acquisition. The three-month LIBOR rate as ofDecember 31, <strong>2012</strong> was approximately 0.3%.On June 18, <strong>2012</strong>, we issued 22,000,000 equity units andreceived approximately $1.1 billion in net proceeds. Each equityunit has a stated amount of $50 and initially is in the form of acorporate unit consisting of (a) a freestanding stock purchase contractunder which the holder will purchase from us on August 1,2015, a number of shares of our common stock determined pursuantto the terms of the agreement and (b) a 1/20, or 5.0%,undivided beneficial ownership interest in $1,000 principal amounton our 1.55% junior subordinated notes due 2022. Holders of theequity units are entitled to receive quarterly contract adjustmentpayments at a rate of 5.95% per year of the stated amount of $50per equity unit, subject to our right to defer such payments. Weused the net proceeds of the equity units to partially finance thecash consideration of the Goodrich acquisition and pay relatedfees, expenses and other amounts due and payable by UTC as aresult of the acquisition.The net proceeds from the sale of the equity units wereallocated between the purchase contracts and the notes in ourfinancial statements based on the underlying fair value of eachinstrument at the time of issuance taking into consideration thecontract adjustment payments. The fair value of the purchase contractsis expected to approximate the present value of the contract
Notes to Consolidated Financial Statements <strong>2012</strong> ANNUAL REPORT 75adjustment payments and was recorded as a reduction to CommonStock, with an offsetting credit to liabilities. This liability will beaccreted over three years through interest charges to the statementof operations based on a constant rate calculation. The purchasecontracts are reflected in our diluted earnings per share calculationsusing the treasury stock method.To finance the remainder of the cash consideration of theGoodrich acquisition and pay related fees, expenses and otheramounts due and payable, we utilized $3.2 billion from the issuanceof commercial paper and approximately $0.5 billion of cash andcash equivalents generated from operating activities. In addition, asa result of the Goodrich acquisition, we assumed $3.0 billion ofdebt, including an adjustment of $600 million to increase the valueof long-term debt assumed to its fair market value. Details of thedebt assumed are included in the long-term debt table below.On July 26, <strong>2012</strong>, upon completing the Goodrich acquisition,we terminated the bridge credit agreement, initially enteredinto as of November 8, 2011, with various financial institutions thathad provided for a $15 billion unsecured bridge loan facility whichwas available to partially fund the cash consideration of the Goodrichacquisition and pay related fees, expenses and other amountsdue and payable by UTC as a result of the acquisition. See Note 2for further details regarding the completion of the Goodrich acquisition.On December 6, <strong>2012</strong>, we announced that we had commencedcash tender offers for six series of outstanding notesissued by Goodrich. These offers expired on January 7, 2013.Holders validly tendering their notes by December 19, <strong>2012</strong>received consideration determined by reference to a fixed spreadover the yield to maturity (or, in the case of one series, yield to call)of the applicable U.S. Treasury security with the same maturity, plusan early tender payment of $30 per $1,000 principal amount ofnotes accepted for purchase. Holders validly tendering their notesafter December 19, <strong>2012</strong> but prior to January 8, 2013 receivedconsideration determined by reference to a fixed spread over theyield to maturity (or, in the case of one series, yield to call) of theapplicable U.S. Treasury security with the same maturity. A total of$635 million principal amount of all notes subject to the tender offerand $126 million of the fair value adjustment were repaid, includingapproximately $30.6 million principal amount of the 2018 notes,approximately $129 million principal amount of the 2020 notes,approximately $305.2 million principal amount of the 2021 notes,approximately $9.1 million principal amount of the 2027 notes,approximately $120.2 million principal amount of the 2036 notes,and approximately $40.8 million principal amount of the 2038notes. The effective interest rate on these notes was between 3.6%and 7.1%. The extinguishment loss was approximately $26 millionand was recognized within Interest expense, net in the accompanyingConsolidated Statement of Operations.Long-term debt consisted of the following:(DOLLARS IN MILLIONS) <strong>2012</strong> 2011LIBOR plus 0.270% floating rate notes due 2013 $ 1,000 $ –LIBOR plus 0.500% floating rate notes due 2015 500 –1.200% notes due 2015* 1,000 –4.875% notes due 2015* 1,200 1,2006.290% notes due 2016*** 291 –5.375% notes due 2017* 1,000 1,0001.800% notes due 2017* 1,500 –6.800% notes due 2018*** 99 –6.125% notes due 2019*** 300 –6.125% notes due 2019* 1,250 1,2508.875% notes due 2019 272 2724.500% notes due 2020* 1,250 1,2504.875% notes due 2020*** 171 –3.600% notes due 2021*** 295 –8.750% notes due 2021 250 2503.100% notes due 2022* 2,300 –1.550% junior subordinated notes due 2022** 1,100 –7.100% notes due 2027*** 141 –6.700% notes due 2028 400 4007.500% notes due 2029* 550 5505.400% notes due 2035* 600 6006.050% notes due 2036* 600 6006.800% notes due 2036*** 134 –7.000% notes due 2038*** 159 –6.125% notes due 2038* 1,000 1,0005.700% notes due 2040* 1,000 1,0004.500% notes due 2042* 3,500 –Project financing obligations 100 127Other debt (including capitalized leases)*** 403 131Total principal long-term debt 22,365 9,630Other (fair market value adjustments)*** 353 –Total long-term debt 22,718 9,630Less current portion (1,121) (129)Long-term portion $ 21,597 $ 9,501* We may redeem the above notes, in whole or in part, at our option at any time at aredemption price in U.S. Dollars equal to the greater of 100% of the principalamount of the notes to be redeemed or the sum of the present values of theremaining scheduled payments of principal and interest on the notes to beredeemed, discounted to the redemption date on a semiannual basis at theadjusted treasury rate plus 10-50 basis points. The redemption price will alsoinclude interest accrued to the date of redemption on the principal balance of thenotes being redeemed.** The junior subordinated notes are redeemable at our option, in whole or in part, ona date not earlier than August 1, 2017. The redemption price will be the principalamount, plus accrued and unpaid interest, if any, up to but excluding theredemption date. We may extend or eliminate the optional redemption date as partof a remarketing of the junior subordinated notes which could occur betweenApril 29, 2015 and July 15, 2015 or between July 23, 2015 and July 29, 2015.*** Includes notes and remaining fair market value adjustments that were assumed asa part of the Goodrich acquisition on July 26, <strong>2012</strong>.
76 UNITED TECHNOLOGIES CORPORATIONThe project financing obligations noted above are associatedwith the sale of rights to unbilled revenues related to theongoing activity of an entity owned by UTC Climate, Controls andSecurity. The percentage of total short-term borrowings and longtermdebt at variable interest rates was 9% and 7% atDecember 31, <strong>2012</strong> and 2011, respectively. Interest rates on ourcommercial paper borrowings are considered variable due to theirshort-term duration and high-frequency of turnover.The schedule of principal payments required on long-termdebt for the next five years and thereafter is:(DOLLARS IN MILLIONS)2013 $ 1,1212014 402015 2,7332016 3202017 2,521Thereafter 15,630Total $ 22,365We have an existing universal shelf registration statementfiled with the Securities and Exchange Commission (SEC) for anindeterminate amount of securities for future issuance, subject toour internal limitations on the amount of securities to be issuedunder this shelf registration statement.NOTE 10: EQUITYAs of January 1, <strong>2012</strong>, we adopted the provisions of the FASBissued ASU No. 2011-05, “Presentation of ComprehensiveIncome.” As a result of this adoption, we have presented totalcomprehensive income for each of the periods presented within theconsecutive statements of Consolidated Statement of Operationsand Consolidated Statement of Comprehensive Income.A summary of the changes in each component of accumulatedother comprehensive (loss) income, for the years endedDecember 31, is provided below:(DOLLARS IN MILLIONS)ForeignCurrencyTranslationDefined BenefitPension andPost-retirementPlansUnrealized Gains(Losses) onAvailable-for-Sale SecuritiesUnrealizedHedging(Losses)GainsAccumulatedOtherComprehensive(Loss) IncomeBalance at December 31, 2011 $ 206 $ (5,810) $ 164 $ (50) $ (5,490)Other comprehensive income—quarter ended March 31, <strong>2012</strong> 318 99 11 61 489Other comprehensive (loss) income—quarter ended June 30, <strong>2012</strong> (628) 136 (42) (140) (674)Other comprehensive income—quarter ended September 30, <strong>2012</strong> 690 187 2 133 1,012Other comprehensive income (loss)—quarter ended December 31, <strong>2012</strong> 68 (862) 10 (1) (785)Balance at December 31, <strong>2012</strong> $ 654 $ (6,250) $ 145 $ 3 $ (5,448)
Notes to Consolidated Financial Statements <strong>2012</strong> ANNUAL REPORT 77Changes in non-controlling interests that do not result in achange of control, and where there is a difference between fairvalue and carrying value, are accounted for as equity transactions.A summary of these changes in ownership interests in subsidiariesand the pro-forma effect on Net income attributable to commonshareowners had they been recorded through net income is providedbelow:(DOLLARS IN MILLIONS) <strong>2012</strong> 2011 2010Net income attributable to commonshareowners $ 5,130 $ 4,979 $ 4,373Transfers to non-controlling interests:Increase in common stock for sale ofsubsidiary shares – 3 –Decrease in common stock for purchase ofsubsidiary shares (34) (54) (12)Net income attributable to commonshareowners after transfers to non-controllinginterests $ 5,096 $ 4,928 $ 4,361NOTE 11: INCOME TAXESThe income tax expense (benefit) for the years endedDecember 31, consisted of the following components:(DOLLARS IN MILLIONS) <strong>2012</strong> 2011 2010Current:<strong>United</strong> States:Federal $ 403 $ 382 $ 48State 9 96 117Foreign 1,179 1,322 1,1351,591 1,800 1,300Future:<strong>United</strong> States:Federal 335 526 467State 111 26 4Foreign (326) (218) (46)120 334 425Income tax expense $ 1,711 $ 2,134 $ 1,725Attributable to items credited to equityand goodwill $ 297 $ 864 $ 276Future income taxes represent the tax effects of transactions,which are reported in different periods for tax and financialreporting purposes. These amounts consist of the tax effects oftemporary differences between the tax and financial reporting balancesheets and tax carryforwards. Current and non-current futureincome tax benefits and payables within the same tax jurisdictionare generally offset for presentation in the Consolidated BalanceSheet.During <strong>2012</strong>, UTC completed the Goodrich acquisition. Theaccounting for the current and non-current future income tax benefitsand payables was materially impacted by the acquisition, resultingin a shift of the classification of the tax effects of certaintemporary differences from non-current income tax benefits to noncurrentfuture income taxes payable.The tax effects of net temporary differences and tax carryforwardswhich gave rise to future income tax benefits and payablesat December 31, <strong>2012</strong> and 2011 are as follows:(DOLLARS IN MILLIONS) <strong>2012</strong> 2011Future income tax benefits:Insurance and employee benefits $ 1,168 $ 2,579Other asset basis differences 119 (569)Other liability basis differences 1,052 1,046Tax loss carryforwards 382 723Tax credit carryforwards 1,107 1,247Valuation allowances (618) (977)$ 3,210 $ 4,049Future income taxes payable:Insurance and employee benefits $ (2,238) $ 163Other asset basis differences 4,440 681Other items, net (195) 71Tax loss carryforwards (409) –Tax credit carryforwards (80) –Valuation allowances 286 –$ 1,804 $ 915The future income taxes payable balances of $1,804 millionand $915 million, reflected in the table above, for the years endedDecember 31, <strong>2012</strong> and 2011, respectively, are reported inaccrued liabilities and other long-term liabilities on the balancesheet.Valuation allowances have been established primarily fortax credit carryforwards, tax loss carryforwards, and certain foreigntemporary differences to reduce the future income tax benefits toexpected realizable amounts.During <strong>2012</strong>, approximately $225 million of valuation allowanceswere released as a result of internal legal entity reorganizations.These internal reorganizations were a component of ourongoing efforts to improve business efficiency. These valuationallowance releases are included in the effective tax rate reconciliationtable within the tax on international activities component.The sources of income before income taxes are:(DOLLARS IN MILLIONS) <strong>2012</strong> 2011 2010<strong>United</strong> States $ 2,595 $ 3,168 $ 2,441Foreign 4,316 4,182 3,807$ 6,911 $ 7,350 $ 6,248With few exceptions, U.S. income taxes have not beenprovided on undistributed earnings of UTC’s international subsidiaries.These earnings relate to ongoing operations and wereapproximately $22 billion as of December 31, <strong>2012</strong>. It is not practicableto estimate the amount of tax that might be payable. Our
78 UNITED TECHNOLOGIES CORPORATIONintention is to reinvest these earnings permanently outside the U.S.or to repatriate the earnings only when it is tax effective to do so.Differences between effective income tax rates and thestatutory U.S. federal income tax rate are as follows:<strong>2012</strong> 2011 2010Statutory U.S. federal income tax rate 35.0 % 35.0 % 35.0 %Tax on international activities (6.4)% (4.4)% (7.8)%Tax audit settlements (3.4)% (0.9)% –Other (0.4)% (0.7)% 0.4 %Effective income tax rate 24.8 % 29.0 % 27.6 %The <strong>2012</strong> effective tax rate decreased as compared to2011. The <strong>2012</strong> effective tax rate reflects a favorable non-cashincome tax adjustment of approximately $203 million related to theconclusion of the IRS’s examination of UTC’s 2006 – 2008 taxyears, as well as a reduction in tax expense of $34 million related tothe favorable resolution of disputed tax matters with the AppealsDivision of the IRS for the tax years 2004 – 2005. Also included inthe <strong>2012</strong> effective tax rate is the favorable income tax impact of$225 million related to the release of non-U.S. valuation allowancesresulting from internal legal entity reorganizations. This is reported inthe table above in tax on international activities.The 2011 effective tax rate reflects approximately $63 millionof favorable income tax adjustments related to the settlement oftwo refund claims for years prior to 2004, as well as a favorable taximpact of $17 million related to a U.K. tax rate reduction enacted in2011. These favorable tax adjustments are partially offset by nondeductiblecharges accrued in 2011.The 2010 effective income tax rate reflects a non-recurringtax expense reduction associated with management’s decision torepatriate additional high tax dividends from 2010 earnings to theU.S. as a result of U.S. tax legislation enacted in 2010. This waspartially offset by the non-deductibility of impairment charges, theadverse impact from the health care legislation related to the MedicarePart D program and other increases to UTC’s effective incometax rate.At December 31, <strong>2012</strong>, tax credit carryforwards, principallystate and foreign, and tax loss carryforwards, principally state andforeign, were as follows:(DOLLARS IN MILLIONS)Tax CreditCarryforwardsTax LossCarryforwardsExpiration period:2013-2017 $ 52 $ 6262018-2022 17 3782023-2032 310 1,053Indefinite 808 2,115Total $ 1,187 $ 4,172At December 31, <strong>2012</strong>, we had gross tax-effected unrecognizedtax benefits of $1,073 million, all of which, if recognized,would impact the effective tax rate. The table below includes bothadditional unrecognized tax benefits and related interest attributableto the acquisition of Goodrich in <strong>2012</strong>. A reconciliation of thebeginning and ending amounts of unrecognized tax benefits andinterest expense related to unrecognized tax benefits for the yearsended December 31, <strong>2012</strong>, 2011, and 2010 is as follows:(DOLLARS IN MILLIONS) <strong>2012</strong> 2011 2010Balance at January 1 $ 946 $ 891 $ 793Additions for tax positions related to thecurrent year 232 71 115Additions for tax positions of prior years 221 71 80Reductions for tax positions of prior years (21) (24) (81)Settlements (305) (63) (16)Balance at December 31 $ 1,073 $ 946 $ 891Gross interest expense related tounrecognized tax benefits $ 40 $ 23 $ 27Total accrued interest balance atDecember 31 $ 270 $ 165 $ 144We conduct business globally and, as a result, UTC or oneor more of our subsidiaries files income tax returns in the U.S.federal jurisdiction and various state and foreign jurisdictions. In thenormal course of business we are subject to examination by taxingauthorities throughout the world, including such major jurisdictionsas Australia, Belgium, Canada, China, France, Germany, HongKong, Italy, Japan, South Korea, Singapore, Spain, the <strong>United</strong>Kingdom and the <strong>United</strong> States. With few exceptions, we are nolonger subject to U.S. federal, state and local, or non-U.S. incometax examinations for years before 1998.During the first quarter of <strong>2012</strong>, the IRS completed examinationfieldwork for our 2006 through 2008 tax years and issued itsaudit report. Based on the IRS audit report, we filed a protest withrespect to certain IRS-proposed adjustments with which we do notagree. Resolution discussions with the Appeals Division of the IRSwill commence on the unagreed items in 2013. However, the timingof any resolution is currently uncertain. During the third quarter of<strong>2012</strong>, we reached final resolution with the Appeals Division of theIRS for our 2004 and 2005 tax years regarding certain proposedadjustments with which we did not agree. As a result of the abovedescribed events with respect to our 2004 – 2005 and 2006 – 2008tax years, we recorded reductions in tax expense in the first andthird quarters of <strong>2012</strong> in the aggregate amount of $237 million. IRSaudit fieldwork for tax years 2009 and 2010 commenced in the firstquarter of <strong>2012</strong> and is currently expected to continue into 2014.UTC completed the Goodrich acquisition during <strong>2012</strong>.Goodrich pre-acquisition tax years are also the subject of certainIRS audit, appeals and litigation activity. Goodrich tax years 2001and 2002 are currently the subject of litigation involving the propertiming of certain deductions, which litigation is expected to continuethrough 2013. Goodrich tax years 2005 and 2006 are the subjectof litigation with respect to a separate issue involving the proper
Notes to Consolidated Financial Statements <strong>2012</strong> ANNUAL REPORT 79timing of deductions, which litigation is also expected to continuethrough 2013. Goodrich tax years 2007 and 2008 are currentlybefore the Appeals Division of the IRS for resolution discussionsregarding certain proposed adjustments with which UTC does notagree, which are expected to continue through 2013. Goodrich taxyears 2009 and 2010 are currently under review by the ExaminationDivision of the IRS, which is expected to continue through mid-2013. We expect the IRS to commence examination activity forGoodrich tax years 2011 and <strong>2012</strong> during the second half of 2013.During 2011, we reached final resolution with the IRS ontwo refund claims that had been pending with respect to pre-2004tax years and refunds were received in accordance with the resolutions.A reduction in tax expense in the amount of $63 million andpretax interest income in the amount of $89 million was recognizedduring 2011 associated with the resolution of these claims.It is reasonably possible that over the next twelve monthsthe amount of unrecognized tax benefits may change within a rangeof a net increase of $40 million to a net decrease of $275 million asa result of additional worldwide uncertain tax positions, the revaluationof current uncertain tax positions arising from developments inexaminations, in appeals, or in the courts, or the closure of taxstatutes. Not included in the range is €176 million (approximately$234 million) related to certain deductions claimed in France for taxyears 2008 through 2010 that the French Revenue Authority hasproposed to disallow. Resolution discussions with the FrenchRevenue Authority have been unsuccessful to date and UTC maybe required to pursue the defense of this matter through litigation,which could be commenced within the next twelve months. UTCintends to assert a vigorous defense and believes it should prevailon the issue. Accordingly, no tax expense has been accrued for thismatter.Also not included in the above range is €203 million(approximately $270 million) of tax benefits that we have claimedrelated to a 1998 German reorganization. Upon audit, these taxbenefits were disallowed by the German Tax Office. In <strong>2012</strong>, wefiled suit in the local German Tax Court. In 2008 the GermanFederal Tax Court (FTC) denied benefits to another taxpayer in acase involving a German tax law relevant to our reorganization. Thedetermination of the FTC on this other matter was appealed to theEuropean Court of Justice (ECJ) to determine if the underlyingGerman tax law is violative of European Union (EU) principles. OnSeptember 17, 2009 the ECJ issued an opinion in this case that isgenerally favorable to the other taxpayer and referred the case backto the FTC for further consideration of certain related issues. In May2010, the FTC released its decision, in which it resolved certain taxissues that may be relevant to our suit and remanded the case to alower court for further development. In <strong>2012</strong>, the lower courtdecided in favor of the taxpayer and the government appealed thefindings to the FTC. After consideration of the ECJ decision, thelatest FTC decision and the lower court decision, we continue tobelieve that it is more likely than not that the relevant German taxlaw is violative of EU principles and we have not accrued taxexpense for this matter. As we continue to monitor developmentsrelated to this matter, it may become necessary for us to accrue taxexpense and related interest.NOTE 12: EMPLOYEE BENEFIT PLANSWe sponsor numerous domestic and foreign employee benefitplans, which are discussed below.Employee Savings Plans. We sponsor various employeesavings plans. Our contributions to employer sponsored definedcontribution plans were $256 million, $218 million and $200 millionfor <strong>2012</strong>, 2011 and 2010, respectively. Included in the current yearcontributions to employer sponsored defined contribution plans is$26 million of contributions to Goodrich defined contribution plans.Effective January 1, 2010, newly hired non-union domestic employeesreceive all of their retirement benefits through the defined contributionsavings plan.Our non-union domestic employee savings plan uses anEmployee Stock Ownership Plan (ESOP) for employer contributions.External borrowings were used by the ESOP to fund aportion of its purchase of ESOP stock from us. The external borrowingshave been extinguished and only re-amortized loans remainbetween UTC and the ESOP Trust. As ESOP debt service paymentsare made, common stock is released from an unreleasedshares account. ESOP debt may be prepaid or re-amortized toeither increase or decrease the number of shares released so thatthe value of released shares equals the value of plan benefit. Wemay also, at our option, contribute additional common stock orcash to the ESOP.Shares of common stock are allocated to employees’ESOP accounts at fair value on the date earned. Cash dividends oncommon stock held by the ESOP are used for debt service payments.Participants receive additional shares in lieu of cash dividends.Common stock allocated to ESOP participants is included inthe average number of common shares outstanding for both basicand diluted earnings per share. At December 31, <strong>2012</strong>, 32.8 millioncommon shares had been allocated to employees, leaving17.1 million unallocated common shares in the ESOP Trust, with anapproximate fair value of $1.4 billion.
80 UNITED TECHNOLOGIES CORPORATIONPension Plans. We sponsor both funded and unfundeddomestic and foreign defined benefit pension plans that cover themajority of our employees. Our plans use a December 31measurement date consistent with our fiscal year.(DOLLARS IN MILLIONS) <strong>2012</strong> 2011Change in Benefit Obligation:Beginning balance $ 27,167 $ 24,445Service cost 500 444Interest cost 1,331 1,298Actuarial loss 2,855 2,185Total benefits paid (1,357) (1,233)Net settlement and curtailment (gain) loss (90) 1Plan amendments (195) 21Business combinations 5,235 –Other 262 6Ending balance $ 35,708 $ 27,167Change in Plan Assets:Beginning balance $ 23,542 $ 22,384Actual return on plan assets 3,306 1,320Employer contributions 516 1,060Benefits paid from plan assets (1,357) (1,233)Business combinations 3,800 –Other 121 11Ending balance $ 29,928 $ 23,542Funded Status:Fair value of plan assets $ 29,928 $ 23,542Benefit obligations (35,708) (27,167)Funded status of plan $ (5,780) $ (3,625)Amounts Recognized in the ConsolidatedBalance Sheet Consist of:Noncurrent assets $ 643 $ 552Current liability (105) (64)Noncurrent liability (6,318) (4,113)Net amount recognized $ (5,780) $ (3,625)Amounts Recognized in Accumulated OtherComprehensive Loss Consist of:Net actuarial loss $ 10,215 $ 9,436Prior service credit (322) (152)Transition obligation – 6Net amount recognized $ 9,893 $ 9,290The amounts included in “Other” in the preceding tablereflect the impact of foreign exchange translation, primarily for plansin the U.K. and Canada, partially offset by the impact of settlements.As part of the Goodrich acquisition on July 26, <strong>2012</strong>, weassumed approximately $5.2 billion of pension projected benefitobligations and $3.8 billion of plan assets.Qualified domestic pension plan benefits comprise approximately75% of the projected benefit obligation. Benefits for unionemployees are generally based on a stated amount for each year ofservice. For non-union employees, benefits are generally based onan employee’s years of service and compensation near retirement.Effective January 1, 2015, this formula will change to the existingcash balance formula that was adopted in 2003 for newly hirednon-union employees and for other non-union employees whomade a one-time voluntary election to have future benefit accrualsdetermined under this formula. This plan change resulted in a $623million reduction in the projected benefit obligation as ofDecember 31, 2009 and an additional $204 million reduction in theprojected benefit obligation as of July 26, <strong>2012</strong> when applied tolegacy Goodrich salaried employees. Certain foreign plans, whichcomprise approximately 23% of the projected benefit obligation, areconsidered defined benefit plans for accounting purposes. Nonqualifieddomestic pension plans provide supplementary retirementbenefits to certain employees and are not a material component ofthe projected benefit obligation.We made $201 million of cash contributions to our domesticdefined benefit pension plans and made $229 million of cashcontributions to our foreign defined benefit pension plans in <strong>2012</strong>.In 2011, we made $156 million of cash contributions and contributed$450 million in UTC common stock to our domesticdefined benefit pension plans and made $395 million of cash contributionsto our foreign defined benefit pension plans.Information for pension plans with accumulated benefitobligations in excess of plan assets:(DOLLARS IN MILLIONS) <strong>2012</strong> 2011Projected benefit obligation $ 32,278 $ 24,091Accumulated benefit obligation 31,147 23,198Fair value of plan assets 25,889 19,949The accumulated benefit obligation for all defined benefitpension plans was $34.4 billion and $26.0 billion at December 31,<strong>2012</strong> and 2011, respectively.The components of the net periodic pension cost are asfollows:(DOLLARS IN MILLIONS) <strong>2012</strong> 2011 2010Pension Benefits:Service cost $ 500 $ 444 $ 396Interest cost 1,331 1,298 1,287Expected return on plan assets (1,944) (1,834) (1,735)Amortization of prior service credits (24) (12) (18)Amortization of unrecognized nettransition obligation 1 1 1Recognized actuarial net loss 722 462 285Net settlement and curtailment loss 77 16 2Net periodic pension cost—employer $ 663 $ 375 $ 218
Notes to Consolidated Financial Statements <strong>2012</strong> ANNUAL REPORT 81Net settlements and curtailment losses for pension benefitsincludes curtailment losses of approximately $17 million related to,and recorded in, discontinued operations for the year endedDecember 31, <strong>2012</strong>.Other changes in plan assets and benefit obligations recognizedin other comprehensive loss in <strong>2012</strong> are as follows:(DOLLARS IN MILLIONS)Current year actuarial loss $ 1,493Amortization of actuarial loss (722)Current year prior service credit (195)Amortization of prior service credit 24Amortization of transition obligation (1)Other 4Total recognized in other comprehensive loss $ 603Net recognized in net periodic pension cost and othercomprehensive loss $ 1,266The estimated amount that will be amortized from accumulatedother comprehensive loss into net periodic pension cost in2013 is as follows:(DOLLARS IN MILLIONS)Net actuarial loss $ 964Prior service credit (42)$ 922Major assumptions used in determining the benefit obligationand net cost for pension plans are presented in the followingtable as weighted-averages:Benefit ObligationNet Cost<strong>2012</strong> 2011 <strong>2012</strong> 2011 2010Discount rate 4.0% 4.7% 4.6% 5.4% 5.9%Salary scale 4.2% 4.3% 4.3% 4.4% 4.4%Expected return on planassets – – 7.7% 7.9% 8.0%In determining the expected return on plan assets, weconsider the relative weighting of plan assets, the historicalperformance of total plan assets and individual asset classes, andeconomic and other indicators of future performance. In addition,we may consult with and consider the opinions of financial andother professionals in developing appropriate capital marketassumptions. Return projections are also validated using a simulationmodel that incorporates yield curves, credit spreads and riskpremiums to project long-term prospective returns.The plans’ investment management objectives includemaintaining an adequate level of diversification, reducing interestrate and market risk, and providing adequate liquidity to meetimmediate and future benefit payment requirements. The overallinvestment strategy targets a mix of 65% growth seeking assetsand 35% income generating assets using a wide diversification ofasset types, fund strategies and investment managers. The growthseeking allocation consists of global public equities in developedand emerging countries, private equity, real estate and balancedmarket risk strategies. Within public equities, 9% of the totalinvestment portfolio is an enhanced equity strategy that invests inpublicly traded equity and fixed income securities, derivatives andforeign currency. Investments in private equity are primarily via limitedpartnership interests in buy-out strategies with smaller allocationsto distressed debt funds. The real estate strategy is principallyconcentrated in directly held U.S. core investments with somesmaller investments in international, value-added and opportunisticstrategies. Within the income generating assets, the fixed incomeportfolio is mainly a broadly diversified portfolio of corporate bonds.The plans have continued their pension risk managementtechniques designed to reduce the plan’s interest rate risk. Morespecifically, the plans have incorporated liability hedging programsthat include the adoption of a risk reduction objective as part of thelong-term investment strategy. Under this objective the interest ratehedge is dynamically increased as funded status improves. Thehedging programs incorporate a range of assets and investmenttools, each with ranging interest rate sensitivity. The investmentportfolios are currently hedging 40% to 50% of the interest ratesensitivity of the pension plan liabilities.
82 UNITED TECHNOLOGIES CORPORATIONThe fair values of pension plan assets at December 31, <strong>2012</strong> and 2011 by asset category are as follows:(DOLLARS IN MILLIONS)Quoted Prices inActive MarketsFor Identical Assets(Level 1)SignificantObservable Inputs(Level 2)SignificantUnobservable Inputs(Level 3)TotalAsset Category:Public EquitiesGlobal Equities $ 6,413 $ – $ – $ 6,413Global Equity Commingled Funds (a) – 4,114 – 4,114Enhanced Global Equities (b) 169 1,959 447 2,575Private Equities (c) – – 1,202 1,202Fixed Income SecuritiesGovernments 1,003 1,421 – 2,424Corporate Bonds – 7,699 276 7,975Structured Products (d) – 21 – 21Real Estate (e) – 19 1,785 1,804Other (f) – 2,182 – 2,182Cash & Cash Equivalents (g) 1 364 – 365Subtotal $ 7,586 $ 17,779 $ 3,710 29,075Other Assets & Liabilities (h) 853Total at December 31, <strong>2012</strong> $ 29,928Public EquitiesGlobal Equities $ 5,210 $ 4 $ – $ 5,214Global Equity Commingled Funds (a) – 2,981 – 2,981Enhanced Global Equities (b) 44 1,590 239 1,873Private Equities (c) – – 1,159 1,159Fixed Income SecuritiesGovernments 1,564 1,199 – 2,763Corporate Bonds – 5,167 110 5,277Structured Products (d) – 67 – 67Real Estate (e) – 16 1,364 1,380Other (f) – 1,869 – 1,869Cash & Cash Equivalents (g) – 359 – 359Subtotal $ 6,818 $ 13,252 $ 2,872 22,942Other Assets & Liabilities (h) 600Total at December 31, 2011 $ 23,542(a) Represents commingled funds that invest primarily in common stocks.(b) Represents enhanced equity separate account and commingled fund portfolios. A portion of the portfolio may include long-shortmarket neutral and relative value strategies that invest in publicly traded, equity and fixed income securities, as well as derivatives ofequity and fixed income securities and foreign currency.(c) Represents limited partner investments with general partners that primarily invest in debt and equity.(d) Represents mortgage and asset-backed securities.(e) Represents investments in real estate including commingled funds and directly held properties.(f) Represents insurance contracts and global balanced risk commingled funds consisting mainly of equity, bonds and somecommodities.(g) Represents short-term commercial paper, bonds and other cash or cash-like instruments.(h) Represents trust receivables and payables that are not leveled.Derivatives in the plan are primarily used to manage riskand gain asset class exposure while still maintaining liquidity.Derivative instruments mainly consist of equity futures, interest ratefutures, interest rate swaps and currency forward contracts.Our common stock represents approximately 3% and 4%of total plan assets at December 31, <strong>2012</strong> and 2011, respectively.We review our assets at least quarterly to ensure we are within thetargeted asset allocation ranges and, if necessary, asset balancesare adjusted back within target allocations. We employ a broadlydiversified investment manager structure that includes diversificationby active and passive management, style, capitalization, country,sector, industry and number of investment managers.
Notes to Consolidated Financial Statements <strong>2012</strong> ANNUAL REPORT 83The fair value measurement of plan assets using significant unobservable inputs (Level 3) changed due to the following:GlobalEquitiesEnhancedGlobalEquitiesPrivateEquitiesCorporateBonds(DOLLARS IN MILLIONS)TotalBalance, December 31, 2010 $ 1 $ 245 $ 1,134 $ – $ 944 $ 2,324Realized gains (losses) – (1) 108 – (6) 101Unrealized gains (losses) relating to instruments still held in the reporting period – (1) 17 6 137 159Purchases, sales, and settlements, net (1) (4) (100) 104 289 288Balance, December 31, 2011 – 239 1,159 110 1,364 2,872Plan assets acquired – 63 – – 79 142Realized gains – 1 174 3 6 184Unrealized (losses) gains relating to instruments still held in the reporting period – 31 (14) 51 115 183Purchases, sales, and settlements, net – 113 (117) 112 221 329Balance, December 31, <strong>2012</strong> $ – $ 447 $ 1,202 $ 276 $ 1,785 $ 3,710RealEstateQuoted market prices are used to value investments whenavailable. Investments in securities traded on exchanges, includinglisted futures and options, are valued at the last reported sale priceson the last business day of the year or, if not available, the lastreported bid prices. Fixed income securities are primarily measuredusing a market approach pricing methodology, where observableprices are obtained by market transactions involving identical orcomparable securities of issuers with similar credit ratings. Mortgageshave been valued on the basis of their future principal andinterest payments discounted at prevailing interest rates for similarinvestments. Investment contracts are valued at fair value by discountingthe related cash flows based on current yields of similarinstruments with comparable durations. Real estate investments arevalued on a quarterly basis using discounted cash flow modelswhich consider long-term lease estimates, future rental receipts andestimated residual values. Valuation estimates are supplemented bythird-party appraisals on an annual basis.Private equity limited partnerships are valued quarterlyusing discounted cash flows, earnings multiples and market multiples.Valuation adjustments reflect changes in operating results,financial condition, or prospects of the applicable portfolio company.Over-the-counter securities and government obligations arevalued at the bid prices or the average of the bid and ask prices onthe last business day of the year from published sources or, if notavailable, from other sources considered reliable, generally brokerquotes. Temporary cash investments are stated at cost, whichapproximates fair value.ESTIMATED FUTURE CONTRIBUTIONS AND BENEFITPAYMENTSWe expect to make contributions of approximately $200 million toour foreign defined benefit pension plans in 2013. Although we arenot required to make contributions to our domestic defined benefitpension plans through the end of 2013, we may elect to make discretionarycontributions in 2013. Contributions do not reflect benefitsto be paid directly from corporate assets.Benefit payments, including amounts to be paid from corporateassets, and reflecting expected future service, as appropriate,are expected to be paid as follows: $1,657 million in 2013, $1,654million in 2014, $1,724 million in 2015, $1,793 million in 2016,$1,880 million in 2017, and $10,442 million from 2018through 2022.
84 UNITED TECHNOLOGIES CORPORATIONPostretirement Benefit Plans. We sponsor a number ofpostretirement benefit plans that provide health and life benefits toeligible retirees. Such benefits are provided primarily from domesticplans, which comprise approximately 88% of the benefit obligation.The postretirement plans are primarily unfunded. Assets in fundedplans are primarily invested in cash and cash equivalents.(DOLLARS IN MILLIONS) <strong>2012</strong> 2011Change in Benefit Obligation:Beginning balance $ 784 $ 832Service cost 3 3Interest cost 37 39Actuarial loss (gain) 45 (7)Total benefits paid (107) (104)Business combinations 328 –Other 16 21Ending balance $ 1,106 $ 784Change in Plan Assets:Beginning balance $ – $ 10Actual return on plan assets – 2Employer contributions 85 76Benefits paid from plan assets (107) (104)Other 22 16Ending balance $ – $ –Funded Status:Fair value of plan assets $ – $ –Benefit obligations (1,106) (784)Funded status of plan $ (1,106) $ (784)Amounts Recognized in the ConsolidatedBalance Sheet Consist of:Current liability $ (91) $ (74)Noncurrent liability (1,015) (710)Net amount recognized $ (1,106) $ (784)Amounts Recognized in Accumulated OtherComprehensive Loss Consist of:Net actuarial gain $ (65) $ (120)Prior service (credit) cost (11) 2Net amount recognized $ (76) $ (118)As part of our acquisition of Goodrich on July 26, <strong>2012</strong>, weassumed approximately $328 million of postretirement projectedbenefit obligations.We modified the postretirement medical benefits providedto legacy Goodrich salaried employees by eliminating any companysubsidy for retirements that occur after January 31, 2014. Thisresulted in a $16 million reduction in the projected benefit obligationas of July 26, <strong>2012</strong>.The components of net periodic benefit cost are as follows:(DOLLARS IN MILLIONS) <strong>2012</strong> 2011 2010Other Postretirement Benefits:Service cost $ 3 $ 3 $ 2Interest cost 37 39 46Expected return on plan assets – (1) (1)Amortization of prior service credit (4) (2) (2)Recognized actuarial net gain (6) (8) (1)Net settlement and curtailment gain (2) (8) –Net periodic other postretirement benefit cost $ 28 $ 23 $ 44Other changes in plan assets and benefit obligations recognizedin other comprehensive loss in <strong>2012</strong> are as follows:(DOLLARS IN MILLIONS)Current year actuarial loss $ 49Current year prior service credit (16)Amortization of prior service credit 4Amortization of actuarial net gain 6Net settlements and curtailments (1)Total recognized in other comprehensive loss $ 42Net recognized in net periodic other postretirement benefit cost andother comprehensive loss $ 70The estimated amounts that will be amortized from accumulatedother comprehensive loss into net periodic benefit cost in2013 include actuarial net gains of $4 million and prior servicecredit of $11 million.Major assumptions used in determining the benefit obligationand net cost for postretirement plans are presented in the followingtable as weighted-averages:Benefit ObligationNet Cost<strong>2012</strong> 2011 <strong>2012</strong> 2011 2010Discount rate 3.6% 4.3% 4.2% 4.9% 5.5%Expected return on plan assets – – – 5.0% 5.0%Assumed health care cost trend rates are as follows:<strong>2012</strong> 2011Health care cost trend rate assumed for next year 8.0% 8.5%Rate that the cost trend rate gradually declines to 5.0% 5.0%Year that the rate reaches the rate it is assumed to remain at 2019 2019
Notes to Consolidated Financial Statements <strong>2012</strong> ANNUAL REPORT 85Assumed health care cost trend rates have a significanteffect on the amounts reported for the health care plans. A onepercentage-pointchange in assumed health care cost trend rateswould have the following effects:<strong>2012</strong> One-Percentage-Point(DOLLARS IN MILLIONS) Increase DecreaseEffect on total service and interest cost $ 2 $ (2)Effect on postretirement benefit obligation 71 (60)ESTIMATED FUTURE BENEFIT PAYMENTSBenefit payments, including net amounts to be paid from corporateassets and reflecting expected future service, as appropriate, areexpected to be paid as follows: $100 million in 2013, $98 million in2014, $95 million in 2015, $89 million in 2016, $83 million in 2017,and $357 million from 2018 through 2022.Multiemployer Benefit Plans. We contribute to variousdomestic and foreign multiemployer defined benefit pension plans.The risks of participating in these multiemployer plans are differentfrom single-employer plans in that assets contributed are pooledand may be used to provide benefits to employees of other participatingemployers. If a participating employer stops contributing tothe plan, the unfunded obligations of the plan may be borne by theremaining participating employers. Lastly, if we choose to stop participatingin some of our multiemployer plans, we may be requiredto pay those plans a withdrawal liability based on the underfundedstatus of the plan.Our participation in these plans for the annual periodsended December 31 is outlined in the table below. Unless otherwisenoted, the most recent Pension Protection Act (PPA) zonestatus available in <strong>2012</strong> and 2011 is for the plan’s year-end atJune 30, 2011, and June 30, 2010, respectively. The zone status isbased on information that we received from the plan and is certifiedby the plan’s actuary. Our significant plan is in the green zonewhich represents at least 80 percent funded and does not require afinancial improvement plan (FIP) or a rehabilitation plan (RP).(DOLLARS IN MILLIONS)PensionProtection ActZone StatusFIP/RP StatusContributionsPension FundEIN/PensionPlan Number <strong>2012</strong> 2011Pending/Implemented <strong>2012</strong> 2011 2010SurchargeImposedExpiration Date ofCollective-BargainingAgreementNational Elevator Industry Pension Plan 23-2694291 Green Green No $ 63 $ 56 $ 55 No July 8, 2017Other funds 36 38 35$ 99 $ 94 $ 90For the plan years ended June 30, 2011 and 2010,respectively, we were listed in the National Elevator Industry PensionPlan’s Forms 5500 as providing more than 5% of the totalcontributions for the plan. At the date these financial statementswere issued, Forms 5500 were not available for the plan year endingJune 30, <strong>2012</strong>.In addition, we participate in several multiemployerarrangements that provide postretirement benefits other than pensions,with the National Elevator Industry Health Benefit Plan beingthe most significant. These arrangements generally provide medicaland life benefits for eligible active employees and retirees and theirdependents. Contributions to multiemployer plans that providepostretirement benefits other than pensions were $11 million, $10million and $10 million for <strong>2012</strong>, 2011 and 2010, respectively.Stock-based Compensation. We have long-term incentiveplans authorizing various types of market and performance basedincentive awards that may be granted to officers and employees. OurLong Term Incentive Plan (LTIP) was initially approved on April 13,2005 and amended in 2011 to increase the maximum number ofshares available for award under the LTIP to 119 million shares. Allequity-based compensation awards are made exclusively through theLTIP. As of December 31, <strong>2012</strong>, approximately 44 million sharesremain available for awards under the LTIP. The LTIP does not containan aggregate annual award limit. We expect that the sharesawarded on an annual basis will range from 1% to 1.5% of sharesoutstanding. The LTIP will expire after all shares have been awardedor April 30, 2017, whichever is sooner.Under all long-term incentive plans, the exercise price ofawards is set on the grant date and may not be less than the fairmarket value per share on that date. Generally, stock appreciationrights and stock options have a term of ten years and a minimumthree-year vesting period. In the event of retirement, awards heldfor more than one year become vested and exercisable. LTIPawards with performance-based vesting generally have a minimumthree-year vesting period and vest based on performance againstpre-established metrics. In the event of retirement, vesting forawards held more than one year does not accelerate, but suchawards remain eligible to vest as scheduled based on actual performancerelative to target metrics. We have historicallyrepurchased shares of our common stock in an amount at leastequal to the number of shares issued under our equity compensationarrangements and will continue to evaluate this policy in conjunctionwith our overall share repurchase program.We measure the cost of all share-based payments, includingstock options, at fair value on the grant date and recognize thiscost in the statement of operations. For the years endedDecember 31, <strong>2012</strong>, 2011 and 2010, $210 million, $221 millionand $148 million, respectively, of compensation cost was recog-
86 UNITED TECHNOLOGIES CORPORATIONnized in operating results. The associated future income tax benefitrecognized was $76 million, $75 million and $47 million for theyears ended December 31, <strong>2012</strong>, 2011 and 2010, respectively.For the years ended December 31, <strong>2012</strong>, 2011 and 2010,the amount of cash received from the exercise of stock options was$381 million, $226 million and $386 million, respectively, with anassociated tax benefit realized of $111 million, $101 million and$139 million, respectively. In addition, for the years endedDecember 31, <strong>2012</strong>, 2011 and 2010, the associated tax benefitrealized from the vesting of performance share units was $15 million,$19 million and $20 million, respectively. Also, in accordancewith the Compensation—Stock Compensation Topic of the FASBASC, for the years ended December 31, <strong>2012</strong>, 2011 and 2010, $67million, $81 million and $94 million, respectively, of certain tax benefitshave been reported as operating cash outflows withcorresponding cash inflows from financing activities.At December 31, <strong>2012</strong>, there was $185 million of totalunrecognized compensation cost related to non-vested equityawards granted under long-term incentive plans. This cost isexpected to be recognized ratably over a weighted-average periodof 1.9 years.A summary of the transactions under all long-term incentiveplans for the year ended December 31, <strong>2012</strong> follows:Stock Options Stock Appreciation Rights Performance Share UnitsAveragePrice*AveragePrice*AveragePrice**OtherIncentiveShares / Units(SHARES AND UNITS IN THOUSANDS)SharesSharesUnitsOutstanding at:December 31, 2011 21,029 $ 47.63 34,038 $ 66.70 2,962 $ 67.31 1,109Granted 428 75.47 7,909 74.88 1,159 74.71 467Exercised/earned (7,546) 40.36 (2,645) 60.70 (607) 55.82 (207)Cancelled (105) 50.93 (881) 70.88 (723) 60.03 (85)December 31, <strong>2012</strong> 13,806 $ 52.45 38,421 $ 68.70 2,791 $ 74.77 1,284* weighted-average exercise price** weighted-average grant stock priceThe weighted-average grant date fair value of stock optionsand stock appreciation rights granted during <strong>2012</strong>, 2011 and 2010was $19.32, $20.26 and $17.86, respectively. The weightedaveragegrant date fair value of performance share units, which vestupon achieving certain performance metrics, granted during <strong>2012</strong>,2011, and 2010 was $82.15, $87.65 and $78.73, respectively. Thetotal fair value of awards vested during the years endedDecember 31, <strong>2012</strong>, 2011 and 2010 was $187 million, $170 millionand $172 million, respectively. The total intrinsic value (which is theamount by which the stock price exceeded the exercise price onthe date of exercise) of stock options and stock appreciation rightsexercised during the years ended December 31, <strong>2012</strong>, 2011 and2010 was $370 million, $336 million and $446 million, respectively.The total intrinsic value (which is the stock price at vesting) of performanceshare units vested was $46 million, $59 million and $62million during the years ended December 31, <strong>2012</strong>, 2011 and2010, respectively.The following table summarizes information about equityawards outstanding that are vested and expected to vest andequity awards outstanding that are exercisable at December 31,<strong>2012</strong>:Equity Awards Vested and Expected to VestAggregateIntrinsicValueEquity Awards That Are ExercisableAggregateIntrinsicValue(SHARES IN THOUSANDS, AGGREGATE INTRINSIC VALUE IN MILLIONS)AwardsAveragePrice*RemainingTerm** AwardsAveragePrice*RemainingTerm**Stock Options/Stock Appreciation Rights 51,737 $ 63.90 $ 937 5.2 35,142 $ 58.44 $ 828 3.7Performance Share Units/Restricted Stock 3,645 – 299 1.2* weighted-average exercise price per share** weighted-average contractual remaining term in yearsThe fair value of each option award is estimated on thedate of grant using a binomial lattice model. The following tableindicates the assumptions used in estimating fair value for the yearsended December 31, <strong>2012</strong>, 2011 and 2010. Lattice-based optionmodels incorporate ranges of assumptions for inputs, those rangesare as follows:<strong>2012</strong> 2011 2010Expected volatility 30% – 35% 26% – 32% 24% – 28%Weighted-average volatility 30% 26% 25%Expected term (in years) 7.4 – 7.7 7.5 – 8.0 7.4 – 7.9Expected dividends 2.3% 2.4% 2.7%Risk-free rate 0.0% – 2.0% 0.1% – 3.5% 0.1% – 4.0%
Notes to Consolidated Financial Statements <strong>2012</strong> ANNUAL REPORT 87Expected volatilities are based on the returns of our stock,including implied volatilities from traded options on our stock for thebinomial lattice model. We use historical data to estimate equityaward exercise and employee termination behavior within the valuationmodel. Separate employee groups and equity award characteristicsare considered separately for valuation purposes. Theexpected term represents an estimate of the period of time equityawards are expected to remain outstanding. The risk-free rate isbased on the term structure of interest rates at the time of equityaward grant.NOTE 13: RESTRUCTURING COSTSDuring <strong>2012</strong>, we recorded net pre-tax restructuring costs totaling$614 million for new and ongoing restructuring actions. Werecorded charges in the segments as follows:(DOLLARS IN MILLIONS)Otis $ 164UTC Climate, Controls & Security 143Pratt & Whitney 96UTC Aerospace Systems 115Sikorsky 53Eliminations and other 19Restructuring costs recorded within continuing operations 590Restructuring costs recorded within discontinued operations 24Total $ 614The net costs consist of $340 million recorded in cost ofsales, $249 million in selling, general and administrative expenses,$1 million in other income, net, and $24 million in discontinuedoperations. As described below, these charges primarily relate toactions initiated during <strong>2012</strong> and 2011.<strong>2012</strong> Actions. During <strong>2012</strong>, we initiated restructuringactions relating to ongoing cost reduction efforts, including workforcereductions and consolidation of manufacturing operations.We recorded net pre-tax restructuring costs totaling $576 million forrestructuring actions initiated in <strong>2012</strong>, consisting of $313 million incost of sales, $236 million in selling, general and administrativeexpenses, $1 million in other income, net, and $26 million in discontinuedoperations. Additionally, due to the Goodrich acquisition,we assumed restructuring accruals totaling $19 million.We expect the actions that were initiated in <strong>2012</strong> to resultin net workforce reductions of approximately 7,000 hourly and salariedemployees, the exiting of approximately 2.6 million net squarefeet of facilities and the disposal of assets associated with exitedfacilities. As of December 31, <strong>2012</strong>, we have completed, withrespect to the actions initiated in <strong>2012</strong>, net workforce reductions ofapproximately 4,000 employees and 750,000 net square feet offacilities have been exited. We are targeting to complete in 2013the majority of the remaining workforce and all facility related costreduction actions initiated in <strong>2012</strong>. No specific plans for significantother actions have been finalized at this time.The following table summarizes the accrual balances andutilization by cost type for the <strong>2012</strong> restructuring actions:(DOLLARS IN MILLIONS)SeveranceAssetWrite-DownsFacility Exit,LeaseTerminationand OtherCostsTotalNet pre-tax restructuring charges $ 452 $ 14 $ 110 $ 576Restructuring accruals assumedfrom Goodrich 19 – – 19Utilization and foreign exchange (182) (14) (60) (256)Balance at December 31, <strong>2012</strong> $ 289 $ – $ 50 $ 339The following table summarizes expected, incurred andremaining costs for the <strong>2012</strong> restructuring actions by type:(DOLLARS IN MILLIONS)SeveranceAssetWrite-DownsFacility Exit,LeaseTerminationand OtherCostsTotalExpected costs $ 475 $ 14 $ 192 $ 681Costs incurred during <strong>2012</strong> (452) (14) (110) (576)Remaining costs atDecember 31, <strong>2012</strong> $ 23 $ – $ 82 $ 105The following table summarizes expected, incurred andremaining costs for the <strong>2012</strong> restructuring actions by segment:(DOLLARS IN MILLIONS)ExpectedCostsCostsIncurredDuring<strong>2012</strong>RemainingCosts atDecember 31,<strong>2012</strong>Otis $ 164 $ (146) $ 18UTC Climate, Controls & Security 164 (123) 41Pratt & Whitney 103 (94) 9UTC Aerospace Systems 155 (121) 34Sikorsky 50 (47) 3Eliminations and other 19 (19) –Discontinued operations 26 (26) –Total $ 681 $ (576) $ 1052011 Actions. During <strong>2012</strong>, we recorded net pre-taxrestructuring costs totaling $53 million for restructuring actions initiatedin 2011, consisting of $33 million in cost of sales, $19 millionin selling, general and administrative expenses, and $1 million indiscontinued operations. The 2011 actions relate to ongoing costreduction efforts, including workforce reductions and the consolidationof field operations.
88 UNITED TECHNOLOGIES CORPORATIONAs of December 31, <strong>2012</strong>, we have completed net workforcereductions of approximately 4,200 employees of an expected4,900, and have exited 200,000 net square feet of facilities of anexpected 2 million net square feet. The remaining workforce andfacility reduction actions are targeted for completion during 2013.The following table summarizes the restructuring accrualbalances and utilization by cost type for the 2011 programs:(DOLLARS IN MILLIONS)SeveranceAssetWrite-DownsFacility Exit,LeaseTerminationand OtherCostsTotalRestructuring accruals atJanuary 1, <strong>2012</strong> $ 144 $ – $ 10 $ 154Net pre-tax restructuring charges 30 1 22 53Utilization and foreign exchange (138) (1) (26) (165)Balance at December 31, <strong>2012</strong> $ 36 $ – $ 6 $ 42The following table summarizes expected, incurred and remainingcosts for the 2011 programs by type:(DOLLARS IN MILLIONS)SeveranceAssetWrite-DownsFacility Exit,LeaseTerminationand OtherCostsTotalExpected costs $ 296 $ 5 $ 67 $ 368Costs incurred during 2011 (259) (4) (23) (286)Costs incurred during <strong>2012</strong> (30) (1) (22) (53)Remaining costs atDecember 31, <strong>2012</strong> $ 7 $ – $ 22 $ 29The following table summarizes expected, incurred and remainingcosts for the 2011 programs by segment:(DOLLARS IN MILLIONS)ExpectedCostsCostsIncurredDuring2011CostsIncurredDuring<strong>2012</strong>RemainingCosts atDecember 31,<strong>2012</strong>Otis $ 104 $ (76) $ (19) $ 9UTC Climate, Controls & Security 119 (93) (25) 1Pratt & Whitney 47 (37) (3) 7UTC Aerospace Systems 8 (8) – –Sikorsky 66 (51) (5) 10Discontinued operations 24 (21) (1) 2Total $ 368 $ (286) $ (53) $ 29NOTE 14: FINANCIAL INSTRUMENTSWe enter into derivative instruments for risk management purposesonly, including derivatives designated as hedging instruments underthe Derivatives and Hedging Topic of the FASB ASC and those utilizedas economic hedges. We operate internationally and, in thenormal course of business, are exposed to fluctuations in interestrates, foreign exchange rates and commodity prices. These fluctuationscan increase the costs of financing, investing and operatingthe business. We have used derivative instruments, includingswaps, forward contracts and options to manage certain foreigncurrency, interest rate and commodity price exposures.By their nature, all financial instruments involve market andcredit risks. We enter into derivative and other financial instrumentswith major investment grade financial institutions and have policiesto monitor the credit risk of those counterparties. We limit counterpartyexposure and concentration of risk by diversifying counterparties.While there can be no assurance, we do not anticipate anymaterial non-performance by any of these counterparties.Foreign Currency Forward Contracts. We manage ourforeign currency transaction risks to acceptable limits through theuse of derivatives that hedge forecasted cash flows associated withforeign currency transaction exposures which are accounted for ascash flow hedges, as deemed appropriate. To the extent thesederivatives are effective in offsetting the variability of the hedgedcash flows, and otherwise meet the hedge accounting criteria of theDerivatives and Hedging Topic of the FASB ASC, changes in thederivatives’ fair values are not included in current earnings but areincluded in “Accumulated other comprehensive loss”. Thesechanges in fair value will subsequently be reclassified into earningsas a component of product sales or expenses, as applicable, whenthe forecasted transaction occurs. To the extent that a previouslydesignated hedging transaction is no longer an effective hedge, anyineffectiveness measured in the hedging relationship is recordedcurrently in earnings in the period it occurs.To the extent the hedge accounting criteria are not met,the foreign currency forward contracts are utilized as economichedges and changes in the fair value of these contracts arerecorded currently in earnings in the period in which they occur.These include hedges that are used to reduce exchange rate risksarising from the change in fair value of certain foreign currencydenominated assets and liabilities (e.g. payables, receivables) andother economic hedges where the hedge accounting criteria werenot met.The four quarter rolling average of the notional amount offoreign exchange contracts hedging foreign currency transactionswas $11.8 billion and $10.4 billion at December 31, <strong>2012</strong> and2011, respectively.Additional information pertaining to foreign exchange andhedging activities is included in Note 1.We enter into transactions that are subject to enforceablemaster netting arrangements or other similar agreements with variouscounterparties. However, we have not elected to offset multiplecontracts with a single counterparty and, as a result, the fair valueof the derivative instruments in a loss position is not offset againstthe fair value of derivative instruments in a gain position.
Notes to Consolidated Financial Statements <strong>2012</strong> ANNUAL REPORT 89The following table summarizes the fair value of derivativeinstruments as of December 31, <strong>2012</strong> and December 31, 2011which consist solely of foreign exchange contracts:(DOLLARS IN MILLIONS)December 31, <strong>2012</strong> December 31, 2011Derivativesdesignatedas hedginginstrumentsDerivatives notdesignated ashedginginstrumentsDerivativesdesignatedas hedginginstrumentsDerivatives notdesignated ashedginginstrumentsBalance Sheet AssetLocations:Other assets,current $ 48 $ 47 $ 69 $ 40Other assets 30 3 3 278 50 72 42Total Asset DerivativeContracts $ 128 $ 114Balance SheetLiability Locations:Accrued liabilities $ 10 $ 136 $ 81 $ 40Other long-termliabilities 1 2 43 111 138 124 41Total LiabilityDerivative Contracts $ 149 $ 165The impact from foreign exchange derivative instruments that qualifiedas cash flow hedges for the period was as follows:December 31,(DOLLARS IN MILLIONS) <strong>2012</strong> 2011Gain (loss) recorded in Accumulated other comprehensiveloss $ 88 $ (46)Gain reclassified from Accumulated other comprehensiveloss into Product sales (effective portion) 31 96Assuming current market conditions continue, a $40 millionpre-tax gain is expected to be reclassified from Accumulated othercomprehensive loss into Product sales to reflect the fixed pricesobtained from foreign exchange hedging within the next 12 months.At December 31, <strong>2012</strong>, all derivative contracts accounted for ascash flow hedges mature by December 2015.The effect on the Consolidated Statement of Operationsfrom foreign exchange contracts not designated as hedginginstruments was as follows:December 31,(DOLLARS IN MILLIONS) <strong>2012</strong> 2011Loss recognized in Other income, net $ (120) $ (39)clarifies many of the existing concepts for measuring fair value anddoes not result in a change in our application of the FASB ASCTopic “Fair Value Measurements and Disclosures.” The guidanceincludes enhanced disclosure requirements about recurring Level 3fair value measurements for each class of assets and liabilitiesmeasured at fair value in the balance sheet, which has no impacton our financial statements or disclosures as there are presently noLevel 3 fair value measurements in our Consolidated BalanceSheet. This ASU also requires additional disclosures for items thatare not measured at fair value in the balance sheet but for whichthe fair value is required to be disclosed.Valuation Hierarchy. The FASB ASC Topic “Fair ValueMeasurements and Disclosure” establishes a valuation hierarchy fordisclosure of the inputs to the valuations used to measure fair value.This hierarchy prioritizes the inputs into three broad levels as follows:Level 1 inputs are quoted prices (unadjusted) in active marketsfor identical assets or liabilities. Level 2 inputs are quotedprices for similar assets and liabilities in active markets, quotedprices for identical or similar assets in markets that are not active,inputs other than quoted prices that are observable for the asset orliability, including interest rates, yield curves and credit risks, orinputs that are derived principally from or corroborated byobservable market data through correlation. Level 3 inputs areunobservable inputs based on our own assumptions used tomeasure assets and liabilities at fair value. A financial asset or liability’sclassification within the hierarchy is determined based on thelowest level input that is significant to the fair value measurement.The following table provides the assets and liabilities carriedat fair value measured on a recurring basis as of December 31,<strong>2012</strong> and 2011:(DOLLARS IN MILLIONS)TotalCarryingValue atDecember 31,<strong>2012</strong>Quotedprice inactivemarkets(Level 1)Significantotherobservableinputs(Level 2)Unobservableinputs(Level 3)Recurring fair valuemeasurements:Available-for-salesecurities $ 781 $ 781 $ – $ –Derivative assets 128 – 128 –Derivative liabilities (149) – (149) –Nonrecurring fairvalue measurements:Equity methodinvestments 432 – 432 –Businessdispositions 84 – 84 –Fair Value Disclosure. As of January 1, <strong>2012</strong>, weadopted the provisions of the FASB issued ASU No. 2011-04,“Amendments to Achieve Common Fair Value Measurement andDisclosure Requirements in U.S. GAAP and IFRSs.” This ASU
90 UNITED TECHNOLOGIES CORPORATIONDuring <strong>2012</strong>, we recorded net gains on nonrecurring fairvalue measurements of approximately $157 million within Otherincome, net from UTC Climate, Controls & Security’s ongoing portfoliotransformation efforts including the integration of the legacyUTC Fire & Security businesses with the legacy Carrier businesses.These net gains include approximately $357 million from the salesof controlling interests in manufacturing and distribution joint venturesin Asia and Canada, of which approximately $272 million wasnon-cash. These gains were partially offset by $168 million of otherthan-temporaryimpairment charges related to business dispositionsand a $32 million loss on the disposition of the U.S. UTCFire & Security branch operations. In addition, we recorded a $34million gain on the fair market measurement of the Company’s previouslyheld interest in Goodrich.(DOLLARS IN MILLIONS)TotalCarryingValue atDecember 31,2011Quotedprice inactivemarkets(Level 1)Significantotherobservableinputs(Level 2)Unobservableinputs(Level 3)Recurring fair valuemeasurements:Available-for-salesecurities $ 926 $ 926 $ – $ –Derivative assets 114 – 114 –Derivative liabilities (165) – (165) –Nonrecurring fairvalue measurements:Equity methodinvestment 13 13 – –During 2011, we recorded a non-cash other-thantemporaryimpairment charge of $66 million within Other income,net on an equity investment. The impairment charge recorded onour investment was determined by comparing the carrying value ofour investment to the closing market value of the shares on thedate the investment was deemed to be impaired.Valuation Techniques. Our available-for-sale securitiesinclude equity investments that are traded in active markets, eitherdomestically or internationally. They are measured at fair value usingclosing stock prices from active markets and are classified withinLevel 1 of the valuation hierarchy. Our derivative assets andliabilities include foreign exchange contracts and commodityderivatives that are measured at fair value using internal modelsbased on observable market inputs such as forward rates, interestrates, our own credit risk and our counterparties’ credit risks.Based on these inputs, the derivative assets and liabilities areclassified within Level 2 of the valuation hierarchy. Based on ourcontinued ability to trade securities and enter into forward contracts,we consider the markets for our fair value instruments to beactive. As of December 31, <strong>2012</strong>, there were no significant transfersin and out of Level 1 and Level 2.As of December 31, <strong>2012</strong>, there has not been any significantimpact to the fair value of our derivative liabilities due to ourown credit risk. Similarly, there has not been any significant adverseimpact to our derivative assets based on our evaluation of ourcounterparties’ credit risks.The following table provides carrying amounts and fairvalues of financial instruments that are not carried at fair value atDecember 31, <strong>2012</strong> and 2011:(DOLLARS IN MILLIONS)December 31, <strong>2012</strong> December 31, 2011CarryingAmountFairValueCarryingAmountFairValueLong-termreceivables $ 499 $ 464 $ 283 $ 276Customer financingnotes receivable 375 371 309 297Short-termborrowings (503) (503) (630) (630)Long-term debt(excluding capitalizedleases) (22,665) (25,606) (9,575) (11,639)Long-term liabilities (182) (167) – –The following table provides the valuation hierarchy classificationof assets and liabilities that are not carried at fair value inour Consolidated Balance Sheet as of December 31, <strong>2012</strong>:(DOLLARS IN MILLIONS)Total FairValue atDecember 31,<strong>2012</strong>Quoted pricein activemarkets(Level 1)Significantotherobservableinputs(Level 2)Unobservableinputs(Level 3)Long-termreceivables $ 464 $ – $ 464 $ –Customer financingnotes receivable 371 – 371 –Short-termborrowings (503) – (320) (183)Long-term debt(excluding capitalizedleases) (25,606) – (25,548) (58)Long-term liabilities (167) – (167) –Valuation Techniques. Our long-term receivables andcustomer financing notes receivable include our commercial andaerospace long-term trade, government and other receivables,leases, and notes receivable. Our long-term liabilities include ouraerospace long-term customer payments. Our long-term receivables,customer financing notes receivable and long-term liabilitiesare measured at fair value using an income approach based on thepresent value of the contractual, promised or most likely cash flowsdiscounted at observed or estimated market rates for comparableassets or liabilities that are traded in the market. Based on theseinputs, long-term receivables, customer financing notes receivableand long-term liabilities are classified within Level 2 of the valuationhierarchy. Our short-term borrowings include commercial paperand other international credit facility agreements. Our long-termdebt includes domestic and international notes. Commercial paperand domestic long-term notes are measured at fair values based oncomparable transactions and current market interest rates quotedin active markets for similar assets, and are classified within Level 2of the valuation hierarchy. Foreign short-term borrowings and for-
Notes to Consolidated Financial Statements <strong>2012</strong> ANNUAL REPORT 91eign long-term notes are measured at fair value based on comparabletransactions and rates calculated from the respective countries’yield curves. Based on these inputs, foreign borrowings andforeign long-term notes are classified within Level 3 of the valuationhierarchy. The fair values of Accounts receivable and Accountspayable approximate the carrying amounts due to the short-termmaturities of these instruments.We had commercial aerospace financing and other contractualcommitments totaling approximately $10.9 billion atDecember 31, <strong>2012</strong>, which now include approximately $5.8 billionof IAE commitments, related to commercial aircraft and certaincontractual rights to provide product on new aircraft platforms. Wehad commercial aerospace financing and other contractualcommitments of approximately $3.0 billion at December 31, 2011.Risks associated with changes in interest rates on these commitmentsare mitigated by the fact that interest rates are variable duringthe commitment term, and are set at the date of funding basedon current market conditions, the fair value of the underlying collateraland the credit worthiness of the customers. As a result, the fairvalue of these financings is expected to equal the amounts funded.The fair value of the commitment itself is not readily determinableand is not considered significant.NOTE 15: CREDIT QUALITY OF LONG-TERM RECEIVABLESA long-term or financing receivable represents a contractual right toreceive money on demand or on fixed and determinable dates,including trade receivable balances with maturity dates greater thanone year. Our long-term and financing receivables primarily representbalances related to the aerospace businesses such as longtermtrade accounts receivable, leases, and notes receivable. Wealso have other long-term receivables in our commercial businesses;however, both the individual and aggregate amounts arenot significant.Long-term trade accounts receivable represent amountsarising from the sale of goods and services with a contractualmaturity date of greater than one year and are recognized as “Otherassets” in our Consolidated Balance Sheet. Notes and leasesreceivable represent notes and lease receivables other than receivablesrelated to operating leases, and are recognized as “Customerfinancing assets” in our Consolidated Balance Sheet. The followingtable summarizes the balance by class of aerospace long-termreceivables as of December 31, <strong>2012</strong> and 2011:The increases reflected above as of December 31, <strong>2012</strong>,as compared to December 31, 2011, primarily reflect the impacts ofthe Goodrich acquisition and our consolidation of IAE. See Note 2for further discussion related to acquisitions.Economic conditions and air travel influence the operatingenvironment for most airlines, and the financial performance of ouraerospace businesses is directly tied to the economic conditions ofthe commercial aerospace and defense industries. Additionally, thevalue of the collateral is also closely tied to commercial airline performanceand may be subject to exposure of reduced valuation asa result of market declines. We determine a receivable is impairedwhen, based on current information and events, it is probable thatwe will be unable to collect amounts due according to the contractualterms of the receivable agreement. Factors considered inassessing collectability and risk include, but are not limited to,examination of credit quality indicators and other evaluation measures,underlying value of any collateral or security interests, significantpast due balances, historical losses, and existing economicconditions.Long-term receivables can be considered delinquent ifpayment has not been received in accordance with the underlyingagreement. If determined delinquent, long-term trade accountsreceivable and notes and leases receivable balances accruinginterest may be placed on nonaccrual status. We record potentiallosses related to long-term receivables when identified. The reservefor credit losses on these receivables relates to specifically identifiedreceivables that are evaluated individually for impairment. For notesand leases receivable we determine a specific reserve for exposurebased on the difference between the carrying value of the receivableand the estimated fair value of the related collateral in connectionwith the evaluation of credit risk and collectability. For longtermtrade accounts receivable we evaluate credit risk andcollectability individually to determine if an allowance is necessary.Uncollectible long-term receivables are written-off when collectionof the indebtedness has been pursued for a reasonable period oftime without collection; the customer is no longer in operation; orjudgment has been levied, but the underlying assets are notadequate to satisfy the indebtedness. At both December 31, <strong>2012</strong>and 2011, we do not have any significant balances that are consideredto be delinquent, on non-accrual status, past due 90 days ormore, or considered to be impaired.(DOLLARS IN MILLIONS)December 31,<strong>2012</strong>December 31,2011Long-term trade accounts receivable $ 593 $ 204Notes and leases receivable 584 365Total long-term receivables $ 1,177 $ 569
92 UNITED TECHNOLOGIES CORPORATIONThe following table provides the balance of aerospacelong-term receivables and summarizes the associated changes inthe reserve for estimated credit losses and exposure for the yearsended December 31, <strong>2012</strong> and 2011, respectively:(DOLLARS IN MILLIONS) <strong>2012</strong> 2011Beginning balance of the reserve for credit losses andexposure as of January 1 $ 70 $ 42Provision 1 25Charge-offs – –Recoveries (5) (9)Other (6) 12Ending balance of the reserve for credit losses andexposure: individually evaluated for impairment as ofDecember 31 $ 60 $ 70Ending balance of long-term receivables: individuallyevaluated for impairment as of December 31 $ 1,177 $ 569NOTE 16: GUARANTEESWe extend a variety of financial guarantees to third parties. As ofDecember 31, <strong>2012</strong> and 2011 the following financial guaranteeswere outstanding:(DOLLARS IN MILLIONS)MaximumPotentialPayment<strong>2012</strong> 2011CarryingAmount ofLiabilityMaximumPotentialPaymentCarryingAmount ofLiabilityIAE’s financingarrangements* (See Note 5) $ – $ – $ 989 $ 20Commercial aerospacefinancing arrangements (SeeNote 5) 346 7 323 30Credit facilities and debtobligations—unconsolidatedsubsidiaries (expire 2013 to2034) 240 2 239 3Performance guarantees 33 – 33 –We determine credit ratings for each customer in the portfoliobased upon public information and information obtained directlyfrom our customers. We conduct a review of customer credit ratings,published historical credit default rates for different ratingcategories, and multiple third party aircraft value publications as abasis to validate the reasonableness of the allowance for losses onthese balances quarterly or when events and circumstances warrant.The credit ratings listed below range from “A” which indicatesan extremely strong capacity to meet financial obligations and thereceivable is either collateralized or uncollateralized, to “D” whichindicates that payment is in default and the receivable isuncollateralized. There can be no assurance that actual results willnot differ from estimates or that consideration of these factors in thefuture will not result in an increase or decrease to the allowance forcredit losses on long-term receivables.The following table summarizes the credit risk profile bycreditworthiness category for aerospace long-term receivablebalances at December 31, <strong>2012</strong> and 2011:(DOLLARS IN MILLIONS)December 31, <strong>2012</strong> December 31, 2011Long-termtradeaccountsreceivableNotes andleasesreceivableLong-termtradeaccountsreceivableNotes andleasesreceivableA—(low risk, collateralized/uncollateralized) $ 569 $ 26 $ 201 $ –B—(moderate risk,collateralized/uncollateralized) 21 458 3 295C—(high risk, collateralized/uncollateralized) 3 100 – 70D—(in default,uncollateralized) – – – –Total $ 593 $ 584 $ 204 $ 365* Represents IAE’s gross obligation; at December 31, 2011 our proportionate share ofIAE’s obligations was 33%. As disclosed in Note 2, on June 29, <strong>2012</strong> Pratt &Whitney, Rolls-Royce, MTU and JAEC, completed a restructuring of their interests inIAE and as a result, we now consolidate IAE.We also have obligations arising from sales of certain businessesand assets, including those from representations and warrantiesand related indemnities for environmental, health and safety,tax and employment matters. The maximum potential paymentrelated to these obligations is not a specified amount as a numberof the obligations do not contain financial caps. The carryingamount of liabilities related to these obligations was $144 millionand $138 million at December 31, <strong>2012</strong> and 2011, respectively. Foradditional information regarding the environmental indemnifications,see Note 18.We accrue for costs associated with guarantees when it isprobable that a liability has been incurred and the amount can bereasonably estimated. The most likely cost to be incurred isaccrued based on an evaluation of currently available facts, andwhere no amount within a range of estimates is more likely, theminimum is accrued. In accordance with the FASB ASC Topic“Guarantees” of FASB ASC, we record a liability for the fair value ofsuch guarantees in the balance sheet.We provide service and warranty policies on our productsand extend performance and operating cost guarantees beyondour normal service and warranty policies on some of our products,particularly commercial aircraft engines. In addition, we incur discretionarycosts to service our products in connection with specificproduct performance issues. Liabilities for performance and operatingcost guarantees are based upon future product performanceand durability, and are largely estimated based upon historicalexperience. Adjustments are made to accruals as claim data andhistorical experience warrant. The changes in the carrying amount
Notes to Consolidated Financial Statements <strong>2012</strong> ANNUAL REPORT 93of service and product warranties and product performance guaranteesfor the years ended December 31, <strong>2012</strong> and 2011 are asfollows:(DOLLARS IN MILLIONS) <strong>2012</strong> 2011Balance as of January 1 $ 1,468 $ 1,136Warranties and performance guarantees issued 325 475Settlements made (277) (440)Other (184) 297Balance as of December 31 $ 1,332 $ 1,468The decrease in the above table in “Other” during the yearended December 31, <strong>2012</strong> primarily reflects a decrease for Clipperwarranty reserves as a result of the sale of the company, partiallyoffset by an increase from the Goodrich acquisition. See Note 3and Note 2, respectively, for further discussion. The increasereflected in “Other” during the year ended December 31, 2011primarily reflected the impact of finalizing purchase accounting onthe original acquisition of Clipper.NOTE 17: COLLABORATIVE ARRANGEMENTSIn view of the risks and costs associated with developing newengines, Pratt & Whitney has entered into certain collaborationarrangements in which sales, costs and risks are shared. Salesgenerated from engine programs, spare parts, and aftermarketbusiness under collaboration arrangements are recorded as earnedin our financial statements. Amounts attributable to our collaboratorsfor their share of sales are recorded as an expense in ourfinancial statements based upon the terms and nature of thearrangement. Costs associated with engine programs undercollaborative arrangements are expensed as incurred. Under thesearrangements, collaborators contribute their program share ofengine parts, incur their own production costs and make certainpayments to Pratt & Whitney for shared or joint program costs. Thereimbursement of the collaborators’ share of program costs isrecorded as a reduction of the related expense item at that time. Asof December 31, <strong>2012</strong>, the collaborators’ interests in all commercialengine programs ranged from 14% to 48%, inclusive of a portion ofPratt & Whitney’s interests held by other participants. Pratt & Whitneyis the principal participant in all existing collaborative arrangements.There are no individually significant collaborativearrangements and none of the collaborators exceed a 31% share inan individual program.On June 29, <strong>2012</strong>, Pratt & Whitney, Rolls-Royce, MTU, andJAEC, participants in the IAE collaboration, completed a restructuringof their interests in IAE. Under the terms of the agreement,Rolls-Royce sold its ownership and collaboration interests in IAE toPratt & Whitney, while also entering into an agreement to license itsV2500 intellectual property to Pratt & Whitney. In exchange for theincreased ownership and collaboration interests and intellectualproperty license, Pratt & Whitney paid Rolls-Royce $1.5 billion atclosing with additional payments due to Rolls-Royce conditionalupon each hour flown by V2500-powered aircraft in service at theclosing date of the purchase from Rolls-Royce during the fifteenyear period following closing of the purchase. The collaborationinterest and intellectual property licenses are reflected as intangibleassets and will be amortized in relation to the economic benefitsreceived over the remaining estimated 30 year life of the V2500program. Rolls-Royce will continue to support the program as astrategic supplier for the V2500 engine and continue to manufactureparts and assemble engines. Pratt & Whitney entered into acollaboration arrangement with MTU with respect to a portion of theacquired collaboration interest in IAE for consideration of approximately$233 million with additional payments due to Pratt & Whitneyin the future. As a result of these transactions, Pratt & Whitneyholds a 61% net interest in the collaboration and a 49.5% ownershipinterest in IAE. Please see Note 2 for further discussion ofchanges in the IAE collaboration arrangement.The following table illustrates the income statement classificationand amounts attributable to transactions arising from thecollaborative arrangements between participants for each periodpresented:(DOLLARS IN MILLIONS) <strong>2012</strong> 2011 2010Collaborator share of sales:Cost of products sold $ 1,295 $ 963 $ 850Cost of services sold 216 36 38Collaborator share of program costs(reimbursement of expenses incurred):Cost of products sold (97) (88) (83)Research and development (203) (220) (135)Selling, general and administrative (7) (4) (5)NOTE 18: CONTINGENT LIABILITIESLeases. We occupy space and use certain equipment under leasearrangements. Rental commitments of $2,486 million atDecember 31, <strong>2012</strong> under long-term non-cancelable operatingleases are payable as follows: $646 million in 2013, $510 million in2014, $378 million in 2015, $255 million in 2016, $158 million in2017 and $539 million thereafter. Rent expense was $457 million in<strong>2012</strong>, $453 million in 2011 and $445 million in 2010.Additional information pertaining to commercial aerospacerental commitments is included in Note 5 to the ConsolidatedFinancial Statements.Environmental. Our operations are subject to environmentalregulation by federal, state and local authorities in the <strong>United</strong>States and regulatory authorities with jurisdiction over our foreignoperations. As described in Note 1 to the Consolidated FinancialStatements, we have accrued for the costs of environmentalremediation activities and periodically reassess these amounts. Webelieve that the likelihood of incurring losses materially in excess ofamounts accrued is remote. At December 31, <strong>2012</strong>, we had $847
94 UNITED TECHNOLOGIES CORPORATIONmillion reserved for environmental remediation. Additionalinformation pertaining to environmental matters is included in Note1 to the Consolidated Financial Statements.Government. We are now, and believe that in light of thecurrent U.S. Government contracting environment we will continueto be, the subject of one or more U.S. Government investigations. Ifwe or one of our business units were charged with wrongdoing as aresult of any of these investigations or other government investigations(including violations of certain environmental or exportlaws) the U.S. Government could suspend us from bidding on orreceiving awards of new U.S. Government contracts pending thecompletion of legal proceedings. If convicted or found liable, theU.S. Government could fine and debar us from new U.S. Governmentcontracting for a period generally not to exceed three years.The U.S. Government could void any contracts found to be taintedby fraud.Our contracts with the U.S. Government are also subject toaudits. Like many defense contractors, we have received auditreports, which recommend that certain contract prices should bereduced to comply with various government regulations. Some ofthese audit reports involved substantial amounts. We have madevoluntary refunds in those cases we believe appropriate, have settledsome allegations and continue to litigate certain cases. In addition,we accrue for liabilities associated with those matters that areprobable and can be reasonably estimated. The most likely settlementamount to be incurred is accrued based upon a range ofestimates. Where no amount within a range of estimates is morelikely, then we accrued the minimum amount.As previously disclosed, the U.S. Department of Justice(DOJ) sued us in 1999 in the U.S. District Court for the SouthernDistrict of Ohio, claiming that Pratt & Whitney violated the civil FalseClaims Act and common law. This lawsuit relates to the “FighterEngine Competition” between Pratt & Whitney’s F100 engine andGeneral Electric’s F110 engine. The DOJ alleges that the governmentoverpaid for F100 engines under contracts awarded by theU.S. Air Force in fiscal years 1985 through 1990 because Pratt &Whitney inflated its estimated costs for some purchased parts andwithheld data that would have revealed the overstatements. At trialof this matter, completed in December 2004, the governmentclaimed Pratt & Whitney’s liability to be $624 million. On August 1,2008, the trial court judge held that the Air Force had not sufferedany actual damages because Pratt & Whitney had made significantprice concessions. However, the trial court judge found that Pratt &Whitney violated the False Claims Act due to inaccurate statementscontained in its 1983 offer. In the absence of actual damages, thetrial court judge awarded the DOJ the maximum civil penalty of$7.09 million, or $10,000 for each of the 709 invoices Pratt & Whitneysubmitted in 1989 and later under the contracts. In September2008, both the DOJ and UTC appealed the decision to the SixthCircuit Court of Appeals. In November 2010, the Sixth Circuitaffirmed Pratt & Whitney’s liability under the False Claims Act andremanded the case to the trial court for further proceedings.On June 18, <strong>2012</strong>, the trial court found that Pratt & Whitneyhad breached other obligations imposed by common lawbased on the same conduct with respect to which the court previouslyfound liability under the False Claims Act. Under the commonlaw claims, the U.S. Air Force may seek damages for eventsoccurring before March 3, 1989, which are not recoverable underthe False Claims Act. Further proceedings at the trial court willdetermine the damages, if any, relating to the False Claims Act andcommon law claims. The government continues to seek damagesof $624 million, plus interest. Pratt & Whitney continues to contendthat the government suffered no actual damages. The parties havesubmitted briefs and await a decision from the trial court. Shouldthe government ultimately prevail, the outcome of this matter couldresult in a material adverse effect on our results of operations in theperiod in which a liability would be recognized or cash flows for theperiod in which damages would be paid.As previously disclosed, in December 2008, the Departmentof Defense (DOD) issued a contract claim against Sikorsky torecover overpayments the DOD alleges it has incurred since January2003 in connection with cost accounting changes approvedby the DOD and implemented by Sikorsky in 1999 and 2006. Thesechanges relate to the calculation of material overhead rates in governmentcontracts. The DOD claims that Sikorsky’s liability isapproximately $94 million (including interest through December 31,<strong>2012</strong>). We believe this claim is without merit and Sikorsky filed anappeal in December 2009 with the U.S. Court of Federal Claims.Trial in the matter concluded in January 2013 and we await a decisionfrom the court. We do not believe the resolution of this matterwill have a material adverse effect on our competitive position,results of operations, cash flows or financial condition.As previously disclosed, UTC has been involved in administrativereview proceedings with the German Tax Office concerning€203 million (approximately $270 million) of tax benefits that wehave claimed related to a 1998 reorganization of the corporatestructure of Otis operations in Germany. A portion of these taxbenefits were disallowed by the local German Tax Office on July 5,<strong>2012</strong>, as a result of the audit of tax years 1999 to 2000. The legaland factual issues relating to the denial of the tax benefits center onthe interpretation and application of a German tax law. OnAugust 3, <strong>2012</strong>, the Company filed suit in the local German taxcourt and intends to litigate vigorously the matter to conclusion. Wedo not believe the resolution of this matter will have a materialadverse effect on our results of operations, cash flows or financialcondition.
Notes to Consolidated Financial Statements <strong>2012</strong> ANNUAL REPORT 95Other. Except as otherwise noted, we do not believe thatresolution of any of the above matters will have a material adverseeffect upon our competitive position, results of operations, cashflows or financial condition.As described in Note 16 to the Consolidated FinancialStatements, we extend performance and operating cost guaranteesbeyond our normal warranty and service policies for extended periodson some of our products. We have accrued our estimate of theliability that may result under these guarantees and for service coststhat are probable and can be reasonably estimated.We have accrued for environmental investigatory,remediation, operating and maintenance costs, performance guaranteesand other litigation and claims based on our estimate of theprobable outcome of these matters. While it is possible that theoutcome of these matters may differ from the recorded liability, webelieve that resolution of these matters will not have a materialimpact on our competitive position, results of operations, cashflows or financial condition.We also have other commitments and contingent liabilitiesrelated to legal proceedings, self-insurance programs and mattersarising out of the normal course of business. We accrue contingenciesbased upon a range of possible outcomes. If no amountwithin this range is a better estimate than any other, then we accruethe minimum amount.We are also subject to a number of routine lawsuits, investigationsand claims (some of which involve substantial amounts)arising out of the ordinary course of our business. We do notbelieve that these matters will have a material adverse effect uponour competitive position, results of operations, cash flows or financialcondition.NOTE 19: SEGMENT FINANCIAL DATAOur operations for the periods presented herein are classified intofive principal segments. The segments are generally determinedbased on the management structure of the businesses and thegrouping of similar operating companies, where each managementorganization has general operating autonomy over diversified productsand services.Otis products include elevators, escalators, moving walkwaysand service sold to customers in the commercial and residentialproperty industries around the world.UTC Climate, Controls & Security products and relatedservices include HVAC and refrigeration systems, building controlsand automation, fire and special hazard suppression systems andequipment, security monitoring and rapid response systems, providedto a diversified international customer base principally in theindustrial, commercial and residential property and commercialtransportation sectors.Pratt & Whitney products include commercial, military,business jet and general aviation aircraft engines, parts and services,industrial gas turbines, sold to a diversified customer base,including international and domestic commercial airlines and aircraftleasing companies, aircraft manufacturers, and U.S. and foreigngovernments. Pratt & Whitney also provides product support and afull range of overhaul, repair and fleet management services andproduces land-based power generation equipment.Effective July 1, <strong>2012</strong>, the auxiliary power unit business(APU) of the UTC Aerospace Systems business segment was transferredto the Pratt & Whitney business segment. The APU businessdesigns and manufactures a variety of products for commercial andmilitary aircraft. <strong>Annual</strong> sales for the APU business are approximately$600 million. The reclassification has been made prospectively;prior year results have not been restated for the transferof the business.UTC Aerospace Systems provides aerospace productsand aftermarket services for commercial, military, business jet andgeneral aviation customers worldwide. Products include electricpower generation, management and distribution systems, flightcontrol systems, engine control systems, intelligence, surveillanceand reconnaissance systems, engine components, environmentalcontrol systems, fire protection and detection systems, propellersystems, aircraft nacelles, and interior, actuation, landing and electronicsystems.Sikorsky products include military and commercial helicopters,aftermarket helicopter and aircraft parts and services.We have reported our financial and operational results forthe periods presented herein under the five principal segmentsnoted above, consistent with how we have reviewed our businessoperations for decision-making purposes, resource allocation andperformance assessment during <strong>2012</strong>.
96 UNITED TECHNOLOGIES CORPORATIONSegment Information. Total sales by segment include intersegment sales, which are generally made at prices approximating those thatthe selling entity is able to obtain on external sales. Segment information for the years ended December 31 is as follows:Net SalesOperating Profits(DOLLARS IN MILLIONS) <strong>2012</strong> 2011 2010 <strong>2012</strong> 2011 2010Otis $ 12,056 $ 12,437 $ 11,579 $ 2,512 $ 2,815 $ 2,575UTC Climate, Controls & Security 17,090 18,864 17,876 2,425 2,212 1,776Pratt & Whitney 13,964 12,711 12,150 1,589 1,867 1,885UTC Aerospace Systems 8,334 4,760 4,399 944 759 654Sikorsky 6,791 7,355 6,684 712 840 716Total segment 58,235 56,127 52,688 8,182 8,493 7,606Eliminations and other (527) (373) (413) (72) (228) (331)General corporate expenses – – – (426) (419) (377)Consolidated $ 57,708 $ 55,754 $ 52,275 $ 7,684 $ 7,846 $ 6,898Total Assets Capital Expenditures Depreciation & Amortization(DOLLARS IN MILLIONS) <strong>2012</strong> 2011 2010 <strong>2012</strong> 2011 2010 <strong>2012</strong> 2011 2010Otis $ 8,866 $ 8,717 $ 8,097 $ 141 $ 75 $ 55 $ 220 $ 223 $ 211UTC Climate, Controls & Security 22,253 21,630 21,837 265 305 234 418 432 457Pratt & Whitney 15,938 10,705 10,139 462 290 321 324 332 340UTC Aerospace Systems 35,589 8,593 8,540 367 163 117 412 172 172Sikorsky 4,975 4,628 4,521 94 92 108 85 84 83Total segment 87,621 54,273 53,134 1,329 925 835 1,459 1,243 1,263Eliminations and other 1,788 7,179 5,359 60 4 3 65 20 37Consolidated $ 89,409 $ 61,452 $ 58,493 $ 1,389 $ 929 $ 838 $ 1,524 $ 1,263 $ 1,300Geographic External Sales and Operating Profit. Geographic external sales and operating profits are attributed to the geographicregions based on their location of origin. U.S. external sales include export sales to commercial customers outside the U.S. andsales to the U.S. Government, commercial and affiliated customers, which are known to be for resale to customers outside the U.S. Longlivedassets are net fixed assets attributed to the specific geographic regions.External Net Sales Operating Profits Long-Lived Assets(DOLLARS IN MILLIONS) <strong>2012</strong> 2011 2010 <strong>2012</strong> 2011 2010 <strong>2012</strong> 2011 2010<strong>United</strong> States Operations $ 32,175 $ 28,993 $ 27,547 $ 3,663 $ 4,264 $ 3,839 $ 4,311 $ 2,974 $ 3,013International OperationsEurope 11,823 12,344 11,678 2,100 2,089 1,858 1,804 1,210 1,282Asia Pacific 8,733 9,016 7,658 1,648 1,429 1,152 947 883 839Other 4,964 5,376 5,369 772 711 757 1,122 760 804Eliminations and other 13 25 23 (499) (647) (708) 334 374 342Consolidated $ 57,708 $ 55,754 $ 52,275 $ 7,684 $ 7,846 $ 6,898 $ 8,518 $ 6,201 $ 6,280Sales from U.S. operations include export sales as follows:(DOLLARS IN MILLIONS) <strong>2012</strong> 2011 2010Europe $ 3,117 $ 2,284 $ 1,902Asia Pacific 2,998 2,448 2,641Other 3,086 2,989 2,559$ 9,201 $ 7,721 $ 7,102Major Customers. Net Sales include sales under primecontracts and subcontracts to the U.S. Government, primarilyrelated to Pratt & Whitney, UTC Aerospace Systems and Sikorskyproducts, as follows:(DOLLARS IN MILLIONS) <strong>2012</strong> 2011 2010Pratt & Whitney $ 3,718 $ 2,995 $ 3,339UTC Aerospace Systems 1,742 1,021 1,115Sikorsky 4,512 4,967 4,529Other 126 125 151$ 10,098 $ 9,108 $ 9,134
Notes to Consolidated Financial Statements <strong>2012</strong> ANNUAL REPORT 97SELECTED QUARTERLY FINANCIAL DATA (UNAUDITED)<strong>2012</strong> Quarters 2011 Quarters(DOLLARS IN MILLIONS, EXCEPT PER SHARE AMOUNTS) First Second Third Fourth First Second Third FourthNet Sales $ 12,416 $ 13,807 $ 15,042 $ 16,443 $ 12,673 $ 14,469 $ 14,235 $ 14,377Gross margin 3,486 3,873 4,039 4,157 3,521 4,001 3,897 3,966Net income attributable to common shareowners 330 1,328 1,415 2,057 1,012 1,318 1,324 1,325Earnings per share of Common Stock:Basic—net income $ .37 $ 1.49 $ 1.58 $ 2.28 $ 1.13 $ 1.48 $ 1.49 $ 1.49Diluted—net income $ .36 $ 1.47 $ 1.56 $ 2.26 $ 1.11 $ 1.45 $ 1.47 $ 1.47COMPARATIVE STOCK DATA (UNAUDITED)<strong>2012</strong> 2011COMMON STOCK High Low Dividend High Low DividendFirst quarter $ 87.50 $ 73.62 $ .480 $ 85.46 $ 77.05 $ .425Second quarter $ 83.57 $ 70.71 $ .480 $ 90.67 $ 81.19 $ .480Third quarter $ 82.56 $ 70.95 $ .535 $ 91.83 $ 67.12 $ .480Fourth quarter $ 83.64 $ 74.44 $ .535 $ 80.36 $ 66.87 $ .480Our common stock is listed on the New York Stock Exchange. The high and low prices are based on the Composite Tape of theNew York Stock Exchange. There were approximately 22,210 registered shareholders at January 31, 2013.PERFORMANCE GRAPH (UNAUDITED)The following graph presents the cumulative total shareholder return for the five years ending December 31, <strong>2012</strong> for our common stock,as compared to the Standard & Poor’s 500 Stock Index and to the Dow Jones 30 Industrial Average. Our common stock price is acomponent of both indices. These figures assume that all dividends paid over the five-year period were reinvested, and that the startingvalue of each index and the investment in common stock was $100.00 on December 31, 2007.COMPARISON OF CUMULATIVE FIVE YEAR TOTAL RETURN$150<strong>United</strong> <strong>Technologies</strong>CorporationS&P 500 Index$100Dow JonesIndustrials$50$012/07 12/08 12/09 12/10 12/11 12/12December2007 2008 2009 2010 2011 <strong>2012</strong><strong>United</strong> <strong>Technologies</strong> Corporation $ 100.00 $ 71.57 $ 95.40 $ 110.88 $ 105.37 $ 121.28S&P 500 Index $ 100.00 $ 63.00 $ 79.67 $ 91.68 $ 93.61 $ 108.59Dow Jones Industrial Average $ 100.00 $ 68.07 $ 83.51 $ 95.25 $ 103.24 $ 113.81
98 UNITED TECHNOLOGIES CORPORATIONBoard of DirectorsLouis R. ChênevertChairman & ChiefExecutive Officer<strong>United</strong> <strong>Technologies</strong> Corporation(Diversified Manufacturer)John V. FaraciChairman and ChiefExecutive OfficerInternational Paper(Paper, Packaging and Distribution)Jean-Pierre GarnierOperating PartnerAdvent International(Global Private Equity Firm)Retired Chief Executive OfficerGlaxoSmithKIineJamie S. GorelickPartnerWilmerHale(Law Firm)Former Deputy Attorney Generalof the <strong>United</strong> StatesFormer General Counsel of theDepartment of DefenseEdward A. KangasFormer Chairman and CEODeloitte, Touche, Tohmatsu(Audit and Tax Services)Ellen J. KullmanChair of the Board & CEODuPont(Diversified Chemicals and Materials)Marshall O. LarsenFormer Chairman, Presidentand Chief Executive OfficerGoodrich Corporation(Aerospace and Defense Systemsand Services)Richard D. McCormickRetired Chairman, Presidentand Chief Executive OfficerUS West, Inc.(Telecommunications)Harold McGraw IllChairman, President andChief Executive OfficerThe McGraw-Hill Companies(Global Information Services)Richard B. MyersGeneral, U.S. Air Force (Ret.)and former Chairman ofthe Joint Chiefs of Staff(Military Leadership)H. Patrick SwygertPresident EmeritusHoward University(Educational Institution)André VilleneuveFormer Chairman, InternationalRegulatory Strategy GroupCity of London(Advisory Group)Christine Todd WhitmanPresidentThe Whitman Strategy Group(Environment and PublicPolicy Consulting)Former EPA AdministratorFormer Governor of New JerseyPERMANENT COMMITTEESAudit CommitteeEdward A. Kangas, ChairJohn V. FaraciRichard D. McCormickRichard B. MyersH. Patrick SwygertAndré VilleneuveCommittee on Compensationand Executive DevelopmentJean-Pierre Garnier, ChairJamie S. GorelickEdward A. KangasRichard D. McCormickHarold McGraw IllH. Patrick SwygertExecutive CommitteeLouis R. Chênevert, ChairRichard D. McCormickFinance CommitteeJohn V. Faraci, ChairLouis R. ChênevertJamie S. GorelickEdward A. KangasEllen J. KullmanMarshall O. LarsenHarold McGraw IIIAndré VilleneuveChristine Todd WhitmanCommittee on Nominationsand GovernanceRichard D. McCormick, ChairJohn V. FaraciJean-Pierre GarnierHarold McGraw IllRichard B. MyersChristine Todd WhitmanPublic Issues Review CommitteeChristine Todd Whitman, ChairJean-Pierre GarnierJamie S. GorelickEllen J. KullmanMarshall O. LarsenRichard B. MyersH. Patrick SwygertAndré Villeneuve
<strong>2012</strong> ANNUAL REPORT 99LeadershipPaul R. AdamsChief Operating Officer,Pratt & WhitneyDavid AdlerPresident,Sikorsky Aerospace ServicesElizabeth B. AmatoSenior Vice President,Human Resourcesand OrganizationDavid G. AppelPresident, Transicold,UTC Climate,Controls & SecurityAlain M. BellemarePresident &Chief Executive Officer,UTC Propulsion &Aerospace SystemsRichard H. Bennett, Jr.Vice President,Environment, Health & SafetyPatrick BlethonPresident, Pacific Asia,OtisCarey E. BondPresident,Sikorsky Global HelicoptersBrian BrandewieSenior Vice President,Power, Controls &Sensing Systems,UTC Aerospace SystemsMatthew F. BrombergVice President,Corporate Strategyand DevelopmentBenoit BrossoitVice President,OperationsBernardo Calleja FernandezPresident, South Europe andMiddle East, OtisDavid B. CarterVice President,Engineering and Technology,Aircraft Systems,UTC Aerospace SystemsLouis R. ChênevertChairman &Chief Executive OfficerBennett M. CroswellPresident, Military Engines,Pratt & WhitneyGeraud DarnisPresident &Chief Executive Officer,UTC Climate, Controls& SecurityNancy M. DavisVice President andChief Information OfficerPierre DejouxPresident,North Europe and Africa, OtisPhilippe DelpechPresident, EMEA,UTC Climate, Controls& SecurityMichael R. DumaisPresident, Power, Controls& Sensing Systems,UTC Aerospace SystemsShane EddySenior Vice President,Operations, SikorskyCynthia EgnotovichPresident, Customer Service,UTC Aerospace SystemsCharles D. Gill, Jr.Senior Vice President andGeneral CounselDavid L. GitlinSenior Vice President,Aircraft Systems,UTC Aerospace SystemsPeter J. Graber-LippermanVice President, Secretary andAssociate General CounselLindsay HarveyPresident,<strong>United</strong> Kingdom, Centraland East Europe, OtisGregory J. HayesSenior Vice President andChief Financial OfficerDavid P. HessPresident, Pratt & WhitneyTodd J. KallmanPresident, Commercial Engines,Pratt & WhitneyRobert F. LeducPresident,Boeing Programs & Space,Power, Controls &Sensing Systems,UTC Aerospace SystemsPeter F. LongoVice President, ControllerMichael B. MaurerPresident, SikorskyRobert J. McDonoughPresident, Americas,UTC Climate, Controls& SecurityJ. Michael McQuadeSenior Vice President,Science and TechnologySamir B. MehtaPresident,Sikorsky Military SystemsKevin J. O’ConnorVice President,Global ComplianceDavid E. ParekhVice President,Research, and Director,<strong>United</strong> <strong>Technologies</strong>Research CenterCurtis C. ReusserPresident, Aircraft Systems,UTC Aerospace SystemsThomas I. RoganVice President, TreasurerJohn SaabasPresident,Pratt & Whitney CanadaPedro Sainz de BarandaPresident, OtisRichard J. SanfreySenior Vice President,Operations,UTC Climate, Controls& SecurityRoss B. ShusterPresident, Asia,UTC Climate, Controls& SecurityTobin J. TreichelVice President, TaxThomas R. ViningPresident, China, OtisGregg WardSenior Vice President,Government AffairsRandal E. WilcoxPresident, North andSouth America, OtisPeiming Perry ZhengVice President,Strategy and BusinessDevelopment, Otis
100 |UNITED TECHNOLOGIES CORPORATIONShareowner InformationCORPORATE OFFICE<strong>United</strong> <strong>Technologies</strong> Corporation<strong>United</strong> <strong>Technologies</strong> BuildingHartford, CT 06101Telephone: 860.728.7000This report is made available to shareowners in advance of theannual meeting of shareowners to be held at 2 p.m., April 29, 2013,in Savannah, Ga. The proxy statement will be made available toshareowners on or about March 15, 2013, at which time proxies forthe meeting will be requested.Information about UTC, including financial information, canbe found at our website: www.utc.com.STOCK LISTINGNew York Stock ExchangeTICKER SYMBOLUTXTRANSFER AGENT AND REGISTRARComputershare Trust Company, N.A., is the transfer agent,registrar and dividend disbursing agent for UTC's commonstock. Questions and communications regarding transfer of stock,replacement of lost certificates, dividends, address changes, andthe Stock Purchase and Dividend Reinvestment Plan administeredby Computershare should be directed to:Computershare Trust Company, N.A.250 Royall StreetCanton, MA 02021Telephone:Within the U.S.: 1.800.488.9281Outside the U.S.: 1.781.575.2724Website: www.computershare.com/investorTDD: 1.800.952.9245Telecommunications device for the hearing impairedCERTIFICATIONSUTC has included as Exhibit 31 to its <strong>Annual</strong> <strong>Report</strong> on Form 10-Kfor fiscal year <strong>2012</strong> filed with the Securities and ExchangeCommission certificates of its Chief Executive Officer, ChiefFinancial Officer and Controller certifying, among other things, theinformation contained in the Form 10-K.<strong>Annual</strong>ly UTC submits to the New York Stock Exchange(NYSE) a certificate of UTC's Chief Executive Officer certifying thathe was not aware of any violation by UTC of NYSE corporategovernance listing standards as of the date of the certification.ELECTRONIC ACCESSRather than receiving mailed copies, registered shareowners maysign up at the following website for electronic communications,including annual meeting materials, stock plan statements and taxdocuments: www.computershare-na.com/green.For annual meeting materials, your enrollment is revocableuntil a week before each year's record date for the annual meeting.Beneficial shareowners may be able to request electronic access bycontacting their broker or bank, or Broadridge Financial Solutionsat: http://enroll.icsdelivery.com/utc.ADDITIONAL INFORMATIONShareowners may obtain a copy of the UTC <strong>Annual</strong> <strong>Report</strong> onForm 10-K for fiscal year <strong>2012</strong> filed with the Securities andExchange Commission by writing to:Corporate Secretary<strong>United</strong> <strong>Technologies</strong> Corporation<strong>United</strong> <strong>Technologies</strong> BuildingHartford, CT 06101For additional Information about UTC, please contact InvestorRelations at the above corporate office address or visit our websiteat: www.utc.com.SHAREOWNER INFORMATION SERVICESOur Internet and telephone services give shareowners fast accessto UTC financial results. The 24-hour-a-day, toll-free telephoneservice includes recorded summaries of UTC's quarterly earningsinformation and other company news.To access the service, dial 1.800.881.1914 from anytouch-tone phone and follow the recorded instructions.DIRECT REGISTRATION SYSTEMIf your shares are held in street name through a broker and youare interested in participating in the Direct Registration System,you may have your broker transfer the shares to ComputershareTrust Company, N.A., electronically through the Direct RegistrationSystem.ENVIRONMENTALLY FRIENDLY REPORTThis annual report is printed on recycled and recyclable paper.www.utc.comwww.otis.comwww.pw.utc.comwww.sikorsky.comwww.utcaerospacesystems.comwww.utcclimatecontrolssecurity.comDIVIDENDSDividends are usually paid on the 10th day of March, June,September and December.
<strong>2012</strong> RecognitionsUTC named No. 1 Most Admired Aerospace and Defense Companyby Fortune.UTC included in World’s Most Respected Companies by Barron’s magazine.UTC ranked 120 in Forbes Global 2000 list and was noted as aGlobal High Performer.UTC received the top rankings in Institutional Investor’s <strong>2012</strong> All-AmericaExecutive Team in the Capital Goods/Industrials — Aerospace & Defensesector for most honored company, best chief financial officer and bestinvestor relations team.UTC named among Thomson Reuters Top 100 Global Innovators in thetransportation equipment industry.UTC recognized with the 2011-<strong>2012</strong> Excellence Prize for SustainableDevelopment in China for its work on the Eco-City Indicator SystemConstruction and Eco-City Demonstration Assessment Project, which thecompany co-developed with the Chinese Society for Urban Studies.UTC received the National Association of Independent Colleges & UniversitiesAdvocacy Award in recognition of its extraordinary commitment to thetransformative power of higher education demonstrated through its EmployeeScholar Program. This marked the first time a corporate entity, rather thanan individual, has received the award.UTC recognized by the American Cancer Society with its Excellence inEmployee Engagement award for demonstrating outstanding volunteerism.This report and its associated Web content atwww.utc.com provide detailed examples of howour approach to integrating responsibility into ouroperations fosters a culture of innovation anddelivers results.Your feedback is important to us. Pleasevisit www.utc.com/<strong>2012</strong>ar and tell us what youthink of our financial and corporate responsibilityperformance and reporting.<strong>United</strong> <strong>Technologies</strong> Corporation and its subsidiaries’names, abbreviations thereof, logos, and productand service designators are all either the registeredor unregistered trademarks or trade names of <strong>United</strong><strong>Technologies</strong> Corporation and its subsidiaries.Names of other companies, abbreviationsthereof, logos of other companies, and product andservice designators of other companies are either theregistered or unregistered trademarks or trade namesof their respective owners.All paper used in this report is certified to theForest Stewardship Council (FSC ® ) standards.The cover and narrative section are printedon paper made with 30 percent post-consumer recycledcontent. The financial section is printed on paperthat utilizes 10 percent post-consumer recycledcontent and is made with improved energy efficiencyand the use of cogeneration and hydroelectricity.UTC received the Innovator Award from Pensions & Investments for itsimplementation of the Lifetime Income Strategy retirement plan, the firstof its kind.UTC recognized as a Most Innovative Institutional Investor for <strong>2012</strong> byaiCIO in the category of Best Corporate Pension Plan Above $5 Billion.UTC named a Top Corporate Partner by INROADS for the sixthconsecutive year.Photo creditsPage 5, top left, courtesy ©AIRDIASOL.RothanPage 11, top, courtesy AirbusPage 22, bottom, courtesy Airbus
<strong>United</strong> <strong>Technologies</strong> BuildingHartford, CT 06101U.S.A.www.utc.comOtisPratt & WhitneySikorskyUTC Aerospace SystemsUTC Climate, Controls & Security