Powering Up the First TimePresuming that the <strong>XVR</strong>1 filters are set as desired, It is time to power up the system. Beginby setting all four Level Controls on the front panel to minimum (counterclockwise). This willhelp prevent any damage due to mistakes in setting up the filters or source material which istoo loud.Plug the AC power cord of the <strong>XVR</strong>1 into the wall socket. The blue front panel light will lightup on both the power supply and the <strong>XVR</strong>1. After a few seconds you may hear the faintclick of the output relays of the <strong>XVR</strong>1 engaging. These relays give a delay on turn-on toprevent transients from reaching the speakers, and also mute the output at shutoff or whenthere is not enough AC line voltage to properly power the <strong>XVR</strong>1.At this point, send some audio signal through the system, and then turn on the lowfrequency amplifier. Slowly raise the Low <strong>Pass</strong> level controls of each channel and confirmthat there is proper low frequency output from the loudspeakers. Then turn the lowfrequency amplifier levels down.If the low frequency amplification seems to be OK, then turn on the high frequencyamplifiers and slowly raise their level controls. If everything seems OK and there is nostrange noises and distortion, then you may again raise the level of the Low <strong>Pass</strong> levelcontrols until a proper balance is achieved between the drivers.As mentioned earlier, ground loops are more common in Bi- and Tri- amplified systemsbecause there are more power amplifiers. If you encounter hum in the system, first attemptto isolate it. Is it in both channels, left and right? If so, it is probably a ground loop. Is italso on both top and bottom? If it is only on the high or low, you will want to considerobtaining one or more “cheater” plugs for the AC power connection which convert a 3 prongearth grounded wall socket to a 2 prong connection without earth ground. Try it on theamplifier which has the hum. If the hum and noise is on both high and low, then try usingthe “cheater” plug on both top and bottom amplifiers.In any case, when you encounter a problem like this, it usually pays to try different thingsout and see how the problem is affected, so that you can get a clue as to where it comesfrom. When using “cheater” plugs, it is important that at least one component in the systemis attached to the earth ground at the wall socket so as to ensure safety from electricalshock should the AC wiring isolation fail in one of the components.If you have a problem in one channel and not the other, for example in the Right channelbut not the Left channel, try switching Left for Right in the interconnection betweencomponents. For example, if there is no sound coming out of the Right channel but there issound coming from the Left, then start with the source, for example where the CD playerconnects to the cables going to the preamplifier and switch Left for Right. If the problemdoes not change, then the fault is in a component “downstream”. If the problem doeschange Left for Right, then the fault is in the CD player. If not, then proceed “downstream”to the place where the cables reach the next component, say the preamplifier, and switchLeft for Right. If the problem changes, then it was in the cable. Then go to the output of thenext component and so on until you get a change. Then the fault will be in the previouscomponent.16
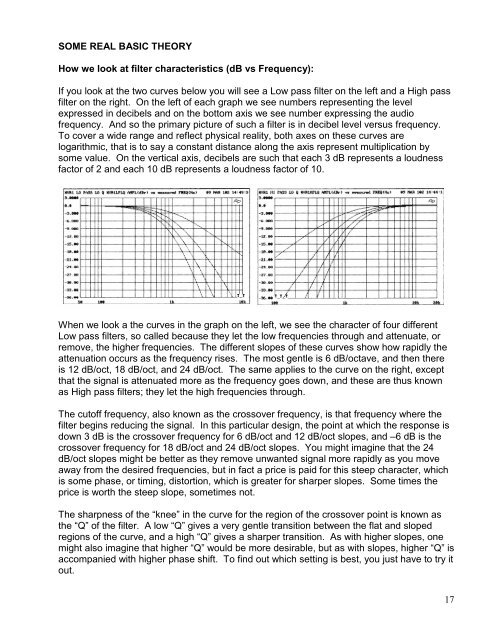
SOME REAL BASIC THEORYHow we look at filter characteristics (dB vs Frequency):If you look at the two curves below you will see a Low pass filter on the left and a High passfilter on the right. On the left of each graph we see numbers representing the levelexpressed in decibels and on the bottom axis we see number expressing the audiofrequency. And so the primary picture of such a filter is in decibel level versus frequency.To cover a wide range and reflect physical reality, both axes on these curves arelogarithmic, that is to say a constant distance along the axis represent multiplication bysome value. On the vertical axis, decibels are such that each 3 dB represents a loudnessfactor of 2 and each 10 dB represents a loudness factor of 10.When we look a the curves in the graph on the left, we see the character of four differentLow pass filters, so called because they let the low frequencies through and attenuate, orremove, the higher frequencies. The different slopes of these curves show how rapidly theattenuation occurs as the frequency rises. The most gentle is 6 dB/octave, and then thereis 12 dB/oct, 18 dB/oct, and 24 dB/oct. The same applies to the curve on the right, exceptthat the signal is attenuated more as the frequency goes down, and these are thus knownas High pass filters; they let the high frequencies through.The cutoff frequency, also known as the crossover frequency, is that frequency where thefilter begins reducing the signal. In this particular design, the point at which the response isdown 3 dB is the crossover frequency for 6 dB/oct and 12 dB/oct slopes, and –6 dB is thecrossover frequency for 18 dB/oct and 24 dB/oct slopes. You might imagine that the 24dB/oct slopes might be better as they remove unwanted signal more rapidly as you moveaway from the desired frequencies, but in fact a price is paid for this steep character, whichis some phase, or timing, distortion, which is greater for sharper slopes. Some times theprice is worth the steep slope, sometimes not.The sharpness of the “knee” in the curve for the region of the crossover point is known asthe “Q” of the filter. A low “Q” gives a very gentle transition between the flat and slopedregions of the curve, and a high “Q” gives a sharper transition. As with higher slopes, onemight also imagine that higher “Q” would be more desirable, but as with slopes, higher “Q” isaccompanied with higher phase shift. To find out which setting is best, you just have to try itout.17