Cleaning Up Diesel Pollution - Union of Concerned Scientists
Cleaning Up Diesel Pollution - Union of Concerned Scientists
Cleaning Up Diesel Pollution - Union of Concerned Scientists
- No tags were found...

Create successful ePaper yourself
Turn your PDF publications into a flip-book with our unique Google optimized e-Paper software.
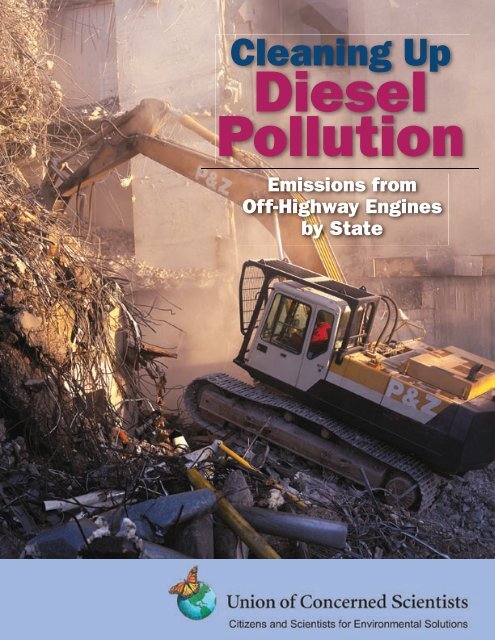
<strong>Cleaning</strong> <strong>Up</strong><strong>Diesel</strong><strong>Pollution</strong>Emissions fromOff-Highway Enginesby State
<strong>Cleaning</strong> <strong>Up</strong><strong>Diesel</strong><strong>Pollution</strong>Emissions fromOff-Highway Enginesby Stateb yP A T R I C I A M O N A H A N<strong>Union</strong> <strong>of</strong> <strong>Concerned</strong> <strong>Scientists</strong>June 2003
ii l<strong>Union</strong> <strong>of</strong> <strong>Concerned</strong> <strong>Scientists</strong>Copyright© 2003 <strong>Union</strong> <strong>of</strong> <strong>Concerned</strong> <strong>Scientists</strong>All rights reservedPatricia Monahan is a senior analyst in the UCS CleanVehicles Program.The <strong>Union</strong> <strong>of</strong> <strong>Concerned</strong> <strong>Scientists</strong> is a nonpr<strong>of</strong>it partnership<strong>of</strong> scientists and citizens combining rigorousscientific analysis, innovative policy development, andeffective citizen advocacy to achieve practical environmentalsolutions.The UCS Clean Vehicles Program develops and promotesstrategies to reduce the adverse environmental impact <strong>of</strong>the U.S. transportation system.More information about UCS and the Clean VehiclesProgram is available on the World Wide Web atwww.ucsusa.org.The full text <strong>of</strong> this report is available on the UCSwebsite or may be obtained from:UCS PublicationsTwo Brattle SquareCambridge, MA 02238-9105Or email pubs@ucsusa.orgor call (617) 547-5552.DESIGN: David Gerratt/Nonpr<strong>of</strong>itDesign.comPrinted on recycled paper
<strong>Cleaning</strong> <strong>Up</strong> <strong>Diesel</strong> <strong>Pollution</strong> l iiiCONTENTSFigures & TablesAcknowledgmentsvviExecutive Summary 1Chapter 1: Today’s Off-Highway <strong>Diesel</strong> Engines 6Society’s Heavy Lifters 6<strong>Pollution</strong> Burden 7Playing by Unfair Rules 8Chapter 2: Public Health Threats 12Particulate Matter (Soot) 12Air Toxics 14Smog-Forming Pollutants 15Higher-Risk Populations 15Global Warming <strong>Pollution</strong> 16Chapter 3: Cleanup Opportunities 17<strong>Cleaning</strong> <strong>Up</strong> Older Equipment 17<strong>Cleaning</strong> <strong>Up</strong> New Engines 21Tomorrow’s Technologies 22Ensuring Long-Term <strong>Pollution</strong> Reduction 23Chapter 4: Case Studies 25Types <strong>of</strong> Equipment 25Technical Assumptions 26Technical Issues 27Results 28
iv l<strong>Union</strong> <strong>of</strong> <strong>Concerned</strong> <strong>Scientists</strong>CONTENTS continuedChapter 5: Beyond <strong>Diesel</strong> 29Alternative Fuels 29Hybrids 30Fuel Cells 30Chapter 6: Paving the Way: Smart Public Policies 31Federal Action 31State and Local Action 32References 34AppendicesA. Calculating Emissions 38B. State Fact Sheets: Air <strong>Pollution</strong> from Mobile Sources 39
<strong>Cleaning</strong> <strong>Up</strong> <strong>Diesel</strong> <strong>Pollution</strong> l vFIGURES & TABLESFIGURESES-1. <strong>Pollution</strong> from an Excavator: Impact <strong>of</strong> ProgressivelyStronger Standards 51. <strong>Pollution</strong> Trends for Mobile Sources: Comparing Highway andOff-Highway Engines 82. <strong>Pollution</strong> from Off-Highway Vehicles, 2001 93. <strong>Pollution</strong> from Heavy <strong>Diesel</strong> Equipment, 2001 94. Comparing Nitrogen Oxide (NOx) Emissions Standardsfor <strong>Diesel</strong> Engines: Highway vs. Heavy Equipment 105. <strong>Pollution</strong> from an Excavator: Impact <strong>of</strong> ProgressivelyStronger Standards 106. Composition <strong>of</strong> <strong>Diesel</strong> Particulate Matter 13TABLESES-1. Soot and Smog-Forming <strong>Pollution</strong> fromOff-Highway <strong>Diesel</strong> Engines 2ES-2. <strong>Pollution</strong> Impact on Major Metropolitan Areas fromOff-Highway <strong>Diesel</strong> Engines 41. Types <strong>of</strong> Heavy <strong>Diesel</strong> Equipment 72. Today’s Emissions Standards for Heavy <strong>Diesel</strong> Equipment 113. Public Health Impacts <strong>of</strong> Soot Reduction Due to StrongerEmissions Standards (EPA Proposed Rule, April 2003) 124. Cancer Risk Assessments <strong>of</strong> <strong>Diesel</strong> Exhaust 145. <strong>Diesel</strong> Emission Control Opportunities for Particulate Matter (PM)and Nitrogen Oxides (NOx) 176. <strong>Pollution</strong> Reduction Potential from Emission Control Technologies 187. Assumed Power and Operating Characteristics <strong>of</strong> Four Types<strong>of</strong> <strong>Diesel</strong> Equipment 268. Baseline vs. New Stronger Emissions Standards 279. Cost-Effectiveness <strong>of</strong> Stronger Emissions Standards 28
<strong>Cleaning</strong> <strong>Up</strong> <strong>Diesel</strong> <strong>Pollution</strong> l 1EXECUTIVE SUMMARY<strong>Diesel</strong> engines provide the muscle power totackle many <strong>of</strong> society’s most strenuous tasks.For applications that demand power, fuel efficiency,and long engine life, diesel compression-ignitionengines are tough to beat. This is why diesel enginescurrently power more than three million highwaytrucks and buses and well over twice that many<strong>of</strong>f-highway engines (in trains, ships, and heavyequipment such as tractors, bulldozers, and excavators).However, while highway trucks and buseshave been forced to reduce their pollution significantly,<strong>of</strong>f-highway diesel engines are allowedto release large quantities <strong>of</strong> toxic soot and smogformingpollutants into the air we breathe—and public health pays the price.PUBLIC HEALTH RISKS<strong>Diesel</strong> exhaust is a mixture <strong>of</strong> smog-formingpollutants, particulate matter (or soot), and othertoxic constituents such as arsenic, cadmium,dioxin, and mercury (CARB, 1998). Small enoughto be inhaled deep into the lungs, diesel exhaustparticles can cause or exacerbate a wide variety <strong>of</strong>health problems, including asthma and other respiratoryailments, and have been linked to cancerand premature death. While scientists must <strong>of</strong>tenconduct animal testing to extrapolate the potentialimpact <strong>of</strong> pollutants on humans, our urbanair has unfortunately allowed researchers to measurethe effects <strong>of</strong> air pollution directly. We thushave overwhelming evidence that air pollution,particularly diesel exhaust, is harmful to humanhealth, posing even higher risks for childrenand other vulnerable populations.According to more than 30 epidemiologicalstudies, people routinely exposed to diesel exhaustthrough their work on railroads, docks, trucks,or buses have a greater risk <strong>of</strong> lung cancer (CARB,1998). A study by air pollution control <strong>of</strong>ficialsand administrators estimates that diesel may beresponsible for 125,000 additional cancers inthe United States over a lifetime <strong>of</strong> exposure(STAPPA/ALAPCO, 2000). And the CaliforniaAir Resources Board estimates that diesel pollutionis responsible for 70 percent <strong>of</strong> that state’s cancerrisk due to airborne pollution (CARB, 2000).Children may be especially susceptible to theharmful effects <strong>of</strong> diesel exhaust. Because they areoutdoors more <strong>of</strong>ten and breathing at faster ratesthan adults, children and their developing lungsexperience greater exposure to air pollutants (Wileyet al., 1993). This exposure has been shown to increasethe severity <strong>of</strong> asthma attacks and possiblyeven cause asthma in otherwise healthy children(McConnell et al., 2002). Asthma, which afflictedone in 20 children in 1998 (Federal InteragencyForum on Child and Family Statistics, 2001),is not only the most common chronic disease<strong>of</strong> childhood, but also a leading cause <strong>of</strong> childhooddisability.POLLUTION BURDENIn every state and major metropolitan area,<strong>of</strong>f-highway diesel engines are a major source <strong>of</strong>air pollution. On average, these engines contributeabout 45 percent <strong>of</strong> the particulate matter fromall mobile sources—equivalent to the emissions<strong>of</strong> more than 17 million new urban transit
2 l <strong>Union</strong> <strong>of</strong> <strong>Concerned</strong> <strong>Scientists</strong> Particulate Matter (Soot) Smog-Forming Nitrogen OxidesTable ES-1Soot and Smog-Forming <strong>Pollution</strong> from Off-Highway <strong>Diesel</strong> EnginesTonsReleasedin 1999NewTransit BusEquivalentShare<strong>of</strong> MobileSource<strong>Pollution</strong>TonsReleasedin 1999NewTransit BusEquivalentShare<strong>of</strong> MobileSource<strong>Pollution</strong>U.S. Totals 255,286 17,053,747 45% 3,709,556 10,545,027 29%Alabama 3,475 232,122 36% 173,093 492,045 50%Alaska 1,231 82,261 58% 24,037 68,330 57%Arizona 3,121 208,474 36% 52,399 148,953 25%Arkansas 4,169 278,524 53% 62,292 177,075 37%California 18,835 1,258,254 41% 313,172 890,243 29%Colorado 3,717 248,277 49% 45,597 129,618 26%Connecticut 1,448 96,720 29% 16,223 46,117 15%Delaware 731 48,847 38% 10,535 29,947 27%District <strong>of</strong> Columbia 213 14,224 42% 2,254 6,408 19%Florida 8,985 600,206 32% 119,625 340,053 21%Georgia 5,142 343,487 32% 72,771 206,863 18%Hawaii 861 57,507 47% 13,244 37,648 33%Idaho 1,835 122,568 49% 22,936 65,198 31%Illinois 12,384 827,271 52% 159,952 454,689 32%Indiana 7,331 489,714 48% 96,423 274,097 28%Iowa 7,976 532,815 68% 84,218 239,402 44%Kansas 6,852 457,700 68% 77,493 220,288 44%Kentucky 4,870 325,296 46% 82,135 233,483 33%Louisiana 11,387 760,673 67% 229,006 650,989 61%Maine 911 60,862 33% 12,809 36,412 23%Maryland 2,626 175,388 31% 35,367 100,537 18%Massachusetts 4,949 330,616 45% 55,260 157,085 24%Michigan 6,735 449,916 34% 89,027 253,073 21%Minnesota 8,522 569,285 53% 105,385 299,574 36%Mississippi 4,186 279,641 47% 71,618 203,587 35%Missouri 7,184 479,893 48% 108,234 307,672 32%Montana 3,076 205,486 70% 44,138 125,469 54%Nebraska 6,031 402,867 74% 84,933 241,436 56%Nevada 1,737 116,016 46% 24,645 70,058 30%New Hampshire 528 35,279 23% 5,923 16,836 12%New Jersey 3,516 234,900 31% 40,308 114,583 16%New Mexico 1,755 117,239 40% 41,924 119,177 35%New York 9,613 642,158 39% 132,308 376,106 24%North Carolina 5,012 334,810 32% 58,703 166,873 16%North Dakota 5,691 380,165 85% 55,679 158,277 67%Ohio 10,208 681,931 45% 146,365 416,068 29%
<strong>Cleaning</strong> <strong>Up</strong> <strong>Diesel</strong> <strong>Pollution</strong> l 3Table ES-1 continuedParticulate Matter (Soot)Smog-Forming Nitrogen OxidesTonsReleasedin 1999NewTransit BusEquivalentShare<strong>of</strong> MobileSource<strong>Pollution</strong>TonsReleasedin 1999NewTransit BusEquivalentShare<strong>of</strong> MobileSource<strong>Pollution</strong>U.S. Totals 255,286 17,053,747 45% 3,709,556 10,545,027 29%Oklahoma 3,831 255,891 43% 46,957 133,482 25%Oregon 3,286 219,500 42% 44,342 126,050 27%Pennsylvania 7,057 471,403 37% 104,717 297,675 23%Rhode Island 381 25,465 30% 5,203 14,790 16%South Carolina 2,545 170,009 30% 36,284 103,143 18%South Dakota 3,854 257,484 78% 30,440 86,529 49%Tennessee 4,947 330,485 40% 76,725 218,102 26%Texas 20,889 1,395,461 48% 269,583 766,334 29%Utah 2,558 170,886 49% 36,759 104,495 34%Vermont 331 22,110 26% 2,872 8,165 10%Virginia 4,918 328,509 36% 79,620 226,332 24%Washington 5,624 375,665 47% 87,398 248,443 33%West Virginia 2,000 133,571 46% 39,137 111,253 36%Wisconsin 4,963 331,511 39% 52,361 148,843 48%Wyoming 1,264 84,408 55% 27,131 77,123 48%NOTE: Off-highway diesel engines include heavy equipment, marine vessels, and locomotives. Particulate matter emissions are forparticles 10 microns in diameter and less (PM10). To calculate new transit bus equivalent emissions, we assumed a model year 2004transit bus would release 0.44 grams per mile <strong>of</strong> particulate matter and 10.34 grams per mile <strong>of</strong> nitrogen oxides, and that the bus wouldtravel 30,861 miles per year. See Appendix A for more details on UCS’s compilation <strong>of</strong> the 1999 emission inventory and thecalculation <strong>of</strong> new transit bus equivalent emissions.SOURCE: All the mobile source emission data except California’s <strong>of</strong>f-highway pollution are based on the final 1999 emission inventorycompiled by the U.S. EPA. The data are located at: ftp://ftp.epa.gov/EmisInventory/finalnei99ver2/criteria. California’s <strong>of</strong>f-highwayemissions were provided by the California Air Resources Board. New transit bus grams-per-mile emissions are from Mark and Morey,2000. Transit bus annual miles traveled are from U.S. DOE, 2002.buses. These engines also release about one-quarter<strong>of</strong> the smog-forming nitrogen oxides from allmobile sources—equal to the emissions <strong>of</strong> about10.5 million new urban transit buses.California and Texas are the nation’s biggestpolluters in terms <strong>of</strong> particulate matter and nitrogenoxide emissions from <strong>of</strong>f-highway engines(Table ES-1). In seven other states (Iowa, Kansas,Louisiana, Montana, Nebraska, North Dakota,and South Dakota), these engines contributemore than 60 percent <strong>of</strong> the particulate matterreleased by mobile sources.New York and Los Angeles top the list <strong>of</strong>metropolitan areas with the most particulatematter and nitrogen oxide emissions from <strong>of</strong>fhighwayengines, followed by Houston, Boston,and Chicago (Table ES-2, p.4). In the Houstonand Pittsburgh areas, <strong>of</strong>f-highway engines areresponsible for at least half <strong>of</strong> all particulatematter emitted by mobile sources.PLAYING BY UNFAIR RULESGrowing awareness <strong>of</strong> the public health dangers<strong>of</strong> diesel exhaust has led to stricter emissions standardsfor highway engines, but standards for <strong>of</strong>fhighwayengines continue to lag behind. Heavydiesel equipment, for example, was not requiredto meet any emissions standards until 1996—a
4 l<strong>Union</strong> <strong>of</strong> <strong>Concerned</strong> <strong>Scientists</strong>Table ES-2 <strong>Pollution</strong> Impact on Major Metropolitan Areas from Off-Highway <strong>Diesel</strong> EnginesParticulate Matter(Soot)Smog-FormingNitrogen OxidesMetropolitan AreaTonsReleasedin 1999NewTransit BusEquivalentShare<strong>of</strong> MobileSource<strong>Pollution</strong>TonsReleasedin 1999NewTransit BusEquivalentShare<strong>of</strong> MobileSource<strong>Pollution</strong>New York 7,623 509,211 36% 76,738 218,139 16%Los Angeles 6,864 458,533 38% 117,834 334,963 26%Houston 5,538 369,978 54% 50,456 143,431 28%Boston 5,166 345,066 46% 57,427 163,245 23%Chicago 5,050 337,379 41% 70,175 199,485 25%San Francisco 3,610 241,158 42% 55,662 158,228 30%Philadelphia 3,488 233,023 40% 54,050 153,647 28%Washington, D.C./ Baltimore 3,478 232,329 34% 46,551 132,329 19%Dallas/Fort Worth 2,828 188,899 35% 34,249 97,358 17%Detroit 2,599 173,633 35% 33,210 94,406 17%Seattle 2,332 155,795 42% 35,374 100,557 26%Cleveland 2,308 154,201 40% 38,378 109,095 31%St. Louis 2,057 137,422 41% 33,162 94,269 26%Atlanta 1,921 128,341 28% 23,424 66,587 13%Pittsburgh 1,866 124,640 50% 33,847 96,214 36%Miami/Fort Lauderdale 1,811 120,980 39% 22,606 64,261 21%Phoenix 1,788 119,428 40% 21,591 61,377 22%Denver 1,675 111,884 47% 19,596 55,704 22%Minneapolis 1,642 109,661 40% 20,810 59,157 20%San Diego 1,466 97,933 35% 19,069 54,207 24%NOTE: Off-highway diesel engines include heavy equipment, marine vessels, and locomotives. Particulate matter emissions are for particles 10 microns in diameter andless (PM10). To calculate new transit bus equivalent emissions, we assumed a model year 2004 transit bus would release 0.44 grams per mile <strong>of</strong> particulate matter and10.34 grams per mile <strong>of</strong> nitrogen oxides, and that the bus would travel 30,861 miles per year. See Appendix A for more details on UCS’s compilation <strong>of</strong> the 1999 emissioninventory and the calculation <strong>of</strong> new transit bus equivalent emissions.SOURCE: All the mobile source emission data except California’s <strong>of</strong>f-highway pollution are based on the final 1999 emission inventory compiled by the U.S. EPA.The data are located at: ftp://ftp.epa.gov/EmisInventory/finalnei99ver2/criteria. California’s <strong>of</strong>f-highway emissions were provided by the California Air Resources Board.New transit bus grams-per-mile emissions are from Mark and Morey, 2000. Transit bus annual miles traveled are from U.S. DOE, 2002.full three decades after the first regulations forhighway diesel trucks and buses. As a result, highwaytrucks and buses have released lower amounts<strong>of</strong> particulate matter over time, but EPA data indicatethat particulate matter and nitrogen oxideemissions from <strong>of</strong>f-highway engines have increasedduring the last several decades.Heavy diesel equipment is currently held toa complex, three-tiered set <strong>of</strong> emissions standards.The standards are based on engine power and arebeing phased in over a 10-year period endingin 2006. The current standards allow very smallengines and large engines to release more pollutionthan mid-size engines. By 2007, heavy dieselequipment rated 50 horsepower or higher will beallowed to release 15 to 30 times more particulatematter than a new highway truck or bus,and about 15 times more nitrogen oxides. Smalldiesel engines (below 50 hp) will be allowed torelease 45 to 60 times more particulate matterin 2007.Average emissions from new heavy diesel equipmenthave fallen as stronger emissions standardshave taken effect. An excavator built in 2003, forexample, releases about half the emissions <strong>of</strong> a pre-1996 model (Figure ES-1). If future emissions
<strong>Cleaning</strong> <strong>Up</strong> <strong>Diesel</strong> <strong>Pollution</strong> l 5standards for <strong>of</strong>f-highway vehicles are harmonizedwith existing standards for highway trucks andbuses, pollution could be reduced to approximatelyfour percent the level emitted by pre-1996 engines.COST-EFFECTIVE CONTROLS EXISTCost-effective pollution controls under developmentfor highway trucks and buses can be appliedto <strong>of</strong>f-highway engines as well. The unique operatingconditions <strong>of</strong> <strong>of</strong>f-highway engines will requiresome system modifications, but the overall costsshould be modest, particularly for engines rated75 hp and higher.UCS evaluated the cost <strong>of</strong> installing state-<strong>of</strong>the-artpollution controls on four different types<strong>of</strong> heavy diesel equipment: a tractor (75 hp), anexcavator (180 hp), a combine (285 hp), and anarticulated hauler, or large dump truck (420 hp).Our analysis indicates these pollution controlsincrease equipment costs only one to three percent,while reducing emissions 90 percent or more.A COMPREHENSIVE CLEANUP PLAN<strong>Cleaning</strong> up both new heavy diesel equipmentand the more than six million heavy dieselengines already in use will require a combination<strong>of</strong> federal, state, and local action. The mostcritical need is holding <strong>of</strong>f-highway diesel enginesaccountable to the same standards highway trucksand buses must meet. Specifically, the EPAneeds to:• Reduce the sulfur level in diesel fuels 99 percentor more for all <strong>of</strong>f-highway vehicles, includingheavy equipment, locomotives, and marinevessels. Sophisticated emission controls requirelow-sulfur diesel fuel (15 parts per million) comparedwith today’s level <strong>of</strong> 3,000 ppm or more.• Harmonize emissions standards for heavy dieselequipment with existing standards for highwaytrucks and buses.• Develop appropriate standards for locomotivesand all types <strong>of</strong> marine engines, including commercialmarine engines and large oceangoing ships.• Develop an effective, enforceable inspectionand maintenance program to ensure emissioncontrols are functioning at their full potentialand prevent tampering <strong>of</strong> exhaust controls.At the state level, a combination <strong>of</strong> regulations,policies, and incentives can promote theinstallation <strong>of</strong> cleanup technologies on olderengines, as well as the purchase <strong>of</strong> new, cleanertechnologies. Local efforts to reduce heavy dieselemissions in sensitive communities providemodels that can be replicated across the country.Figure ES-1 <strong>Pollution</strong> from an Excavator:Impact <strong>of</strong> Progressively Stronger StandardsPounds per Year2,5002,0001,5001,0005000Yearly Emissions <strong>of</strong> Nitrogen Oxides6.9 g/bhp-hrNOx only4.9 g/bhp-hrNOx + HC3.0 g/bhp-hrNOx + HC0.3 g/bhp-hrNOx onlyNo Tier 1 Tier 2 Tier 3 Tier 4Standards (1996) (2003) (2006) (Future)NOTE: g/bhp-hr stands for grams per brake horsepower hour, which is a measurefor expressing the amount <strong>of</strong> pollution released per unit <strong>of</strong> power.SOURCE: UCS calculation is based on the U.S. EPA’s NONROAD model andbackground support documents located at: www.epa.gov/otaq/nonrdmdl.htm.
6 l<strong>Union</strong> <strong>of</strong> <strong>Concerned</strong> <strong>Scientists</strong>Chapter 1TODAY’S OFF-HIGHWAY DIESEL ENGINES<strong>Diesel</strong> engines provide the muscle power totackle many <strong>of</strong> society’s most strenuous tasks.For applications that demand power, fuel efficiency,and long engine life, diesel compression-ignitionengines are hard to beat. <strong>Diesel</strong> engines powermore than three million highway trucks andbuses and well over twice that many pieces <strong>of</strong> <strong>of</strong>fhighwayheavy equipment. But these workhorseshave been allowed to run wild, leaving a trail <strong>of</strong>toxic soot and smog-forming pollutants in the airwe breathe, and public health has paid a price.Growing awareness <strong>of</strong> the public health dangers<strong>of</strong> diesel exhaust has led to stricter emissions standardsfor highway diesel engines, but standardsfor <strong>of</strong>f-highway engines continue to lag behind.As a result, <strong>of</strong>f-highway diesel engines are majorsources <strong>of</strong> air pollution, contributing about45 percent <strong>of</strong> the particulate matter (or soot) andmore than one-quarter <strong>of</strong> the smog-forming nitrogenoxides (NOx) from mobile sources. This pollutionaffects every state in the country, urbanand rural areas alike.This report evaluates the potential to clean up<strong>of</strong>f-highway diesel engines, focusing particularlyon the single largest source <strong>of</strong> pollution from thiscategory: heavy equipment. Chapter One providesinformation on pollution from <strong>of</strong>f-highway dieselengines, which are installed in trains, marinevessels, and heavy equipment. Chapter Two discussesthe public health consequences <strong>of</strong> dieselpollution, highlighting its impact on childrenand other sensitive populations. In Chapter Three,we provide information on the cleanup technologiesthat could potentially reduce diesel pollutionto very low levels. Chapter Four presents theresults <strong>of</strong> our case study analysis <strong>of</strong> the costs andemissions benefits <strong>of</strong> installing state-<strong>of</strong>-the-artpollution controls on four types <strong>of</strong> heavy dieselequipment: tractors, excavators, combines, andarticulated haulers, or large dump trucks. In ChapterFive, we discuss alternatives to diesel—electricity,alternative fuels, and fuel cells—that canreduce pollution and help diversify our energychoices. Finally, Chapter Six suggests how localgovernments, states, and the federal governmentshould work together to build a comprehensiveprogram for reducing public exposure to dangerousdiesel exhaust.SOCIETY’S HEAVY LIFTERSWe rely on <strong>of</strong>f-highway diesel engines toconstruct our homes, provide food for our families,build our streets and highways, and carryus long distances from home. These engines arefound in every nook and cranny <strong>of</strong> the country,from our nation’s farmlands to our cities andremote wilderness areas. Like highway dieseltrucks and buses, <strong>of</strong>f-highway engines capitalizeon the advantages <strong>of</strong> compression ignition,providing more power at a wider range <strong>of</strong> speedsthan conventional gasoline-powered engines.Off-highway diesel engines are installed inmarine vessels, locomotives, and heavy equiment.Heavy diesel equipment is used for construction(bulldozers and excavators), farming (tractorsand combines), industrial and commercial usage(portable generators), recreation (snowmobiles),logging, and airport support (Table 1). Thesemachines, which vary in horsepower from lessthan 10 to 3,000 horsepower (hp), must operate
<strong>Cleaning</strong> <strong>Up</strong> <strong>Diesel</strong> <strong>Pollution</strong> l 7under a wide variety <strong>of</strong> engine cycles, speeds, andenvironmental conditions. In short, diesel enginesprovide the versatility, durability, and power totake care <strong>of</strong> society’s heavy moving and lifting.The advantages <strong>of</strong> compression ignition,however, come at the cost <strong>of</strong> public health. Thesemachines are major sources <strong>of</strong> air pollution, releasingtoxic particulates and smog-forming pollutantsinto the air we breathe.POLLUTION BURDENWhile highway trucks and buses have releasedlower amounts <strong>of</strong> particulate matter over time,the limited data available on <strong>of</strong>f-highway enginesindicate that both particulate and nitrogen oxideemissions have increased during the last severaldecades (Figure 1, p.8). The amount <strong>of</strong> smogformingnitrogen oxides from <strong>of</strong>f-highway engineshas climbed steadily since 1980, while highwayengines have cut their emissions by one-thirdduring the same period. Particulate matter emissionsfrom <strong>of</strong>f-highway engines surpassed emissionsfrom highway vehicles in the mid-1990s, andunless action is taken soon, the gap will widenduring the next several decades.Table 1 Types <strong>of</strong> Heavy <strong>Diesel</strong> EquipmentConstruction and MiningBulldozersExcavatorsCranesGradersBackhoesTractorsSkid steer loadersOff-highway trucksRubber tire loadersRecreationalSnowmobilesAll-terrain vehiclesLoggingShreddersAirportGround support equipmentAgriculturalAgricultural tractorsCombinesIrrigation setsCommercial/IndustrialGenerator setsPumpsAir compressorsWeldersAC/refrigerationTerminal tractorsForkliftsLawn & GardenMowersRotary tillersStump grindersCommercial turf equipmentOff-highway engines are installed in heavydiesel and gasoline equipment, aircraft, marinevessels, and trains. Of these categories, heavy dieselequipment is the biggest source <strong>of</strong> particulate andnitrogen oxide pollution (Figure 2, p.9). In 2001,these engines released more than half <strong>of</strong> the par-The <strong>Diesel</strong> Trade-<strong>of</strong>f: Power vs. <strong>Pollution</strong>Power: Compared with standard spark-ignited engines, diesel compression-ignition engines typically operate more efficientlyover a wider range <strong>of</strong> operating conditions, particularly at lower speeds. Instead <strong>of</strong> using a throttle and sacrificingefficiency as a result, diesel engines reduce their energy output by reducing fuel input. In addition, diesel engines operateat higher pressures, generate more horsepower output, and can thus haul heavier loads.<strong>Pollution</strong>: <strong>Diesel</strong>’s enhanced efficiencies come at the cost <strong>of</strong> toxic particulate matter and smog-forming pollution. Asdiesel fuel is compressed with air in the combustion chambers, pockets <strong>of</strong> excess fuel cause particulates to form. Sulfurin the diesel fuel and certain additives in lubricating oils can also lead to particulate formation. In addition, high enginetemperatures promote the formation <strong>of</strong> smog-forming nitrogen oxides. Engineers are therefore faced with a trade-<strong>of</strong>fbetween particulate matter and smog-forming pollutants: Lowering the engine temperature decreases nitrogen oxideemissions but increases the amount <strong>of</strong> unburned fuel, which is released in the form <strong>of</strong> particulates.
8 l<strong>Union</strong> <strong>of</strong> <strong>Concerned</strong> <strong>Scientists</strong>Figure 1 <strong>Pollution</strong> Trends for Mobile Sources: Comparing Highway and Off-Highway EnginesThousand Tons per Year500450400350300250200150100500Particulate Matter (PM10)HighwayOff-Highway1980 1985 1990 1995 2000SOURCE: U.S. EPA, National Emissions Inventory, Average Annual Emissions, All Criteria Pollutants,for 1980, 1985, 1990–2001. Available online at: www.epa.gov/ttn/chief/trends/trends01/trends2001.pdf.Thousand Tons per Year14,00012,00010,0008,0006,0004,0002,0000Smog-Forming Nitrogen OxidesHighwayOff-Highway1980 1985 1990 1995 2000ticulates and nearly 40 percent <strong>of</strong> the nitrogenoxides from <strong>of</strong>f-highway engines overall.Heavy equipment is used for a wide variety <strong>of</strong>purposes, including construction, farming, industry,logging, recreation, and mining. Of the manysectors relying on this equipment, the constructionand agricultural trades contribute the bulk <strong>of</strong>the pollution. These two sectors alone release morethan 80 percent <strong>of</strong> the particulate matter and nitrogenoxide pollution from heavy diesel equipment(Figure 3).Every state in the country bears the burden <strong>of</strong>pollution from <strong>of</strong>f-highway diesel engines. For adetailed analysis <strong>of</strong> the pollution impact on eachstate from both <strong>of</strong>f-highway diesel and mobilesources in general, see Appendix B.PLAYING BY UNFAIR RULESOff-highway diesel engines have not faced theregulatory scrutiny that highway diesel vehicleshave. While emissions standards for highwayvehicles, such as large trucks and buses, havegrown increasingly tight, <strong>of</strong>f-highway engineshave been allowed to release much higher levels<strong>of</strong> toxic particulate matter and smog-formingpollution. For example, heavy diesel equipmentwas not required to meet any emissions standardsuntil 1996, a full three decades after the first regulationsfor highway diesel trucks and buses. Comparedwith a new highway truck or bus, heavydiesel equipment (50 hp or greater) manufacturedin 2007 will be allowed to release 15 to 30 timesmore particulate matter and about 15 times morenitrogen oxides (Figure 4, p.10). Small dieselengines (below 50 hp) will be allowed to release45 to 60 times more particulate matter in 2007.Heavy diesel equipment is currently held to acomplex, three-tiered set <strong>of</strong> emissions standards(Table 2, p.11). 1 The standards are based on enginepower and are being phased in over a 10-yearperiod ending in 2006. The current standardsallow very small engines (less than 50 hp) and1 In 1994, the U.S. Environmental Protection Agency (EPA) issued its first set <strong>of</strong> emissions standards (called Tier 1) for <strong>of</strong>f-highway diesel engines, exceptthose used in locomotives, marine vessels, and underground mining equipment. The Tier 1 standards were phased in for different engine sizes between1996 and 2000, reducing nitrogen oxide emissions from these engines by about 30 percent. The EPA then adopted Tier 2 standards, with more stringentemission standards for nitrogen oxides, hydrocarbons (HC), and particulate matter (PM) released by new <strong>of</strong>f-highway diesel engines. For the first time,engines smaller than 50 hp had to meet emissions standards. The new rule phased in Tier 2 emissions standards from 2001 to 2006 for all engine sizes,and added even more stringent Tier 3 standards for engines between 50 and 750 hp from 2006 to 2008. The EPA estimates these standards will furtherreduce heavy diesel equipment emissions by 60 percent for nitrogen oxides and 40 percent for particulate matter relative to Tier 1 levels.
<strong>Cleaning</strong> <strong>Up</strong> <strong>Diesel</strong> <strong>Pollution</strong> l 9Figure 2 <strong>Pollution</strong> fromOff-Highway f-Highway Vehicles, 2001Particulate Matter (PM10)2001 Emissions: 316,000 TonsRailroadsOther 8%2%HeavyEquipment(Gasoline)22%MarineVessels14%MarineVessels14%HeavyEquipment(<strong>Diesel</strong>)54%HeavyEquipment(<strong>Diesel</strong>)54%Figure 3 <strong>Pollution</strong> from Heavy<strong>Diesel</strong> Equipment, 2001Particulate Matter (PM10)2001 Emissions: 173,000 TonsAgriculture40%Construction42%Other5%Industrial7%Commercial6%Nitrogen Oxides2001 Emissions: 4.2 Million TonsOther9%Other9%HeavyEquipment(Gasoline)5%Railroads24%HeavyEquipment(<strong>Diesel</strong>)38%HeavyEquipment(<strong>Diesel</strong>)38%MarineVessels24%MarineVessels24%SOURCE: U.S. EPA, National Emissions Inventory,Average Annual Emissions, All Criteria Pollutants,for 1980, 1985, 1990–2001. Available online at:www.epa.gov/ttn/chief/trends/trends01/trends2001.pdf.Nitrogen Oxides2001 Emissions: 1.6 Million TonsAgriculture33%Other6%Construction48%Industrial8%Commercial5%SOURCE: U.S. EPA, National Emissions Inventory,Average Annual Emissions, All Criteria Pollutants,for 1980, 1985, 1990–2001. Available online at:www.epa.gov/ttn/chief/trends/trends01/trends2001.pdf.large engines (greater than 750 hp) to releasemore pollution than mid-size engines.Emissions standards are based on test cyclesthat evaluate the amount <strong>of</strong> pollution releasedunder certain operating conditions. Most heavydiesel equipment operates under stop-and-goor transient cycles, but the current test cycle forheavy diesel equipment only requires that enginesmeet the standard under steady-state conditions.Ideally, engines should have to meet emissionsstandards under transient test cycles tailored totheir unique operating cycles.According to the EPA’s NONROAD model,emissions from new heavy diesel equipment havefallen steadily as stricter standards have comeReal-World<strong>Pollution</strong> vs. ModelingUnfortunately, we have very limited informationabout in-use emissions from heavy diesel equipment.If our experience with highway trucks and busesis a guide, heavy diesel vehicles may release moreparticulate matter and nitrogen oxides than certificationstandards would indicate. The rugged environmentalconditions under which some heavy equipment operatescould translate into even higher pollutant loads.
10 l <strong>Union</strong> <strong>of</strong> <strong>Concerned</strong> <strong>Scientists</strong> 0.3 g/bhp-hrFigure 4 Comparing Nitrogen Oxide (NOx) Emissions Standardsfor <strong>Diesel</strong> Engines: Highway vs. Heavy EquipmentGrams per Brake Horsepower Hour (g/bhp-hr)1413121110987654321Highway Trucks and BusesHeavy <strong>Diesel</strong> Equipment01989 1990 1991 1992 1993 1994 1995 1996 1997 1998 1999 2000 2001 2002 2003 2004 2005 2006 2007 2008 2009NOTE: Standards for heavy diesel equipment are for 25 horsepower and greater. Some <strong>of</strong> the standards include nonmethane hydrocarbons.SOURCE: Heavy diesel equipment standards from U.S. EPA, 2002C; highway truck and bus standards for 2004 and earlier from U.S. EPA, 1997;highway standards for 2007 from U.S. EPA, 2000.into effect (Figure 5). The model indicates thata 180 hp excavator built in 2006 will releaseone-third as many nitrogen oxides as a 1995model. The Tier 3 standards, however, do notgo far enough in protecting the public from thedangers <strong>of</strong> diesel exhaust. Stronger standards thatmore closely mirror the standards for highwaytrucks and buses could further reduce nitrogenoxide emissions by 90 percent relative to Tier 3standards.Figure 5 <strong>Pollution</strong> from an Excavator:Impact <strong>of</strong> Progressively Stronger StandardsPounds per Year2,5002,0001,5001,000500Yearly Emissions <strong>of</strong> Nitrogen Oxides6.9 g/bhp-hrNOx only4.9 g/bhp-hrNOx + HC3.0 g/bhp-hrNOx + HC0NOx onlyNo Tier 1 Tier 2 Tier 3 Tier 4Standards (1996) (2003) (2006) (Future)NOTE: g/bhp-hr stands for grams per brake horsepower hour, which is a measurefor expressing the amount <strong>of</strong> pollution released per unit <strong>of</strong> power.SOURCE: UCS calculation is based on the U.S. EPA’s NONROAD model andbackground support documents located at: www.epa.gov/otaq/nonrdmdl.htm.
<strong>Cleaning</strong> <strong>Up</strong> <strong>Diesel</strong> <strong>Pollution</strong> l 11Table 2 Today’s Emissions Standards for Heavy <strong>Diesel</strong> EquipmentEngine PowerStandards: grams per kilowatt hour, g/kW-hr (grams per brake horsepower hour, g/bhp-hr)> 560 kW (750 hp)NOx: 9.2 (6.9)PM: 0.54 (0.4)NOx + HC: 6.4 (4.8)PM: 0.2 (0.15)450 kW (600 hp)to < 560 kW (750 hp)NOx: 9.2 (6.9)PM: 0.54 (0.4)NOx + HC: 6.4 (4.8)PM: 0.2 (0.15)NOx + HC: 4.0 (3.0)PM: 0.2 (0.15)225 kW (300 hp)to < 450 kW (600 hp)NOx: 9.2 (6.9)PM: 0.54 (0.4)NOx + HC: 6.4 (4.8)PM: 0.2 (0.15)NOx + HC: 4.0 (3.0)PM: 0.2 (0.15)130 kW (175 hp)to < 225 kW (300 hp)NOx: 9.2 (6.9)PM: 0.54 (0.4)NOx + HC: 6.6 (4.9)PM: 0.2 (0.15)NOx + HC: 4.0 (3.0)PM: 0.2 (0.15)75 kW (100 hp)to
12 l<strong>Union</strong> <strong>of</strong> <strong>Concerned</strong> <strong>Scientists</strong>Chapter 2PUBLIC HEALTH THREATS<strong>Diesel</strong> exhaust is a mixture <strong>of</strong> smog-formingpollutants, soot particles, and toxic constituents.Exhaust from conventional diesel enginesis small enough to be inhaled deep into the lungs,where it can cause or exacerbate a wide variety<strong>of</strong> public health problems. While scientists must<strong>of</strong>ten conduct animal testing to extrapolate thepotential impact <strong>of</strong> pollutants on humans, ourTable 3 Public Health Impacts <strong>of</strong> SootReduction Due to Stronger EmissionsStandards (EPA Proposed Rule, April 2003)AdultsAge RangeAvoidedIncidencein 2030Premature mortality 30 and older 9,600Chronic bronchitis 26 and older 5,700Nonfatal myocardial infarctions 18 and older 16,000Hospital admissions (respiratory) 20 and older 4,500Hospital admissions(cardiovascular)20 and older 3,800Work-loss days 18-65 960,000Minor restricted-activity days 18-65 57,000,000ChildrenEmergency room visitsfor asthma18 and younger 5,700Acute bronchitis 8 to 12 14,000Lower respiratory symptoms 7 to 14 150,000<strong>Up</strong>per respiratory symptoms(asthmatic children)9 to 11 110,000Total Monetized Benefits: $81 Billion per Year in 2030SOURCE: U.S. EPA, 2003B.urban air has unfortunately allowed researchersto measure the effects <strong>of</strong> air pollution directly. Wethus have overwhelming evidence that air pollution,particularly diesel exhaust, is harmful tohuman health, posing even higher risks for childrenand other vulnerable populations.Reducing public exposure to diesel pollution—with its particulate matter, air toxics, and smogformingpollutants—will help prevent children’sasthma, reduce respiratory ailments, and save lives.The EPA estimates that strengthening emissionsstandards for heavy diesel equipment will prevent9,600 premature deaths each year by 2030 (EPA,2003B), save America $81 billion per year in2030, and deliver a variety <strong>of</strong> other health andsocietal benefits (Table 3).PARTICULATE MATTER (SOOT)Soot is released directly from the exhauststream or it may form as a secondary particlewhen nitrogen oxides, hydrocarbons, and sulfuroxides released from the tailpipe react in theatmosphere. 2 <strong>Diesel</strong> particles released directlyfrom the tailpipe are composed <strong>of</strong> a carbon corewith an array <strong>of</strong> toxic compounds includingmetals, polycyclic aromatic hydrocarbons (PAHs),and dioxins adsorbed to the particle’s surface(Cuddihy et al., 1984). The exact composition<strong>of</strong> diesel particulate matter varies depending onthe engine technology, test conditions, and sulfur2 The EPA has not attempted to quantify the role nitrogen oxides and hydrocarbons released from heavy equipment play in the formation <strong>of</strong> secondaryparticles (EPA, 2000). However, the agency believes the contribution from nitrogen oxides is “substantial,” particularly in areas with high ammonialevels (nitrogen oxides react with ammonia to form ammonium nitrate particles).
<strong>Cleaning</strong> <strong>Up</strong> <strong>Diesel</strong> <strong>Pollution</strong> l 13Figure 6 Composition <strong>of</strong><strong>Diesel</strong> Particulate MatterHydrocarbons(Fuel)7%Carbon41%Hydrocarbons(Lube)25%Ash13%SulfateParticles14%NOTE: Represents diesel exhaust from a heavy-dutydiesel vehicle manufactured after 1994, using the federaltest procedure transient cycle.DefinitionsCarbon: Not bound with other elements;responsible for the black smoke in diesel exaust.Hydrocarbons: Derived from lubricating oil and unburnedfuel adsorbed onto the surface <strong>of</strong> carbon particles orpresent in the form <strong>of</strong> fine droplets.Sulfate Particles: Derived from sulfur in diesel fueland formed when sulfuric acid and water react.Ash: Composed <strong>of</strong> metals formed fromlubricating oil and engine wear.SOURCE: Kittelson, 1998.content <strong>of</strong> the fuel. Figure 6 presents an example<strong>of</strong> the mix <strong>of</strong> particulate pollutants emitted froma standard heavy diesel engine built after 1994.Inhaling particulate matter can cause orexacerbate a variety <strong>of</strong> respiratory conditions andeven lead to premature death. Sensitive populationsincluding children, the elderly, asthmatics,and individuals with pre-existing respiratory orcardiovascular diseases are at the greatest riskfrom exposure to particulates (EPA, 2000).Respiratory impact <strong>of</strong> particulate matter<strong>Diesel</strong> soot particles are tiny—98 percent aresmaller than one micron in diameter—and virtuallyall can travel deep into the lungs and lodgein the alveoli, the delicate sites where oxygenexchange normally occurs (Bagley, 1996). Particulatematter is associated with adverse respiratoryeffects such as asthma, reduced lung function,reduced respiratory defense mechanisms, andacute respiratory illness (EPA, 2002). Numerousstudies have reported an association betweenshort-term exposure to particulates and hospitaladmissions for respiratory-related and cardiacdiseases. 3Premature death from particulate matterParticulate matter has also been directly linkedwith premature death. A study <strong>of</strong> more thanone million adults in 151 U.S. cities found thathigher concentrations <strong>of</strong> fine particles (2.5 micronsor less, called PM 2.5) were associated with a17 percent increase in total mortality betweencities with the least and most polluted air (Popeet al., 1995). In another study <strong>of</strong> more than 8,000people living in six cities in the eastern UnitedStates, PM 2.5was associated with even higher rates<strong>of</strong> mortality (Dockery et al., 1993). This studyfound a 26 percent increase in mortality betweenthe cities with the highest and lowest levels <strong>of</strong>air pollution. Based on these studies and otherresearch, the EPA estimates that new standardsregulating PM 2.5emissions will save 15,000 livesper year (EPA, 1997).Particle size and regulatory gapsHistorically, the EPA has only regulated particles10 microns in diameter and smaller, knownas PM 10; 4 current particulate emissions standardsfor heavy equipment are based on the weight <strong>of</strong>3 For a list <strong>of</strong> these studies and a table <strong>of</strong> results, see EPA 2002.4 For comparison, a human hair is about 70 microns in diameter.
14 l<strong>Union</strong> <strong>of</strong> <strong>Concerned</strong> <strong>Scientists</strong>PM 10released directly from tailpipes. Recent EPArulemaking establishing National Ambient AirQuality Standards for PM 2.5has not yet resultedin changes to vehicle emissions standards.Evidence that particle size plays a key role inpotential health effects is increasing. Fine particles,for example, may contain more <strong>of</strong> the reactivesubstances linked to health impacts than coarseparticles (EPA, 2000). These particles are smallenough to bypass respiratory defenses and lodgedeep in the lungs. Between 80 and 95 percent <strong>of</strong>diesel particles fall within the ultrafine size range<strong>of</strong> 0.05 to 1.0 micron (EPA, 2000).Current regulations for particulates do notaddress growing concerns about the health effects<strong>of</strong> ultrafine particles and nanoparticles, which aredifficult to measure with today’s technology. Thesesmaller particles may penetrate even more deeplyinto the respiratory tract, and their large surfaceto-volumeratio could allow for more biologicalinteraction. Because no accepted testing methodexists to ensure these particles are measured accuratelyand consistently, comparisons betweendifferent studies are problematic (Andersson andWedekind, 2001). In addition, different transientcycles, operating conditions, and exhaust temperaturesmay affect the generation <strong>of</strong> these very smallparticles. Since the EPA’s current regulationsgoverning particulates from heavy equipment arebased on particle mass and not size distribution,stricter regulations may not reduce public healthrisks proportionally.AIR TOXICSThe health risks <strong>of</strong> air toxics vary from pollutantto pollutant, but all are serious, includingcancer, immune system disorders, and reproductiveproblems. The California Air Resources Board(CARB) has listed diesel exhaust and its 41 constituentchemicals as “toxic air contaminants”that may cause or contribute to serious illnessand even death (CARB, 1998). Of the manypotential health risks from exposure to air toxics,cancer is the most studied and best understood.Cancer risksAccording to more than 30 epidemiologicalstudies, people who are routinely exposed to dieselexhaust through their work on railroads, docks,trucks, or buses have a greater risk <strong>of</strong> lung cancer(CARB, 1998). On average, these studies foundlong-term occupational exposure to diesel exhaustwas associated with a 40 percent increase in therelative risk <strong>of</strong> lung cancer.Numerous scientific bodies and agencies havelinked exposure to diesel exhaust with cancer risk(Table 4). CARB (2000) estimates that dieselexhaust is responsible for 70 percent <strong>of</strong> California’scancer risk from airborne toxic pollution, whichtranslates to 540 additional cancers per millionpeople exposed to current outdoor levels <strong>of</strong> dieselpollution over a 70-year lifetime. These estimatesTable 4Cancer Risk Assessments <strong>of</strong> <strong>Diesel</strong> ExhaustYear Organization Conclusion2002 U.S. EnvironmentalProtection Agency2001 Americal Council <strong>of</strong> GovernmentIndustrial Hygienists (proposal)2001 U.S. Department <strong>of</strong> Healthand Human ServicesLikely humancarcinogenSuspected humancarcinogen1998 California Air Resources Board Toxic aircontaminant1996 World Heath OrganizationInternational Programmeon Chemical SafetyReasonably anticipatedto be a human carcinogenProbable humancarcinogen1995 Health Effects Institute Potential tocause cancer1990 State <strong>of</strong> California Known to causecancer1989 International Agency forResearch on Cancer (IARC)1988 National Institutefor Occupational Safetyand Health (NIOSH)Probable humancarcinogenPotential occupationalcarcinogen
<strong>Cleaning</strong> <strong>Up</strong> <strong>Diesel</strong> <strong>Pollution</strong> l 15raised concerns about the danger diesel pollutionposes to the entire nation.The State and Territorial Air <strong>Pollution</strong> ProgramAdministrators (STAPPA) and the Association<strong>of</strong> Local Air <strong>Pollution</strong> Control Officials(ALAPCO) conducted an analysis <strong>of</strong> the nationalrisks from diesel, applying methodology and riskfactors similar to California. Their study foundthat diesel pollution may be responsible for morethan 125,000 additional cancers in the UnitedStates over a 70-year lifetime (STAPPA/ALAPCO, 2000).SMOG-FORMING POLLUTANTSIn the presence <strong>of</strong> sunlight, nitrogen oxidesand hydrocarbons can react to form urban ozone,or smog. Smog can irritate the respiratory system,reduce lung function, exacerbate asthma, damagethe lining <strong>of</strong> the lungs, and aggravate chroniclung diseases (EPA, 2000).Approximately 116 million Americans—40 percent <strong>of</strong> the nation’s population—currentlylive in areas that exceed the federal ozone standard(EPA, 2003C). Urban ozone pollution is linkedto increased hospital admissions for respiratoryproblems such as asthma (Koren, 1995; Whiteet al., 1994) and higher death rates on smoggy days,even at levels below the current federal standard(ATS, 1996). In addition, ozone air pollution hasbeen associated with as many as 10 to 20 percent<strong>of</strong> all summertime respiratory hospital visits andadmissions (EPA, 2000), and more than 1.5 millioncases <strong>of</strong> significant respiratory problems inchildren and adults every year (EPA, 2000).HIGHER-RISK POPULATIONSUrban and low-income communitiesEighty percent <strong>of</strong> Hispanics, 65 percent <strong>of</strong>African-Americans, and 57 percent <strong>of</strong> Caucasianslive in communities that fail to meet EPA airquality standards (ALA, 2002). Low-incomecommunities in particular face higher exposurelevels to diesel exhaust because they may be situatedcloser to freeways, distribution centers, orindustrialized areas with increased truck traffic.Construction and migrant farm workers als<strong>of</strong>ace exposure to diesel exhaust if they operateor work near heavy diesel equipment.ChildrenChildren may be particularly vulnerable to theharmful effects <strong>of</strong> air pollution (Ostro et al., 1995).Outdoors more <strong>of</strong>ten and breathing at faster ratesthan adults, children and their developing lungsmay experience greater exposure to harmful airpollutants (Wiley et al., 1993), which appears toincrease the severity <strong>of</strong> asthma attacks and evencause asthma in otherwise healthy children(McConnell et al., 2002). In communities withthe highest ozone levels, children who participatein three or more team sports are more than threetimes as likely to become asthmatic comparedwith less active children.Children raised in heavily polluted areas havereduced lung capacity, prematurely aged lungs,and increased risk <strong>of</strong> bronchitis and asthma comparedwith peers living in less urbanized areas(Dockery et al., 1989; Peters et al., 1999). In fact,the proximity <strong>of</strong> a child’s school to major roadshas been linked to asthma, and the severity <strong>of</strong> thechild’s symptoms increases with proximity to trucktraffic (Pekkanen et al., 1997). The link betweenpollution and asthma is <strong>of</strong> particular concern becauseasthma is the most common chronic disease<strong>of</strong> childhood and a leading cause <strong>of</strong> disability amongchildren. Approximately one in 20 children sufferedfrom asthma in 1998 (Federal InteragencyForum on Child and Family Statistics, 2001),costing $2.4 billion in additional health care(Lozano et al., 1999).
16 l<strong>Union</strong> <strong>of</strong> <strong>Concerned</strong> <strong>Scientists</strong>Researchers at the University <strong>of</strong> SouthernCalifornia (Gauderman et al., 2000) found thatchildren exposed to ambient levels <strong>of</strong> particulates,nitrogen dioxide, and other air pollutants experiencedmore than four times as much lung damageas children exposed to secondhand smoke. Childrenwho spent more time outdoors had evengreater lung damage.Because it is difficult to distinguish betweenthe specific effects <strong>of</strong> diesel exhaust and those<strong>of</strong> other air pollutants on children’s health, fewstudies have focused on the impact <strong>of</strong> diesel trucktraffic. One, however, found that children livingnear busy diesel trucking routes had decreased lungfunction compared with children living near roadstraveled mostly by automobiles (Brunekreef et al.,1997). A population-based survey <strong>of</strong> more than39,000 children living in Italy found that thoseliving on streets with heavy truck traffic were60 to 90 percent more likely to report symptomssuch as wheezing and coughing, and to havediagnoses such as bronchitis and pneumonia(Ciccone et al., 1998).GLOBAL WARMING POLLUTION<strong>Diesel</strong> pollution not only harms public healthdirectly, it also contributes to global warming,which carries longer-term public health and societalconsequences. All fossil fuels, including diesel,gasoline, natural gas, and propane, contributeglobal warming pollution to Earth’s atmosphere.Since the Industrial Revolution, levels <strong>of</strong> atmosphericcarbon dioxide—a primary global warminggas—have increased by more than 30 percent,reaching concentrations higher than any observedin the last 420,000 years (Petit et al., 1999). Theglobal average surface temperature has increasedby one degree Fahrenheit since 1860, and scientificevidence suggests this is largely due to humanactivities (IPCC, 2001) that release heat-trappinggases from factories, power plants, and automobiles.Unless emissions <strong>of</strong> global warmingpollution are drastically reduced, the averagetemperature could rise 2.5 to 10.4°F by theend <strong>of</strong> the 21st century (IPCC, 2001).Some <strong>of</strong> the projected consequences <strong>of</strong> globalwarming, such as rising sea levels, increased frequencyand intensity <strong>of</strong> extreme weather, vegetationshifts, and altered ranges <strong>of</strong> plant and animalspecies around the world, would have drasticeffects on the global ecosystem (UCS, 1999, 2001,and 2003). Localized hazards would include increasedchances <strong>of</strong> floods along coastlines andflood plains, wildfires in forest regions and grasslands,and landslides and avalanches in mountainousregions.In addition to carbon dioxide, diesel exhaustin the form <strong>of</strong> carbon soot may also be contributingto global warming. One study estimatesthat black carbon may be responsible for 15 to30 percent <strong>of</strong> global warming, second only tocarbon dioxide (Jacobson, 2001). These data,though preliminary, suggest that the power andhigher fuel economy <strong>of</strong> conventional diesel enginesare not a panacea for global warming. In addition,some diesel cleanup technologies involve a fueleconomy penalty, resulting in higher levels <strong>of</strong>carbon dioxide emissions.
<strong>Cleaning</strong> <strong>Up</strong> <strong>Diesel</strong> <strong>Pollution</strong> l 17Chapter 3CLEANUP OPPORTUNITIESeducing pollution from heavy diesel equip-Rment Rcan be technically challenging due tothe variation in engine use, power range, operatingconditions, and size.Unlike highway trucks and buses, whichgenerally range from 150 to 600 hp, heavy dieselengines range from less than 10 to 3,000 hp.Some are used under steady-state conditions,while others operate under start-and-go or highlytransient duty cycles. Emission controls for heavydiesel equipment must be tailored to the uniqueoperating conditions and packaging constraints <strong>of</strong>each type <strong>of</strong> equipment. In addition, because emissioncontrols can sometimes produce unwantedpollution (for example, nitrogen oxide controls<strong>of</strong>ten produce an increase in particulate emissionsand vice versa), systems must be optimized to ensureall key pollutants are simultaneously controlled.Luckily, many <strong>of</strong> the strategies for cleaning uphighway trucks and buses can be easily applied toheavy diesel equipment, particularly for mid-sizeand large engines (Table 5). Off-the-shelf technologiesare available today to meet current emissionsstandards for new heavy diesel equipment andreduce emissions from older equipment. Moreadvanced controls to cut pollutant loads are underdevelopment, and manufacturers are alreadyshowcasing these technologies in demonstrationvehicles (Table 6, p.18).CLEANING UP OLDER EQUIPMENTThe majority <strong>of</strong> the heavy equipment in usetoday was built before any emissions standardsexisted. For equipment that cannot be retired andTable 5 <strong>Diesel</strong> Emission Control Opportunitiesfor Particulate Matter (PM) and NitrogenOxides (NOx)Engine ImprovementsFuel injection systemsExhaust gas recirculationCombustion chamberCharge air coolingHomogenous charge compression ignitionIn-cylinder coatingsFuel and Oil SpecificationsFuel formulationLubrication oilExhaust Control EquipmentOxidation catalystParticulate trapsNOx adsorbersLean NOx catalystsSelective catalytic reductionPlasma-assisted catalystsPollutants ControlledNOx & PMNOxNOx & PMNOxPMPMNOx & PMPMPMPMNOxNOxNOx & PMNOxreplaced with newer, cleaner alternatives, retr<strong>of</strong>ittechnologies are available to reduce emissions <strong>of</strong>particulates and smog-forming nitrogen oxides.Oxidation catalysts, for example, have been availablefor years, while lean nitrogen oxide catalystsare just entering the market today. These technologiesare being applied to both highway and<strong>of</strong>f-highway diesel equipment.Oxidation catalystsWhat are they? Oxidation catalysts reduce theamount <strong>of</strong> particulates by transforming carbonparticles into carbon dioxide. As exhaust passesthrough an oxidation catalyst, the precious metalcatalyst oxidizes carbon monoxide, gaseous hydro-
18 l <strong>Union</strong> <strong>of</strong> <strong>Concerned</strong> <strong>Scientists</strong> <strong>Pollution</strong> Reduction PotentialTable 6 <strong>Pollution</strong> Reduction Potential from Emission Control TechnologiesTechnology or Fuel Particulates Nitrogen OxidesFuel EconomyPenalty Issues Stage <strong>of</strong> DevelopmentContinuously regenerating(“passive”) particulate filter (1)85% or more <strong>Up</strong> to 2% More smog-formingnitrous oxide (NO2)emissionsCurrently availableActive particulate filter 85% or more 5% or more Available in EuropeOxidation catalyst (2) 20% to 50% None Currently availableExhaust gas recirculation (3) <strong>Up</strong> to 50% <strong>Up</strong> to 5% Available, but needsimprovement to reachpotentialSelective catalytic reduction (4) 25% or more 55% to 90% 5% to 7% using urea Secondary emissions Under developmentLean NOx catalyst (5)10% to 20% today50% to 70% emerging2% to 6% Potential forhydrocarbon slipUnder developmentNOx adsorber or “trap” (6) 80% to 95% 2% to 6% Durability concerns Under developmentNOTE: All <strong>of</strong> these technologies require low-sulfur fuel at or below 15 ppm for optimal performance.SOURCES:(1) Certification data from the California Air Resources Board forJohnson Matthey and Engelhard continuously regeneratingpassive systems.(2) U.S. EPA certification data (EPA, 2001).(3) <strong>Diesel</strong>Net, 2000.(4) Miller, 2000; MECA, 2003.(5) Majewski, 2001; MECA, 2003.(6) Brogan, 1998.carbons, and liquid hydrocarbons adsorbed ontocarbon particles. According to EPA tests, oxidationcatalysts can reduce particulates by 20 to 50 percenton older engines (EPA, 2001). A key factor influencingtheir effectiveness is the level <strong>of</strong> sulfur inthe diesel fuel. Because oxidation catalysts alsooxidize sulfur dioxide, forming particulate sulfateemissions, they are most effective at reducing particulateemissions when the sulfur content <strong>of</strong> thediesel fuel is low. This technology is most appropriatefor older engines that cannot be retr<strong>of</strong>ittedwith particulate filters (see below).Current use and outlook: Oxidation catalystshave been used for decades to reduce particulatesfrom a variety <strong>of</strong> highway vehicles and heavy dieselequipment. More than 250,000 have been installedon a wide range <strong>of</strong> heavy diesel equipment includingunderground mining equipment, skid steerloaders, forklifts, and construction vehicles (MECA,2003). For example, construction equipment usedto clean debris from New York’s World Trade Centerdisaster and Boston’s “Big Dig” has utilizedoxidation catalysts to help protect residents andworkers from additional pollution exposure. Some35 million diesel passenger cars also rely on oxidationcatalysts to reduce particulate emissions.<strong>Diesel</strong> particulate filtersWhat are they? <strong>Diesel</strong> particulate filters, alsoknown as PM traps, capture particulates in theengine’s exhaust stream. Early evidence indicatesthat well-functioning filters can reduce particulatelevels more than 90 percent, to the point wherethey are below detectable limits (LeTavec, 2000).In addition to reducing the mass <strong>of</strong> particulateemissions, filters also appear to reduce thenumber and toxicity <strong>of</strong> particles.<strong>Diesel</strong> particulate filters will trap both combustibleparticles such as carbon soot and noncombustiblematerials such as the metals resultingfrom engine wear or the ash from lubricating oils.To clean the filter, the combustible particles mustbe oxidized (burned) through either passive oractive ignition. Passive systems, which are being
<strong>Cleaning</strong> <strong>Up</strong> <strong>Diesel</strong> <strong>Pollution</strong> l 19used on some new highway school and transitbuses, use a catalyst to lower the oxidation temperature<strong>of</strong> the exhaust stream. Active systems usesparks or a heating device such as a microwave toheat the particles to the temperature needed forignition (around 500° Celsius). Since they requireadditional energy to fuel the heating device, activesystems carry a small fuel economy penalty. Theyare also slightly more expensive than passivesystems.The performance <strong>of</strong> passive systems, on theother hand, can be impaired by sulfur in the exhaust.Sulfur oxides compete for the catalyst sites requiredfor the critical conversion <strong>of</strong> nitrogen oxide tonitrogen dioxide, increasing the temperature requiredfor successful regeneration and makingregeneration less effective. In addition, sulfur canbe oxidized on the filter itself, clogging the device.The Department <strong>of</strong> Energy (DOE) found thatsulfur in diesel fuel significantly harmed filter performanceand could even cause emissions to increaserelative to an uncontrolled engine (DOE,2001). Higher-sulfur fuel will not necessarilydamage active filters, but because the sulfur canbe oxidized into particulate sulfate compounds,the amount <strong>of</strong> particulates released into theatmosphere increases.<strong>Diesel</strong> particulate filters generally replace traditionalmuffler equipment, eliminating the needfor two separate devices. Although this technologyis typically larger than a muffler in both size(1.5 to 4 times the volume <strong>of</strong> engine displacement)and weight (two times the average muffler weight),most heavy diesel equipment has sufficient spaceand weight capacity for filter installation.Current use and outlook: Active particulatefilters have been used on heavy diesel equipmentin Europe and are now entering the U.S. market.Most heavy diesel equipment, because <strong>of</strong> its considerableidle time, varying operational speeds,and significant transient loads, does not have theduty cycles necessary to reach the temperaturethreshold for passive regeneration and will thereforerequire active filters (Starr, 2001). Manufacturers<strong>of</strong> passive filters are attempting to compensateby (1) using catalyst washcoats, (2) improvingthe oxidation capacity <strong>of</strong> the exhaust gas, and(3) increasing the engine exhaust temperature.Lean nitrogen oxide catalystsWhat are they? Lean nitrogen oxide catalysts,which reduce nitrogen oxide emissions in thepresence <strong>of</strong> the oxygen-rich exhaust stream typical<strong>of</strong> diesel engines, have the potential to reducenitrogen oxide emissions up to 30 percent. Thistechnology typically uses hydrocarbons to convertnitrogen oxides into nitrogen gas, carbon dioxide,and water. Because hydrocarbons are not concentratedsufficiently in the exhaust stream, they (ordiesel fuel) are injected directly into the exhaust,providing the environment necessary for nitrogenoxide reduction. This strategy does, however,carry a fuel economy penalty.Current use and outlook:In 2003, CARBverified the first combination lean nitrogen oxidecatalyst and particulate filter for retr<strong>of</strong>itting certainhighway diesel engines built in 1994 or later. TheLongview system, designed by Cleaire AdvancedEmission Controls as a muffler replacement unit,is the first retr<strong>of</strong>it equipment available for nitrogenoxide control and has been verified to reducenitrogen oxides by 25 percent and particulates by85 percent, with a fuel economy penalty betweenthree and seven percent depending on the application(CARB, 2003). As yet, no lean nitrogenoxide catalysts or particulate filters are approvedfor use on <strong>of</strong>f-highway diesel engines, thoughCleaire is seeking to extend its verification toinclude certain <strong>of</strong>f-highway engines.
20 l<strong>Union</strong> <strong>of</strong> <strong>Concerned</strong> <strong>Scientists</strong>Fuel formulation changesLOW-SULFUR FUELWhat is it? Low-sulfur fuel contains no morethan 15 parts per million (ppm) <strong>of</strong> sulfur. Becausethe EPA currently has no controls on the sulfurlevel in heavy diesel equipment fuel, sulfur levelsmay exceed 3,000 ppm—more than six timeshigher than the level in highway diesel fuel, whichis held to a maximum sulfur content <strong>of</strong> 500 ppm(dropping down to 15 ppm in mid-2006).The EPA anticipates that reducing the amount<strong>of</strong> sulfur from 500 to 15 ppm will reduce sulfateparticulates and sulfur oxide emissions by 97 percent(EPA, 1995). Perhaps more significantly forpublic health, many advanced emission controlsrequire the use <strong>of</strong> low-sulfur fuel in order to functionproperly. Sulfur either impairs or totally compromisesthe performance <strong>of</strong> control technologiessuch as oxidation catalysts, particulate filters,lean nitrogen oxide catalysts, and exhaust gasrecirculation.Current use and outlook: Low-sulfur dieselfuel is currently available in limited geographicpockets across the country, but will be widelyavailable for use in highway vehicles starting in2007. In order to harmonize emissions standardsbetween the highway and <strong>of</strong>f-highway sectors, theallowable sulfur level in heavy diesel equipmentmust also fall to 15 ppm. The EPA has consideredan interim step <strong>of</strong> dropping the sulfur level to500 ppm, but this tiered approach could compromisethe 2007 highway standards.One <strong>of</strong> the key problems with maintainingdifferent sulfur levels in fuels is the risk <strong>of</strong> crosscontamination.There may be a magnitude differencebetween the sulfur levels <strong>of</strong> highway vehicles(15 ppm), heavy diesel equipment (500 to 3,000or more ppm), and home heating oil (3,000 ormore ppm). While refineries can take steps toensure that high- and low-sulfur diesel fuel suppliesremain separate, distribution and marketing networksmay have difficulty maintaining strict separation.Low-sulfur diesel, for example, can beeasily contaminated if stored in tanks that previouslyhoused higher-sulfur fuels. Such contaminationcould lead to serious performance problemsin emission control for both highway vehicles andheavy diesel equipment. The surest method forprotecting emission controls from sulfur contaminationis to hold all diesel fuels—whether for highwayvehicles, heavy equipment, marine vessels,locomotives, or home heating—to a maximumsulfur level <strong>of</strong> 15 ppm.BIODIESELWhat is it? Biodiesel is an alternative dieselfuel commonly composed <strong>of</strong> 20 percent purebiodiesel (derived from biological material such asplants or animal fats) and 80 percent conventionaldiesel fuel. Emissions <strong>of</strong> particulates, air toxics,carbon monoxide, and hydrocarbons are all reducedin biodiesel relative to conventional dieselfuels. However, nitrogen oxide emissions are increased.According to the EPA, soybean-based purebiodiesel produces a 45 percent reduction in particulatesand a 10 percent increase in nitrogenoxides relative to diesel (EPA, 2002B). The greaterthe amount <strong>of</strong> pure biodiesel in the fuel, the lowerthe level <strong>of</strong> toxic particulates released. In addition,biodiesel has very low sulfur levels, typicallybelow 15 ppm.Current use and outlook:Biodiesel is gainingappeal in certain applications such as school buses,refuse haulers, and passenger vehicles. However,because it costs significantly more than conventionaldiesel, biodiesel is commonly blendedwith conventional diesel, reducing its emissionsbenefits.
<strong>Cleaning</strong> <strong>Up</strong> <strong>Diesel</strong> <strong>Pollution</strong> l 21LUBRICATING OILSWhat are they? Oils used to lubricate heavydiesel engines can generate particulate emissionsin two ways. First, the metallic portion <strong>of</strong> the oil,which cannot be burned, produces ash. Second,oil that evaporates in the crankcase and diffusesinto the combustion chamber produces soot(<strong>Diesel</strong>Net, 1998). Replacing metal additives withnonmetallic compounds should thus reduce theamount <strong>of</strong> ash generated, and using synthetic oils,which can be formulated to evaporate only withina narrow, high-temperature range, may alsoreduce particulate matter.Current use and outlook: Lubricating oils arenot currently regulated by the EPA. Filling thisregulatory gap could prove a sound strategy forreducing particulate emissions, particularly fromolder vehicles that do not have to meet morestringent emissions standards.CLEANING UP NEW ENGINESA number <strong>of</strong> technologies for cleaning up newheavy diesel equipment are currently available orunder development. New systems combining exhaustgas recirculation, advanced turbochargers,and advanced fuel injection are already being usedin today’s highway vehicles, while technologiesto reduce nitrogen oxides, such as nitrogen oxideadsorbers and selective catalytic reduction, arein the development phase.Engine modificationsEXHAUST GAS RECIRCULATIONWhat is it? Exhaust gas recirculation (EGR)returns a portion <strong>of</strong> the engine’s exhaust to thecombustion chamber. In the process, nitrogenoxide emissions are reduced because inert gasesdisplace some <strong>of</strong> the oxygen that would otherwiseenter the engine. Cooling the exhaust gas before itenters the combustion chamber can reduce emissionseven further. However, EGR may increaseparticulates and engine wear while lowering fueleconomy (<strong>Diesel</strong>Net, 2000). Sulfur in the dieselfuel also poses a corrosive threat to the system.Current use and outlook: EGR has been a keystrategy for manufacturers attempting to complywith the EPA’s stricter nitrogen oxide standardsfor highway trucks and buses (which most manufacturershad to meet by October 2002). CooledEGR will also be a likely necessity for manufacturers<strong>of</strong> heavy diesel equipment between 100and 750 hp in order to meet Tier 3 standardsstarting in 2005.ADVANCED TURBOCHARGERSWhat are they? Turbochargers are compressorsused in many types <strong>of</strong> diesel engines to increaseair pressure. Utilizing the engine’s exhaustgas and a turbine, turbochargers increase enginepower by increasing the amount <strong>of</strong> air inductedinto the engine. Unfortunately, in rapid accelerationor stop-and-go conditions, diesel engines are<strong>of</strong>ten fuel-rich (too much fuel and not enoughair), resulting in unburned emissions <strong>of</strong> hydrocarbons,carbon monoxide, particulates, and smoke.In turbocharged engines, this fuel-rich period,called turbolag, also wastes fuel and lowers fueleconomy. Advanced turbochargers (e.g., variableSpecial Requirements<strong>of</strong> Smaller EnginesEngines rated below 75 hp will require adjustmentsin the form <strong>of</strong> electronic controls, turbochargers,or advanced fuel injection systems in order to employadvanced emission controls for nitrogen oxides andparticulate matter. Nitrogen oxide adsorber catalysts,for example, require engines to modulate between leanand rich operation. Packaging these systems to ensurethat functionality is not compromised will also requirespecial engineering.
22 l<strong>Union</strong> <strong>of</strong> <strong>Concerned</strong> <strong>Scientists</strong>geometry turbochargers) rely on electronic controlsto optimize combustion by controlling theair-to-fuel ratio and prevent over-enrichment duringstop-and-go conditions. Cooling the exhaustgas after compression can further reduce nitrogenoxide emissions and increase system durability.Current use and outlook: Electronic superchargershave demonstrated pollution reductions<strong>of</strong> 20 to 40 percent for particulates and 30 to65 percent for carbon monoxide (MECA, 2000),improving engine performance without penalizingfuel economy.ADVANCED FUEL INJECTIONWhat is it? With electronic controls to optimizefuel injection pressure, fuel spray pattern, injectionrate, and timing, advanced fuel injection systemshave been demonstrated to reduce nitrogen oxideemissions by 50 percent with no significant increasein particulates (Pierpont, 1995). Technologysuch as common-rail fuel injection limits nitrogenoxide formation by varying the rate <strong>of</strong> fuel injectionover the duration <strong>of</strong> the injection period, ensuringthe majority <strong>of</strong> fuel is burned at lower peaktemperatures.Current use and outlook:Heavy diesel equipmentover 100 hp will likely use common-rail fuelinjection systems to meet Tier 3 standards startingin 2005, while engines under 100 hp can use lesseffective rotary injection systems.TOMORROW’S TECHNOLOGIESTo reduce nitrogen oxide emissions 90 percentor more from the Tier 3 level, technologies thathave not yet appeared on the market will be needed.Prototype emission controls such as nitrogenoxide adsorbers and selective catalytic reduction arebeing tested for use on highway vehicles, and one<strong>of</strong> these technologies will likely emerge as the dominantnitrogen oxide-reducing strategy in the nextfew years.Nitrogen oxide adsorbersWhat are they? By trapping nitrogen oxidesin a catalyst washcoat during oxygen-rich drivingconditions, and releasing the nitrogen laterin lean conditions, nitrogen oxide adsorbers,or traps, can potentially reduce nitrogen oxides80 percent or more. Before this technology canbe marketed, however, certain technical hurdlesmust be overcome. Current systems have notproved durable over the exhaust temperaturepr<strong>of</strong>ile typical <strong>of</strong> diesel engines (Duo and Bailey,1998), or able to tolerate sulfur contamination.Nitrogen oxide adsorbers require the periodicinjection <strong>of</strong> a reducing agent such as hydrocarbonsin order to regenerate the catalyst washcoat. Thiscan be accomplished by either injecting fuel intothe engine on the exhaust stroke (in single-pathsystems) or by switching the exhaust (in dual-pathsystems) and injecting fuel to regenerate onecatalyst bed while the parallel catalyst bed isadsorbing nitrogen oxides. Single-path systemsrequire less capital, but at the cost <strong>of</strong> a fuel economypenalty. Dual-path systems have a lower fueleconomy penalty since less fuel is necessary in theclosed catalyst bed, but the capital costs are higher.The complex exhaust configurations and valvesnecessary for exhaust flow management andcatalyst regeneration make this technology anexpensive option.Further engineering considerations include thefact that nitrogen oxide adsorbers must be able tomanage higher exhaust temperatures both in theengine (at the exhaust manifold) and within theexhaust components and catalysts. Adsorbers alsorequire a good deal <strong>of</strong> space, with volumes rangingfrom as low as 1.5 times engine displacementfor a single-path system to five times for a dualpathsystem.Current use and outlook: This technology <strong>of</strong>fersthe greatest promise for meeting the 90 percentcontrol level established by forthcoming highway
<strong>Cleaning</strong> <strong>Up</strong> <strong>Diesel</strong> <strong>Pollution</strong> l 23emissions standards for nitrogen oxides. Adsorbershave been successfully demonstrated in commercialuse with lean-burning gasoline engines,but they have not been tested in diesel engines,which raises concerns about fuel contaminantsthat might reduce the catalyst’s effectiveness.Unlike selective catalytic reduction (see below),nitrogen oxide adsorbers are self-contained anddo not require the continual replenishment <strong>of</strong>a reagent. Opportunities to defeat this type <strong>of</strong>system are more limited than with selectivecatalytic reduction.Selective catalytic reductionWhat is it? Selective catalytic reduction(SCR) reduces nitrogen oxide emissions by usinga chemical reagent (typically ammonia or urea) toconvert nitrogen oxides to gaseous nitrogen andwater vapor. This process can theoretically reducenitrogen oxides more than 90 percent, and alsocontrol hydrocarbon and particulate matter emissions.However, SCR is sensitive to the timingand amount <strong>of</strong> reagent, variations in exhaust temperature,exhaust gas flow, and concentration <strong>of</strong>nitrogen oxides in the exhaust.Toxic pollution in the form <strong>of</strong> ammoniumnitrate particulates and ammonia can result ifthe reagent is injected at the wrong time or in thewrong amount (<strong>Diesel</strong>Net, 2000B). If not enoughurea is injected, for example, the catalyst stopsworking and nitrogen oxides are no longer reduced.If too much urea is injected, it passes through thecatalyst (termed “slip”) and is emitted into theatmosphere as ammonia. Increasing the catalystvolume can alleviate this issue, but at the cost <strong>of</strong>money and space. The catalyst may also be susceptibleto poisoning from diesel exhaust constituentssuch as lube oil additives.Because SCR requires sufficient exhaust temperaturesto operate correctly, cold-start operationand excess idle are problematic. The catalyst alsorequires a larger amount <strong>of</strong> space than other emissioncontrol technologies (potentially two to threetimes engine displacement), but it is relativelyinexpensive and the materials are widely available.Current use and outlook: SCR has been usedfor years on stationary engines and some marineapplications, but its use on vehicles is still in thedevelopment phase. The technology has drawnsignificant interest because it may <strong>of</strong>fer the highestlevel <strong>of</strong> nitrogen oxide control, and is beingapplied in demonstration vehicles such as theFord Focus and some <strong>of</strong> the larger Class 8 heavydutytrucks. However, shifting the technologyfrom the steady-state conditions <strong>of</strong> stationarysources to the transient cycles <strong>of</strong> heavy diesel equipmentposes significant challenges. SCR is morecomplex relative to other catalyst systems, largerin size, and more costly. In addition, users mustperiodically replenish the reagent, and there is currentlyneither an established distribution networkfor the reagent nor any incentive for vehicleoperators to pay the additional cost.Europeans consider SCR one <strong>of</strong> the frontrunningtechnologies for meeting future emissionsstandards, but it is unclear whether the technologywill pass verification tests in the United States.Concerns about secondary pollution from theaccidental release <strong>of</strong> urea or ammonia, as well asthe durability and real-world performance <strong>of</strong>SCR, continue to plague its development.ENSURING LONG-TERMPOLLUTION REDUCTIONEmerging exhaust control technologies such asselective catalytic reduction and particulate filtersare new and relatively untested, and how they willperform under real-world conditions remains tobe seen. Our experience with automotive emissioncontrols indicates that it may take decades for thetechnology to realize its potential. The eventualsuccess <strong>of</strong> such controls is predicated on two key
24 l<strong>Union</strong> <strong>of</strong> <strong>Concerned</strong> <strong>Scientists</strong>factors: The equipment must be effective over avehicle’s lifetime, and emissions must be periodicallyinspected through an inspection and maintenanceprogram.Unlike passenger cars and trucks, <strong>of</strong>f-highwaydiesel engines and heavy trucks and buses arenot tested for real-world emissions. Heavy dieselengines must undergo a dynamometer test thatmeasures the total mass <strong>of</strong> particles emitted perunit <strong>of</strong> energy (grams <strong>of</strong> pollutant per brake horsepowerhour), but this test does not measure“in-use” emissions, which vary based on actualdriving conditions, engine deterioration, andvehicle maintenance. An in-use test would moreclosely approximate the actual levels <strong>of</strong> air pollutionreleased from heavy diesel vehicles, and providea more accurate picture <strong>of</strong> the resultinghuman exposure to pollution.The limited data available from real-worldtests suggest that diesel engines may release morepollutants than certification standards indicate,especially particulate matter. <strong>Diesel</strong> trucks andbuses, for example, may have released two to sixtimes more particulate pollution than indicatedby certification standards, while natural gas vehicleshave maintained their emissions performance(Turner et al., 2000; West Virginia University,1997). If historical experience is a guide, real-worldemissions from aftertreatment technologies mayalso be higher than certification tests indicate. Some<strong>of</strong> the more complicated systems, such as activeparticulate filters or selective catalytic reduction,may even have higher rates <strong>of</strong> degradation andfailure.Furthermore, aftertreatment technologies thatrequire upkeep or reduce a vehicle’s fuel economymay suffer from tampering or misuse. Manufacturersresponsible for the majority <strong>of</strong> heavy dieselengine sales, for example, allegedly used “defeatdevices” in the 1990s to bypass air pollution regulationscovering nitrogen oxides. Trucks and busesusing these devices released up to 70 percent morepollution than “legal” vehicles (Mark and Morey,2000). In 1998, the manufacturers agreed to stopusing defeat devices in a settlement with theEPA and CARB.<strong>Diesel</strong> cleanup technologies may struggle tostay clean over the 20, 30, and even 40 years thatdiesel engines can remain in operation. A variety<strong>of</strong> factors such as engine design, fuel sulfur content,vehicle maintenance, and certification determinewhether a new aftertreatment technology willbe effective over the useful life <strong>of</strong> a heavy dieselengine. To ensure that exhaust control technologiesdeliver on their environmental promise, aneffective and enforceable in-use inspection andmaintenance program including onboard diagnosticsystems designed to detect malfunctions,chassis-based testing, and fuel auditing and specialnozzle applicators to prevent misfueling is needed.In addition, aftertreatment devices should last theuseful life <strong>of</strong> the vehicle. Without these safeguardsin place, there is no guarantee that the technologywill continue providing emissions benefits for ameaningful amount <strong>of</strong> time.
<strong>Cleaning</strong> <strong>Up</strong> <strong>Diesel</strong> <strong>Pollution</strong> l 25Chapter 4CASE STUDIESIn evaluating the cost and emissions impact <strong>of</strong>installing state-<strong>of</strong>-the-art pollution controls onfour types <strong>of</strong> heavy diesel equipment, UCS foundthat the most sophisticated controls (particulatefilters and nitrogen oxide adsorbers) increasedequipment costs by only one to three percent,while reducing pollutants by about 90 percent.The cost <strong>of</strong> adding these controls easily met EPAcost-effectiveness criteria for all four types <strong>of</strong> equipment.Furthermore, our analysis may actuallyoverestimate the long-term costs <strong>of</strong> these controls,which should become less expensive as economies<strong>of</strong> scale, materials recycling, and engineeringexpertise push prices down.TYPES OF EQUIPMENTThe equipment in our case studies ranged inpower from 75 to more than 400 hp, and variedin purpose from farming to construction and industrialprojects (Table 7, p.26). The first type <strong>of</strong>equipment we evaluated is used to till soil (tractor),the second to excavate (hydraulic excavator), thethird to thresh grain (agricultural combine), andthe fourth to haul heavy loads (articulated hauler).TractorTractors are a familiar symbol <strong>of</strong> Americanfarms, and are considered one <strong>of</strong> the most essentialpieces <strong>of</strong> agricultural equipment. Most tractorssold in the United States—more than 125,000annually—are small (less than 99 hp). Engines<strong>of</strong> this size are commonly used in European lightdutyvehicles, which may allow for some technologycarry-over.ExcavatorCommon to most construction sites, hydraulicexcavators are used to dig into the earth and moveheavy materials. About 15,000 to 20,000 <strong>of</strong> theseengines are sold in the United States every year;the 180 hp engine we evaluated represents themid-size range.TractorExcavator
26 l<strong>Union</strong> <strong>of</strong> <strong>Concerned</strong> <strong>Scientists</strong>CombineCombineAgricultural combines cut and thresh grain.Because they are costly, only about 6,000 are soldevery year, mostly to large-scale farming operations,and despite generally being used on a seasonalbasis only, they have high utilization factors. The285 hp engine we evaluated is subject to the ConsentDecree pull-ahead standards, and must meetTier 3 levels starting in 2006.Articulated hauler (dump truck)Articulated haulers move large volumes <strong>of</strong>material, allowing other site machinery such asloaders and excavators to operate more efficiently.Only 2,000 <strong>of</strong> these vehicles are sold every year;Articulated haulerour case study examines a large hauler (just over400 hp).TECHNICAL ASSUMPTIONSEmissions analysisTo establish an emissions baseline, we assumedall four engines meet the emissions standards currentlyin place (Table 8). All <strong>of</strong> the engines willneed to meet the more stringent Tier 3 emissionsstandards coming into effect in the next severalyears, which will likely require variable geometryturbochargers and exhaust gas recirculation. Thesetechnologies are already being used in new highwaytrucks and buses.Table 7 Assumed Power and Operating Characteristics<strong>of</strong> Four Types <strong>of</strong> <strong>Diesel</strong> EqupmentUnitsTractorHydraulicExcavatorCombineArticulatedHaulerPower horsepower 75 180 285 420Engine displacement liters 4.5 7.2 8.3 12.0Engine output kilowatt hours/year 15,680 86,514 18,816 303,353Annual operation hours/year 475 1,092 150 1,641Load factor percent 59% 59% 59% 59%Equipment lifetime years 17 7 25 7Annual fuel usage gallons/year 1,274 7,030 1,529 24,651SOURCE: U.S. EPA NONROAD model and background support documents, located online at: www.epa.gov/otaq/nonrdmdl.htm.
<strong>Cleaning</strong> <strong>Up</strong> <strong>Diesel</strong> <strong>Pollution</strong> l 27Table 8 Baseline vs. New Stronger Emissions StandardsNitrogen Oxide Standards(grams per horsepower hour, g/hp-hr)Particulate Matter Standards(grams per horsepower hour, g/hp-hr)VehicleToday’sStandards(Tier 3)StrongerStandardsEmissionReductionToday’sStandards(Tier 3)StrongerStandardsEmissionReductionTractor 3.2 0.30 91% 0.3 0.01 97%Hydraulic Excavator 2.7 0.30 89% 0.1 0.01 93%Combine 2.7 0.30 89% 0.1 0.01 93%Articulated Hauler 2.7 0.30 89% 0.1 0.01 93%<strong>Pollution</strong> controlsWe evaluated the costs <strong>of</strong> installing nitrogenoxide adsorbers and particulate filters, which canreduce nitrogen oxide and particulate matteremissions 90 percent or more, on all four engines.While particulate filters have proven to be thedominant strategy for soot control, no clear winnerin the race to control nitrogen oxides has yetemerged. We chose to model the costs <strong>of</strong> nitrogenoxide adsorbers rather than their main competition,selective catalytic reduction (SCR), eventhough SCR appears to be less expensive. SCRneeds to overcome significant hurdles before itcan be considered a foolpro<strong>of</strong> nitrogen oxide controlstrategy: lack <strong>of</strong> a dual-fuel infrastructure, vulnerability<strong>of</strong> the system to tampering and misuse,potential for a toxic release <strong>of</strong> ammonia into theenvironment, and difficulties <strong>of</strong> modifying a technologyoriginally designed for steady-state enginesto perform across transient vehicle cycles.TECHNICAL ISSUESTwo key technical issues must be addressed wheninstalling pollution controls in heavy diesel equipment:emission control packaging and exhausttemperature. Since heavy diesel engines are designedfor specific functions, emission controls (whichare scaled in size to engine displacement, or thesize <strong>of</strong> the compression chambers), need to bepackaged appropriately to ensure engine function-ality is preserved. Exhaust temperature needs tobe controlled to ensure that emission controlsfunction properly.CostOur analysis takes into account the costs <strong>of</strong>installation, labor, catalyst, materials, active enginecontrols, and packaging. Since heavy diesel equip-Should Gasoline Replace <strong>Diesel</strong>?For engines under 75 hp, additional equipment isneeded to ensure that pollution controls functionproperly. Conventional smaller engines with nitrogenoxide adsorbers, for example, require either in-cylinderpost-fuel injection or supplemental in-exhaust fueladdition (MECA, 2003). Electronic controls may alsobe necessary to ensure filter regeneration.Gasoline-powered, spark-ignited engines withthree-way catalysts may <strong>of</strong>fer the most cost-effectiveemissions reductions for smaller engines. New technologiessuch as variable valve actuation could improvethe efficiency <strong>of</strong> spark-ignited gasoline engines,allowing them to compete with diesel for power, torque,durability, and fuel economy. One recent study, in fact,concluded that low particulate and nitrogen oxideemission levels could be achieved more cost-effectivelyin spark-ignited gasoline engines than dieselengines (SRI, 2003). The EPA has considered allowingsmaller diesel engines to pollute at higher levels, butthis kind <strong>of</strong> exemption could retard the development<strong>of</strong> cleaner, more cost-effective gasoline engines.
28 l<strong>Union</strong> <strong>of</strong> <strong>Concerned</strong> <strong>Scientists</strong>ment can adopt technologies currently beingdeveloped for highway trucks and buses, someeconomies <strong>of</strong> scale should be readily achieved.Therefore, our case studies assume a mediumto high range <strong>of</strong> production.Because particulate filters only entered theU.S. market in 2000, costs are anticipated to fallsignificantly once mass production achieves economies<strong>of</strong> scale, reduced labor investment, and preciousmetal optimization. We assume that particulatefilters range in cost from about $835 for thesmallest engine in our analysis (the 75 hp tractor)to nearly $2,100 for the largest engine (the articulatedhauler).Although nitrogen oxide control deviceshave less expensive catalyst materials than particulatefilters, nitrogen oxide adsorbers must becoupled with active engine management to ensurecatalyst regeneration. We assume the costsfor such nitrogen oxide controls range fromabout $670 to $1,440.Cost-EffectivenessThe EPA classifies cost-effective emissionreductions as $13,000 per ton <strong>of</strong> nitrogen oxidesreduced and $40,000 per ton <strong>of</strong> particulatematter reduced (EPA, 2000).RESULTSAdding state-<strong>of</strong>-the-art pollution controls tothe engines in our case studies increases equipmentcosts one to three percent—an investmenteasily justified under EPA cost-effectivenesscriteria. Nitrogen oxide controls are particularlycost-effective, ranging from $187 to $645 per ton(Table 9).While our cost estimates reflect today’s bestengineering judgment, it is possible that our estimateswill exceed the actual costs <strong>of</strong> compliancewith stronger emissions standards. Implementation<strong>of</strong> the highway diesel rule will generate alarge market for emission control technologies,and stronger standards for heavy diesel equipmentwill fuel market growth. The high cost <strong>of</strong>catalysts for particulate filters and nitrogen oxideadsorbers will drop as materials recycling and optimizationreduce demand. Historically, analystshave overestimated the price <strong>of</strong> pollution controlsand cleaner air, but even if our estimates were todouble, emission controls for nitrogen oxides andparticulates would still qualify for investmentunder the EPA’s cost-effectiveness guidelines.Table 9 Cost-Effectiveness <strong>of</strong> Stonger Emissions StandardsUnitsTractorHydraulicExcavatorCombineArticulatedHaulerNOx emissions reduced pounds/lifetime 2,186 4,280 3,212 14,978NOx control cost $/NOx controls $669 $948 $1,071 $1,443NOx cost-effectiveness $/ton $607 $429 $645 $187PM emissions reduced pounds/lifetime 281 487 365 1,703PM control cost $/PM controls $835 $1,287 $1,471 $2,090PM cost-effectiveness $/ton $7,496 $9,959 $15,165 $4,621Today’s equipment costs $/equipment $50,000 $90,000 $120,000 $275,000Cost <strong>of</strong> pollution controls $/control equipment $1,504 $2,235 $2,542 $3,533Increase in equipment cost percentage 3% 3% 2% 1%SOURCE: UCS estimated the amount <strong>of</strong> emissions reduced by applying the U.S. EPA NONROAD model and its background support documents,located online at: www.epa.gov/otaq/nonrdmdl.htm. Control and equipment costs were estimated by M.J. Bradley and Associates, 2003.
<strong>Cleaning</strong> <strong>Up</strong> <strong>Diesel</strong> <strong>Pollution</strong> l 29Chapter 5BEYOND DIESELThere are alternatives to diesel compressionignitionengines that can reduce pollution,increase our energy independence, and put us ona path toward the longer-term development <strong>of</strong>zero-emission engines. Alternative fuels such aselectricity, natural gas, and ethanol allow us todiversify our energy sources while reducing toxicpollution. Hybrid technologies provide improvedfuel economy, lower emissions, and a better understanding<strong>of</strong> how electric drives function. Ultimately,we need to move beyond both diesel andthe internal combustion engine and turn insteadto hydrogen-powered fuel cells, which <strong>of</strong>fer thepotential for pollution-free transportation.ALTERNATIVE FUELSAlternative-fuel engines, which can be poweredby natural gas, liquefied petroleum gas (propane),ethanol, methanol, electricity, liquefied natural gas,and hydrogen, are widely used in highway vehicles,particularly in transit and refuse fleets. Althoughfew <strong>of</strong> these engines are currently available for usein the heavy equipment sector, alternative fuels suchas electricity and natural gas power a growing number<strong>of</strong> agricultural pumps and airport support vehicles.The cleanest alternative fuel currently used inthe United States is natural gas, most <strong>of</strong>ten in itscompressed form. 5 Natural gas is a fossil fuel likegasoline or diesel, but because it is inherently cleanerthan oil, it does not need significant refinement toremove contaminants. Natural gas engines do havetoxic emissions, but the trace amount <strong>of</strong> toxic particulatesis generally attributed to crankcase lubricatingoil and not the fuel itself (DOE, 2000). Decreasingthe metallic portion <strong>of</strong> the lubricating oil, usingsynthetic oils that <strong>of</strong>fer improved performance, andensuring the engine is properly sealed to preventleaks could reduce these emissions.Like gasoline engines, natural gas engines aregenerally spark-ignited and use a throttle to controlfuel input, resulting in lower fuel economy relativeto diesel. 6 Next-generation natural gas engines usinghigh-pressure direct injection can approach the highefficiency, lower heat loss, and high energy output<strong>of</strong> diesel engines, potentially reducing nitrogen oxides37 percent and particulate matter 70 percent relativeto diesel (Oueliette, 2000). However, these enginesdo not perform as well as spark-ignited naturalgas engines in reducing particulate matter.Studies comparing particulate matter and smogformingemissions from natural gas and diesel engineshave, until recently, consistently found natural gasto be the cleaner fuel. The advent <strong>of</strong> emission controltechnologies, especially particulate filters, gives dieselthe opportunity to compete more closely with naturalgas for the lowest emissions, both in mass andtoxicity (Ahlvik and Brandberg, 2000; LeTavec, 2000).While concern about the long-term performance<strong>of</strong> diesel exhaust controls remains, alternative-fuelengines can become even cleaner by adopting5 Compared with a conventional diesel fuel tank, a compressed natural gas tank (which stores the gas at pressures <strong>of</strong> 3,000 to 3,600 pounds persquare inch) requires three to four times the space and weighs two to three times more (Cannon et al., 2000).6 Natural gas engines can achieve 10 percent higher fuel economy or better compared with gasoline engines because their compression ratios areadjusted to take advantage <strong>of</strong> the higher octane rating <strong>of</strong> natural gas. Regular unleaded gasoline has an octane rating <strong>of</strong> 87, while the octane rating<strong>of</strong> natural gas is 130.
30 l<strong>Union</strong> <strong>of</strong> <strong>Concerned</strong> <strong>Scientists</strong>particulate filters, oxidation catalysts, and nitrogenoxide catalysts. As long as similar technologiesare applied to both natural gas and diesel engines,natural gas, which is inherently cleaner than dieseland does not suffer from sulfur contamination,should retain its emissions advantage and provecleaner over a vehicle’s lifetime.Natural gas also serves as a stepping-stone toanother gaseous fuel, hydrogen, and the eventualmarket penetration <strong>of</strong> hydrogen-powered fuelcells. Since most <strong>of</strong> today’s commercial hydrogenis reformed from natural gas—the least costly source<strong>of</strong> hydrogen fuel at the moment—building an infrastructurefor natural gas should support longertermdevelopment <strong>of</strong> zero-emission vehiclespowered by hydrogen fuel cells.HYBRIDSHybrid engines combine the advantages <strong>of</strong>internal combustion and electricity, and can runon either diesel or alternative fuels. While a conventionalinternal combustion engine is mechanicallyattached to the vehicle’s wheels through thetransmission and driveshaft, hybrid vehicles usean electric motor to turn the wheels. Through aprocess called regenerative braking, hybrids alsorecover part <strong>of</strong> the braking energy that wouldotherwise be lost as heat, storing it for use duringrapid acceleration. And, by turning the engine<strong>of</strong>f while at rest, hybrids reduce both tailpipeemissions and noise.This technology <strong>of</strong>fers several advantages overa standard internal combustion engine. First, theengine’s increased efficiency translates into higherfuel economy (as long as power is not diverted tovehicle amenities). Second, electric energy contributesno tailpipe emissions. Third, like naturalgas vehicles, hybrid technology moves us closerto fuel cells, which generate electricity to drivethe vehicle.FUEL CELLSFuel cells produce electricity through achemical reaction between hydrogen and oxygen,a process that is both more efficient than internalcombustion and much cleaner, since it creates notailpipe emissions. The hydrogen needed to powera fuel cell can be derived from renewable sourcessuch as solar energy or from traditional sourcessuch as gasoline, methanol, and natural gas. Fornow, natural gas is the least costly source <strong>of</strong>hydrogen.Fuel cell vehicles are in the prototype phase<strong>of</strong> development, and it may be several years beforethey are a reliable and cost-effective commercialproduct. Every automaker is engaged in researchand development on these vehicles, and severalU.S. transit agencies are experimenting withprototype buses. The promise <strong>of</strong> pollution-free,cost-effective transportation may ultimately makethe internal combustion engine obsolete andrevolutionize vehicle technology.
<strong>Cleaning</strong> <strong>Up</strong> <strong>Diesel</strong> <strong>Pollution</strong> l 31Chapter 6PAVING THE WAY: SMART PUBLIC POLICIES<strong>Cleaning</strong> up both new diesel equipment and themore than six million diesel engines alreadyin use will require a combination <strong>of</strong> federal, state,and local action. Only federal action can ensure newengines are held to the same strict standards thatexisting trucks and buses must meet, and federalin-use testing protocols are needed to ensure enginesand retr<strong>of</strong>it equipment remain clean throughouta vehicle’s useful life. However, states, local governments,and communities must shoulder theresponsibility <strong>of</strong> cleaning up the pollution fromolder engines. A combination <strong>of</strong> state regulations,policies, and incentives can promote retr<strong>of</strong>its andthe purchase <strong>of</strong> cleaner technologies, while localefforts to reduce diesel emissions in vulnerablecommunities can be replicated across the country.FEDERAL ACTIONWithout strong federal regulations, it will bedifficult to reduce pollution from new <strong>of</strong>f-highwaydiesel vehicles and engines. The federal Clean AirAct does not allow states to regulate new constructionand farm equipment below 175 hp, new locomotivesand locomotive engines, and commercial marineengines.Step one: Require low-sulfur fuelLow-sulfur diesel fuel (15 ppm sulfur) must bemandated for all diesel vehicles. The performance<strong>of</strong> advanced emission controls can be impaired orcompletely compromised by sulfur contaminationfrom standard <strong>of</strong>f-highway diesel fuel, which containsat least 200 times more sulfur than necessary. Sincehighway diesel vehicles will be required to use lowsulfurfuel starting in late 2006, refineries are alreadyinvesting in the technology required to reduce sulfurlevels. Requiring alldiesel fuels—whether intendedfor highway trucks and buses, heavy diesel equipment,commercial marine vessels, or locomotives—to uselow-sulfur fuel will prevent misfueling and help protectsensitive emission controls from contamination.Step two: Pass stronger standardsfor heavy equipmentThe EPA needs to harmonize its emission standardsfor heavy diesel equipment with the strongerstandards already faced by highway diesel trucks andbuses. In addition to ensuring regulatory parity,stronger standards will create economies <strong>of</strong> scale thatpush down the price <strong>of</strong> cleanup equipment. Thecost <strong>of</strong> reducing pollution from heavy diesel vehiclescan be kept relatively modest by capitalizing onemission control technologies under developmentfor highway vehicles.Step three: Regulate trains and shipsThe EPA also needs to turn its attention to other“<strong>of</strong>f-highway” equipment such as locomotives andcommercial marine vessels. Trains and ships currentlycontribute about 12 percent <strong>of</strong> all emissions frommobile sources, and their share will grow as otherhighway and <strong>of</strong>f-highway engines become cleaner.Step four: Implement an in-usetesting programFinally, the EPA must ensure that new enginesheld to stricter emissions standards remain cleanover their useful lifetime. The limited data availablefrom real-world tests suggest that diesel engines mayrelease two to six times more pollutants than certi-
32 l<strong>Union</strong> <strong>of</strong> <strong>Concerned</strong> <strong>Scientists</strong>fication standards indicate, especially for particulatematter. If historical experience is a guide, real-worldemissions from new aftertreatment technologies mayspike in the first few years, and systems that requiremore maintenance, such as active particulate filtersand selective catalytic reduction, may have higherrates <strong>of</strong> degradation and failure. In-use testing,onboard diagnostics, and enforcement are necessaryto translate stronger standards into public health gains.STATE AND LOCAL ACTIONStates, local governments, and communities mustwork together to develop and implement innovativeprograms for retr<strong>of</strong>itting diesel equipment. Here area few examples that not only attest to the power<strong>of</strong> a concerted effort to reduce public exposure todiesel pollution, but can also serve as models forthe rest <strong>of</strong> the country.California incentivesThe Golden State’s Carl Moyer Program (CMP)is one <strong>of</strong> the nation’s most creative means for encouragingthe retirement <strong>of</strong> older diesel engines andtheir replacement with newer, cleaner alternatives.By funding the extra capital cost <strong>of</strong> vehicles andequipment that reduce smog-forming nitrogen oxides,this grant program allows diesel highway and <strong>of</strong>fhighwayengines to be replaced with cleaner naturalgas, electric, and diesel engines, helping Californiameet its air quality obligations with critical near-termemission reductions.The CMP successfully reduced smog-formingnitrogen oxide emissions by about 14 tons per daybetween 1999 and 2002—the equivalent <strong>of</strong> approximatelyone percent <strong>of</strong> the state’s total nitrogen oxideemissions from highway vehicles. As <strong>of</strong> April2002, the CMP had also replaced nearly 2,000 olderdiesel engines with new, cleaner diesel engines(primarily in marine vessels, <strong>of</strong>f-highway equipment,and irrigation pumps), and funded more than1,900 alternative-fuel vehicles (mainly transitbuses and refuse trucks). The average cost-effectiveness<strong>of</strong> these projects was about $3,500 per ton<strong>of</strong> nitrogen oxides reduced—well below the$13,000 per ton program limit.Port <strong>of</strong> Los AngelesEnvironmental and community groups, includingthe Natural Resources Defense Council and SanPedro and Peninsula Homeowners United, initiateda legal action against the City and Port <strong>of</strong> Los Angelesover a planned port expansion that would have increasedpollution (NRDC, 2003). The city admittedthat a single cargo vessel can emit as much as a ton<strong>of</strong> smog-forming nitrogen oxides and nearly 100pounds <strong>of</strong> small particles or soot during a singleday in its berth.In March 2003, the parties agreed to a legalsettlement with three key components. First, thesettlement established a $50 million cleanup fundfor air quality and aesthetic mitigation in the portarea. Second, it required the port and city to preparean environmental impact report on the new terminal.And third, it mandated that the port implementspecific steps to reduce pollution, such as usingalternative-fuel trucks instead <strong>of</strong> diesel vehicles at thesite and providing ships with electric power so theydo not have to idle their diesel engines while docked.Boston’s “Big Dig”In the late 1990s, a plan to build more than160 lane miles <strong>of</strong> freeway through the middle <strong>of</strong>downtown Boston raised community concernsabout pollution from construction vehicles in adensely populated and already polluted area. The“Big Dig”—the largest federal construction projectin the country—is one <strong>of</strong> the first efforts to retr<strong>of</strong>ita large number <strong>of</strong> construction vehicles withoxidation catalysts and particulate filters. A coalition<strong>of</strong> federal, state, and local <strong>of</strong>ficials, environmentalorganizations, and community groups workedtogether to develop the Clean Air Construction
<strong>Cleaning</strong> <strong>Up</strong> <strong>Diesel</strong> <strong>Pollution</strong> l 33Initiative, which resulted in the installation <strong>of</strong>120 oxidation catalysts on construction vehiclesand another 100 planned for the future (ALA &ED, 2003). These retr<strong>of</strong>its should reduce particulatematter by some 200 tons over the project’sremaining four or five years.New York’s World Trade CenterOne <strong>of</strong> the largest cleanup and rebuildingefforts in recent history is taking place at thelower Manhattan site <strong>of</strong> the former World TradeCenter. Air pollution has been a serious concernsince September 11, 2001, with cleanup crews stillstruggling to remove toxic soot and debris frombuildings and ventilation systems. After the stateand city governments, environmental groups, andcommunity members raised concerns about theadded pollution from diesel construction andcleanup equipment, Governor Pataki and theNew York State Department <strong>of</strong> EnvironmentalConservation responded in September 2002 byrequiring construction vehicles working downtownto use low-sulfur fuel and be retr<strong>of</strong>itted withthe “best available” pollution control technology.These modest steps to mitigate the impact <strong>of</strong> therebuilding process <strong>of</strong>fer a “green construction”path that should be replicated throughout thecountry.
34 l<strong>Union</strong> <strong>of</strong> <strong>Concerned</strong> <strong>Scientists</strong>REFERENCESAhlvik, P.J.E. and A.R.L. Brandberg. 2000. “RelativeImpact on Environment and Health from the Introduction<strong>of</strong> Low Emission City Buses in Sweden.” Society<strong>of</strong> Automotive Engineers. 2000-01-1882. Warrendale, Pa.American Lung Association (ALA) and EnvironmentalDefense (ED). 2003. Closing the <strong>Diesel</strong> Divide. NewYork, N.Y. Online at: www.environmentaldefense.org/documents/2738_<strong>Diesel</strong>Divide.pdf.American Lung Association (ALA). 2002. “What is EnvironmentalJustice?” Online at: www.californialung.org/spotlight/cleanair02_ej.html.American Thoracic Society (ATS). 1996. “HealthEffects <strong>of</strong> Outdoor Air <strong>Pollution</strong>.” Am J Resp & CritCare Med. 153:3-50.Andersson, J. and B. Wedekind. 2001. “ParticulateResearch Programme: Summary Report.” RicardoConsulting Engineers. May.Bagley, S.T. 1996. “Characterization <strong>of</strong> Fuel and AftertreatmentDevice Effects <strong>of</strong> <strong>Diesel</strong> Emissions.” ResearchReport Number 76. Topsfield, Mass. Health EffectsInstitute.Brogan, M., A. D. Clark, R. J. Brisley. 1998. “RecentProgress in NOx Trap Technology.” Society forAutomotive Engineers. SAE 980933.Brunekreef, B., N.A. Janssen, J. de Hartog, H.Haressema, M. Knape, P. van Vliet. 1997. “Airpollution from truck traffic and lung function inchildren living near motorways.” Epidemiology.8:298-303.California Air Resources Board (CARB). 2003. “VerificationLetter for Cleaire Longview system.” Sacramento,Calif. September 11. Online at: www.arb.ca.gov/diesel/verifieddevices/verdev.htm.California Air Resources Board (CARB). 2000. “RiskReduction Plan to Reduce Particulate Matter Emissionsfrom <strong>Diesel</strong>-Fueled Engines and Vehicles.” Sacramento,Calif. October.California Air Resources Board (CARB). 1998. “InitialStatement <strong>of</strong> Reasons for Rulemaking: Proposed Identification<strong>of</strong> <strong>Diesel</strong> Exhaust as a Toxic Air Contaminant.”Staff Report. Sacramento, Calif. June.Cannon, J.S. and C. Sun. 2000. Bus Futures: NewTechnologies for Cleaner Cities. New York, N. Y.:INFORM. ISBN 918790-74-8.Ciccone, G., F. Fostastiere, N. Agabati, A. Biggeri,L. Bisanti, E. Chellini. 1998. “Road traffic and adverserespiratory effects in children. SIDRIA CollaborativeGroup.” Occup Environ Med. 55:771-778.Cuddihy, R.G., W.C. Griffith, R.O. McClellan. 1984.“Health risks from light-duty diesel vehicles.” EnvironSci Techno. 18:14a-21a.Department <strong>of</strong> Energy (DOE). 2002. TransportationEnergy Data Book. Edition 22. Center for TransportationAnalysis. Oak Ridge National Laboratory. September.Department <strong>of</strong> Energy (DOE). 2001. “DECSE PhaseI: Evaluating the Effects <strong>of</strong> Sulfur on <strong>Diesel</strong> ParticulateFilters.” January. Online at: www.trucks.doe.gov/research/fuel/decse-filterphase1.html.Department <strong>of</strong> Energy (DOE). 2000. “Natural GasBuses: Separating Myth from Fact.” Alternative FuelInformation Series. Office <strong>of</strong> Energy Efficiency andRenewable Energy. NREL/FS-540-28377. May.<strong>Diesel</strong>Net. 2000. “Effects <strong>of</strong> EGR on Engine andEmissions.” <strong>Diesel</strong>Net Technology Guide. Revision2000.08. Online at: www.<strong>Diesel</strong>Net.com.<strong>Diesel</strong>Net. 2000B. “Selective Catalytic Reduction.”Online at: www.<strong>Diesel</strong>Net.com.
<strong>Cleaning</strong> <strong>Up</strong> <strong>Diesel</strong> <strong>Pollution</strong> l 35<strong>Diesel</strong>Net. 1998. “Emission Control Technologies.”Revision 6. Online at: www.<strong>Diesel</strong>Net.com.Dockery, D.W. and C.A. Pope, III. 1993. “An AssociationBetween Air <strong>Pollution</strong> and Mortality in Six US Cities.”New England Journal <strong>of</strong> Medicine. 329(24):1753-9.Dockery, D.W., F.E. Speizer, D.O. Stram, J.H. Ware,J.D. Spengler. 1989. “Effects <strong>of</strong> inhalable particles onrespiratory health <strong>of</strong> children.” Am Rev Respir Dis. 139:587-594.Duo, D. and O. Bailey. 1998. “Investigation <strong>of</strong> NOxAdsorber Catalyst Deactivation.” Society <strong>of</strong> AutomotiveEngineers. SAE 982594. October.Environmental Protection Agency (EPA). 2003. “AverageAnnual Emissions, All Criteria Pollutants. Years Including1980, 1985, 1989-2001.” Washington, D.C. Onlineat: www.epa.gov/ttn/chief/trends.Environmental Protection Agency (EPA). 2003B. “Control<strong>of</strong> Emissions <strong>of</strong> Air <strong>Pollution</strong> from Nonroad <strong>Diesel</strong> Enginesand Fuel.” Proposed rulemaking submitted for publicationin the Federal Register. Washington, D.C. April 15.Environmental Protection Agency (EPA). 2003C. “OzoneNon-attainment Area Summary as <strong>of</strong> February 6, 2003.”Online at: www.epa.gov/oar/oaqps/greenbk/onsum.html.Environmental Protection Agency (EPA). 2002. HealthAssessment Document for <strong>Diesel</strong> Engine Exhaust. EPA/600/8-90/057F. Washington, D.C. May.Environmental Protection Agency (EPA). 2002B. DraftTechnical Report: A Comprehensive Analysis <strong>of</strong> BiodieselImpacts on Exhaust Emissions. EPA 420-P-02-001.October.Environmental Protection Agency (EPA). 2002C. Letterto Small Businesses on Nonroad <strong>Diesel</strong> Engines and FuelSulfur Standards. Washington, D.C. October 30.Environmental Protection Agency (EPA). 2001. “UrbanBus Retr<strong>of</strong>it Program.” Online at: www.epa.gov/otaq/retr<strong>of</strong>it/retroverifiedlist.htm.Environmental Protection Agency (EPA). 2000.“Heavy Duty Standards/<strong>Diesel</strong> Fuel.” Chapter VI:Cost Effectiveness. May.Environmental Protection Agency (EPA). 1997. “Healthand Environmental Effects <strong>of</strong> Particulate Matter.” Fact sheet.Online at: www.epa.gov/ttn/oarpg/naaqsfin/pmhealth.html.Environmental Protection Agency (EPA). 1995. “HumanHealth Benefits from Sulfate Reduction Under Title IV<strong>of</strong> the 1990 Clean Air Act Amendments.” Office <strong>of</strong> Airand Radiation, Acid Rain Division. Washington, D.C.November.Federal Interagency Forum on Child and Family Statistics.2001. America’s Children: Key National Indicators <strong>of</strong>Well-Being. 2001. Washington, D.C.: U.S. GovernmentPrinting Office. Online at: www.childstats.gov.Gauderman, W.J., R. McConnell, F. Gilliland, S.J. London,D.C. Thomas, E. Avol, H. Vora, K. Berhane, E.B. Rappaport,F. Lurmann, H.G. Margolis, J.M. Peters. 2000.“Association Between Air <strong>Pollution</strong> and Lung FunctionGrowth in Southern California Children.” Am Journal<strong>of</strong> Respiratory & Critical Care Medicine. 162:1384-1390.Intergovernmental Panel on Climate Change (IPCC).2001. Climate Change 2001: Impacts, Adaptation andVulnerability. Summary for Policymakers. Cambridge,U.K.: Cambridge University Press.Jacobson, M.Z. 2001. “Strong radiative heating dueto the mixing state <strong>of</strong> black carbon in atmosphericaerosols.” Nature. 409:695-697.Kittelson, D.B. 1998. “Engines and Nanoparticles:A Review.” Journal <strong>of</strong> Aerosol Science. 29(5):575-588.Koren, H.S. 1995. “Associations between CriteriaAir Pollutants and Asthma.” Health Effects ResearchLaboratory. U.S. EPA. Presented at the Workshop onAir Toxics and Asthma—Impacts and End Points.Houston, Tex. February 4.LeTavec, C., J. Uihlein, J. Segal, K. Vertin. 2000.“EC-<strong>Diesel</strong> Technology Validation. Program InterimReport.” Society <strong>of</strong> Automotive Engineers. 2000-01-1854.Lozano, P., S.D. Sullivan, D.H. Smith, K.B. Weiss. 1999.“The economic burden <strong>of</strong> asthma in US children: Estimatesfrom the National Medical Expenditure Survey.”J Allergy Clin Immunol. 104(5):957-963.
36 l<strong>Union</strong> <strong>of</strong> <strong>Concerned</strong> <strong>Scientists</strong>Majewski, W.A. 2000. “<strong>Diesel</strong> Particulate Matter.”<strong>Diesel</strong>Net Technology Guide. Revision 2000.03a.Online at: www.dieselnet.com/tech/dpm.html.Manufacturers <strong>of</strong> Emission Controls Association (MECA).2003. “Exhaust Emission Controls Available to ReduceEmissions from Nonroad <strong>Diesel</strong> Engines.” Washington,D.C. April.Manufacturers <strong>of</strong> Emissions Control Association (MECA).2000. “Emission Control Retr<strong>of</strong>it <strong>of</strong> <strong>Diesel</strong>-FueledVehicles.” March.Mark, J. and C. Morey. 2000. Rolling Smokestacks.<strong>Union</strong> <strong>of</strong> <strong>Concerned</strong> <strong>Scientists</strong>. Cambridge, Mass.:<strong>Union</strong> <strong>of</strong> <strong>Concerned</strong> <strong>Scientists</strong>.McConnell, R., K. Berhane, F. Gilliland, S.J. London,T. Islam, W.J. Gauderman, E. Avol, H.G. Margolis,J.M. Peters. 2002. “Asthma in exercizing childrenexposed to ozone: a cohort study.” The Lancet. 359:386-391. February 2.Miller, W.R. 2000. “The Development <strong>of</strong> Urea-SCRTechnology for US Heavy Duty Trucks—Demonstration<strong>Up</strong>date.” Presented at the <strong>Diesel</strong> Engine EmissionReduction Conference.Natural Resources Defense Council (NRDC). 2003.“News Release. City <strong>of</strong> Los Angeles and Communityand Environmental Groups Reach Record Settlement <strong>of</strong>Challenge to China Shipping Terminal Project at Port.”Los Angeles, Calif. March.Ostro, B.D., M.J. Lipsett, J.K. Mann, H. Braxton-Owens,M.C. White. 1995. “Air pollution and asthma exacerbationsamong African American children in Los Angeles.”Inhalation Toxicology. 7:711-722.Oueliette, P. 2000. “High Pressure Direct Injection <strong>of</strong>Natural Gas in <strong>Diesel</strong> Engines.” Westport Innovations,Inc. Natural Gas Vehicle Conference. Yokohama, Japan.October 17-19.Pekkanen, J., K.L. Timonen, J. Ruuskanen, A. Reponen,A. Mirme. 1997. “Effects <strong>of</strong> ultrafine and fineparticles in urban air on peak expiratory flow amongchildren with asthmatic symptoms.” EnvironmentalResearch. 74(1):24-33.Peters, J.M., E. Avol, W.J. Gauderman, W.S. Linn,W. Navidi, S.J. London, H.G. Margolis, W. Rappaport,H. Vora, H. Gong, D.C. Thomas. 1999. “A study <strong>of</strong>twelve southern California communities with differinglevels and types <strong>of</strong> air pollution. II. Effects on pulmonaryfunction.” Am J Respir, Crit Care Med. 159:768-775.Petit, J.R., J. Jouzel, D. Raynaud, N.I. Barkov,J.M. Barnola, I. Basile, M. Bender, J. Chappelaz,M. Davis, G. Delaygue, M. Delmotte, V.M. Kotlyakov,M. Legrand, V.Y. Lipenkov, C. Lorius, L. Pepin, C. Ritz,E. Saltzman, M. Stievenard. 1999. “Climate andatmospheric history <strong>of</strong> the past 420,000 years fromthe Vostok ice core, Antarctica.” Nature. 399:429-436.Pierpont, D.A. 1995. “Reducing Particulate and NOxEmissions using Multiple Injections and EGR in a D.I.<strong>Diesel</strong> Engine.” SAE 950217.Pope, C.A., III, M.J. Thun, M.M. Namboodiri,D.W. Dockery, J.S. Evans, F.E. Speizer, C.W. Heath.1995. “Particulate air pollution as a predictor <strong>of</strong> mortalityin a prospective study <strong>of</strong> U.S. adults.” AmericanJournal <strong>of</strong> Respiratory & Critical Care Medicine.151:669-674.Pope, C.A., III. 1991. “Respiratory hospital admissionsassociated with PM10 pollution in Utah, Salt Lake, andCache Valleys.” Archives <strong>of</strong> Environmental Health. 46:90-97.Southwest Research Institute (SRI). 2003. “EfficiencyConvergence Of Spark And Compression IgnitionEngines.” San Antonio, Tex.Starr, M. 2001. “Nonroad Aftertreatment EmissionsStudy for Two Small <strong>Diesel</strong> Engines.” Southwest ResearchInstitute. Report to EPA under Contract 68-C098-169,WA 2-17. September.State and Territorial Air <strong>Pollution</strong> Program Administrators(STAPPA) and the Association <strong>of</strong> Local Air <strong>Pollution</strong>Control Officials (ALAPCO). 2000. “Cancer Risk from<strong>Diesel</strong> Particulate: National and Metropolitan Area Estimatesfor the United States.” March 15. Online at:www.4cleanair.org/comments/Cancerriskreport.PDF.Turner, S.H., C. Weaver, M. Balam, R. Gable. 2000.“Comparison <strong>of</strong> In-Use Emissions from <strong>Diesel</strong> andNatural Gas Trucks and Buses.” Society <strong>of</strong> AutomotiveEngineers. SAE 2000-01-3473.
<strong>Cleaning</strong> <strong>Up</strong> <strong>Diesel</strong> <strong>Pollution</strong> l 37<strong>Union</strong> <strong>of</strong> <strong>Concerned</strong> <strong>Scientists</strong> (UCS) and the EcologicalSociety <strong>of</strong> America. 2003. Confronting Climate Changein the Great Lakes Region: Impacts on our Communitiesand Ecosystems. Cambridge, Mass.: UCS.<strong>Union</strong> <strong>of</strong> <strong>Concerned</strong> <strong>Scientists</strong> (UCS) and the EcologicalSociety <strong>of</strong> America. 2001. Confronting Climate Changein the Gulf Coast Region. Cambridge, Mass.: UCS.<strong>Union</strong> <strong>of</strong> <strong>Concerned</strong> <strong>Scientists</strong> (UCS) and the EcologicalSociety <strong>of</strong> America. 1999. Confronting Climate Changein California: Ecological Impacts on the Golden State.Cambridge, Mass.: UCS.West Virginia University Transportable Heavy-DutyVehicle Emissions Testing Laboratory. 1997. “ExhaustEmissions Test Results Report <strong>of</strong> Raley’s DistributionCenter Tractors; in Gas Research Institute (GRI).” 1999.Final Report: The Cleaner Choice: Natural Gas as aSubstitute for <strong>Diesel</strong>. Batavia, Ill.: GRI. GRI-99/0261.White, M.C., R.A. Etzel, W.D. Wilcox, C. Lloyd. 1994.“Exacerbations <strong>of</strong> Childhood Asthma and Ozone<strong>Pollution</strong> in Atlanta.” Environmental Research. 65:56-68.Wiley, J., J. Robinson, T. Piazza, L. Stork, K. Pladsen.1993. Final Report—Study <strong>of</strong> Children’s Activity Patterns.In Gauderman, W.J., R. McConnell, F. Gilliland,S.J. London, D.C. Thomas, E. Avol, H. Vora,K. Berhane, E.B. Rappaport, F. Lurmann, H.G. Margolis,J.M. Peters. 2000. “Association Between Air <strong>Pollution</strong>and Lung Function Growth in Southern CaliforniaChildren.” Am Journal <strong>of</strong> Respiratory & Critical CareMedicine. 162:1384-1390.
38 l<strong>Union</strong> <strong>of</strong> <strong>Concerned</strong> <strong>Scientists</strong>Appendix ACALCULATING EMISSIONSNEW TRANSIT BUSEQUIVALENT EMISSIONSTo calculate new transit bus equivalentemissions, we assume a model year 2004diesel-powered urban transit bus will release10.34 grams per mile <strong>of</strong> nitrogen oxides and0.44 grams per mile <strong>of</strong> particulate matter. Theseemissions estimates are from Mark and Morey,2000. We also assume transit buses will average30,861 miles per year, based on the Department<strong>of</strong> Energy’s Transportation Energy Data Book(DOE, 2002).1999 EMISSION INVENTORYTo develop county-level emissions data formobile sources, we relied on the EPA’s finalemission inventory, available online at:ftp://ftp.epa.gov/EmisInventory/finalnei99ver2.However, we could not reconcile the EPA’s datafor <strong>of</strong>f-highway emissions in California with datapublished by the California Air Resources Board(CARB). Since the EPA considers CARB’s datato be the most accurate, that is what we used.However, CARB provides information on reactiveorganic gases rather than volatile organiccompounds, and does not provide informationon PM 2.5emissions, which we assume makeup 99 percent <strong>of</strong> PM 10emissions.CASE STUDIESTo develop our emissions and cost estimatesfor the four types <strong>of</strong> equipment evaluated in ourcase studies, we relied on technical informationprovided by M.J. Bradley and Associates. Wealso used technical support documents associatedwith the EPA’s NONROAD model, located at:www.epa.gov/otaq/nonrdmdl.htm.To calculate the emission factor for each type<strong>of</strong> equipment, we applied the following formula:EF (adjusted) = EF (steady state) * TAF * DFWhereEF (adjusted) = Final emission factor, adjusted fortransient operation and deterioration, g/hp-hrEF (steady state) = Steady-state emission factor, g/hp-hrTAF= Transient adjustment factor, unitlessDF = Deterioration factor, unitless= 1 + A * (cumulative hours * load factor)/median lifeat full load, in hoursA = Relative deterioration factor, unitless
<strong>Cleaning</strong> <strong>Up</strong> <strong>Diesel</strong> <strong>Pollution</strong> l 39Appendix BSTATE FACT SHEETS: AIR POLLUTION FROM MOBILE SOURCESDefinitionsPM10PM2.5NOxSO 2VOCROGCOLNGCNGParticulate matter less than or equal to 10 microns in diameterParticulate matter less than or equal to 2.5 microns in diameterNitrogen oxidesSulfur dioxideVolatile organic compounds (for all states except California)Reactive organic compounds (for California only)Carbon monoxideLiquefied natural gasCompressed natural gasSOURCE: All mobile source emission data except California’s <strong>of</strong>f-highway pollution are based on the final 1999 emission inventory compiled by the U.S. EPA. The dataare located online at: ftp://ftp.epa.gov/EmisInventory/finalnei99ver2/criteria. California’s <strong>of</strong>f-highway emissions were provided by the California Air Resources Board.U.S. TOTAL1999 Emissions in Tons per YearPM10 PM2.5 NOx SO2 VOC COMobile Sources - TOTAL 571,878 489,125 12,617,563 741,785 8,066,635 90,357,081Highway Vehicles 241,671 184,820 8,368,821 300,912 5,581,249 68,317,145Off-Highway Equipment and Vehicles 330,206 304,305 4,248,742 440,873 2,485,386 22,039,935Heavy Equipment (<strong>Diesel</strong>) 187,634 173,627 1,726,304 219,815 223,992 1,012,094Heavy Equipment (Gasoline) 67,294 62,164 178,163 9,403 2,141,901 19,464,538Heavy Equipment (LNG & CNG) 1,164 1,164 254,268 246 3,191 986,834Marine Vessels (<strong>Diesel</strong>) 44,335 40,836 904,313 174,705 30,201 120,560Railroads (<strong>Diesel</strong>) 23,317 21,265 1,078,939 28,444 41,569 111,593Aircraft 6,463 5,250 106,755 8,259 44,533 344,316Off-Highway <strong>Diesel</strong> 255,286 235,728 3,709,556 422,965 295,761 1,244,247Off-Highway (Other Fuels) 74,921 68,577 539,185 17,909 2,189,625 20,795,688Off-Highway Share <strong>of</strong> Mobile Source <strong>Pollution</strong> 58% 62% 34% 59% 31% 24%Off-Highway <strong>Diesel</strong> Share <strong>of</strong> Mobile Source <strong>Pollution</strong> 45% 48% 29% 57% 4% 1%Off-Highway Heavy <strong>Diesel</strong> Equipment Share <strong>of</strong> Mobile Source <strong>Pollution</strong> 33% 36% 14% 30% 3% 1%Heavy Equipment (<strong>Diesel</strong>) 187,634 173,627 1,726,304 219,815 223,992 1,012,094Agriculture 76,774 70,884 577,012 65,875 78,227 353,724Airport Ground Support 770 716 10,582 1,015 1,569 9,431Commercial 9,655 8,938 72,490 10,061 13,568 49,592Construction 77,143 71,510 832,888 109,528 100,093 479,928Industrial 14,581 13,538 139,425 20,571 18,252 72,642Lawn and Garden 4,657 4,296 38,501 5,405 6,980 23,084Logging 2,083 1,934 26,860 3,651 2,360 12,253Recreational 379 346 1,661 218 580 2,339Underground Mining 513 472 3,402 354 747 2,855Pleasure Craft 607 560 20,646 2,796 1,024 3,673Railroad Equipment 472 434 2,838 342 591 2,573
40 l<strong>Union</strong> <strong>of</strong> <strong>Concerned</strong> <strong>Scientists</strong>ALABAMA1999 Emissions in Tons per YearPM10 PM2.5 NOx SO2 VOC COMobile Sources - TOTAL 9,613 8,071 344,927 12,528 170,558 1,780,821Highway Vehicles 4,718 3,600 163,482 6,297 121,546 1,415,935Off-Highway Equipment and Vehicles 4,895 4,470 181,445 6,230 49,012 364,886Heavy Equipment (<strong>Diesel</strong>) 2,252 2,071 20,878 2,790 2,630 12,153Heavy Equipment (Gasoline) 1,287 1,184 2,631 152 39,048 306,535Heavy Equipment (LNG & CNG) 24 24 5,332 5 12 21,069Marine Vessels (<strong>Diesel</strong>) 743 684 7,449 2,688 596 970Railroads (<strong>Diesel</strong>) 480 432 144,766 558 6,398 18,497Aircraft 109 75 389 38 326 5,661Off-Highway <strong>Diesel</strong> 3,475 3,187 173,093 6,036 9,625 31,621Off-Highway (Other Fuels) 1,420 1,283 8,352 195 39,387 333,265Off-Highway Share <strong>of</strong> Mobile Source <strong>Pollution</strong> 51% 55% 53% 50% 29% 21%Off-Highway <strong>Diesel</strong> Share <strong>of</strong> Mobile Source <strong>Pollution</strong> 36% 40% 50% 48% 6% 2%Off-Highway Heavy <strong>Diesel</strong> Equipment Share <strong>of</strong> Mobile Source <strong>Pollution</strong> 23% 26% 6% 22% 2% 1%Heavy Equipment (<strong>Diesel</strong>) 2,252 2,071 20,878 2,790 2,630 12,153Agriculture 535 492 3,809 431 521 2,398Airport Ground Support 2 2 23 3 2 12Commercial 143 132 1,001 142 195 712Construction 1,022 940 10,271 1,390 1,246 6,160Industrial 254 234 2,372 360 303 1,230Lawn and Garden 58 54 468 70 87 281Logging 167 154 2,069 283 178 970Recreational 4 4 19 3 7 27Underground Mining 42 38 276 29 61 231Pleasure Craft 15 14 517 73 21 85Railroad Equipment 9 8 52 6 11 47ALASKA1999 Emissions in Tons per YearPM10 PM2.5 NOx SO2 VOC COMobile Sources - TOTAL 2,116 1,861 42,184 4,232 26,284 236,556Highway Vehicles 441 342 16,277 565 10,854 170,330Off-Highway Equipment and Vehicles 1,674 1,519 25,907 3,668 15,430 66,226Heavy Equipment (<strong>Diesel</strong>) 369 339 3,689 499 449 2,161Heavy Equipment (Gasoline) 349 321 403 44 13,830 54,822Heavy Equipment (LNG & CNG) 1 1 198 0 1 766Marine Vessels (<strong>Diesel</strong>) 863 794 20,348 3,010 636 2,682Railroads (<strong>Diesel</strong>) - - - - - -Aircraft 93 64 1,269 115 514 5,795Off-Highway <strong>Diesel</strong> 1,231 1,133 24,037 3,509 1,085 4,843Off-Highway (Other Fuels) 443 386 1,870 159 14,344 61,383Off-Highway Share <strong>of</strong> Mobile Source <strong>Pollution</strong> 79% 82% 61% 87% 59% 28%Off-Highway <strong>Diesel</strong> Share <strong>of</strong> Mobile Source <strong>Pollution</strong> 58% 61% 57% 83% 4% 2%Off-Highway Heavy <strong>Diesel</strong> Equipment Share <strong>of</strong> Mobile Source <strong>Pollution</strong> 17% 18% 9% 12% 2% 1%Heavy Equipment (<strong>Diesel</strong>) 369 339 3,689 499 449 2,161Agriculture 6 5 41 5 6 26Airport Ground Support 8 7 85 11 8 43Commercial 19 17 132 19 26 94Construction 284 261 2,851 382 346 1,710Industrial 17 16 150 23 22 81Lawn and Garden 1 1 7 1 1 4Logging 26 24 320 44 27 150Recreational 6 5 26 3 9 36Underground MiningPleasure Craft 2 2 71 10 3 12Railroad Equipment 1 1 7 1 1 6
<strong>Cleaning</strong> <strong>Up</strong> <strong>Diesel</strong> <strong>Pollution</strong> l 41ARIZONA1999 Emissions in Tons per YearPM10 PM2.5 NOx SO2 VOC COMobile Sources - TOTAL 8,683 7,294 206,193 9,954 135,691 1,479,089Highway Vehicles 4,244 3,251 145,022 5,612 90,977 1,001,371Off-Highway Equipment and Vehicles 4,438 4,043 61,171 4,342 44,715 477,717Heavy Equipment (<strong>Diesel</strong>) 2,372 2,182 22,255 3,035 2,902 13,299Heavy Equipment (Gasoline) 1,189 1,094 3,247 192 39,723 440,973Heavy Equipment (LNG & CNG) 14 14 3,073 3 8 12,063Marine Vessels (<strong>Diesel</strong>) - - - - - -Railroads (<strong>Diesel</strong>) 749 674 30,144 878 1,163 2,983Aircraft 115 79 2,452 234 919 8,400Off-Highway <strong>Diesel</strong> 3,121 2,856 52,399 3,913 4,065 16,281Off-Highway (Other Fuels) 1,318 1,187 8,772 429 40,650 461,436Off-Highway Share <strong>of</strong> Mobile Source <strong>Pollution</strong> 51% 55% 30% 44% 33% 32%Off-Highway <strong>Diesel</strong> Share <strong>of</strong> Mobile Source <strong>Pollution</strong> 36% 39% 25% 39% 3% 1%Off-Highway Heavy <strong>Diesel</strong> Equipment Share <strong>of</strong> Mobile Source <strong>Pollution</strong> 27% 30% 11% 31% 2% 1%Heavy Equipment (<strong>Diesel</strong>) 2,372 2,182 22,255 3,035 2,902 13,299Agriculture 232 213 1,650 187 226 1,039Airport Ground Support 32 29 350 46 33 175Commercial 149 137 1,039 148 202 739Construction 1,565 1,440 15,707 2,127 1,908 9,422Industrial 178 163 1,585 245 217 844Lawn and Garden 179 165 1,436 216 266 858Logging 10 9 122 17 10 57Recreational 12 11 51 7 18 71Underground MiningPleasure Craft 8 7 261 37 11 43Railroad Equipment 9 9 55 7 12 50ARKANSAS1999 Emissions in Tons per YearPM10 PM2.5 NOx SO2 VOC COMobile Sources - TOTAL 7,908 6,837 168,731 9,891 92,451 1,007,424Highway Vehicles 3,012 2,353 101,325 3,745 64,895 800,279Off-Highway Equipment and Vehicles 4,897 4,484 67,405 6,146 27,556 207,145Heavy Equipment (<strong>Diesel</strong>) 3,005 2,765 24,622 3,069 3,215 14,931Heavy Equipment (Gasoline) 670 616 1,498 85 22,835 172,316Heavy Equipment (LNG & CNG) 15 15 3,413 3 8 13,499Marine Vessels (<strong>Diesel</strong>) 512 472 11,431 2,202 357 1,502Railroads (<strong>Diesel</strong>) 652 587 26,239 767 1,004 2,594Aircraft 43 29 203 20 137 2,302Off-Highway <strong>Diesel</strong> 4,169 3,823 62,292 6,038 4,576 19,027Off-Highway (Other Fuels) 727 660 5,114 108 22,980 188,118Off-Highway Share <strong>of</strong> Mobile Source <strong>Pollution</strong> 62% 66% 40% 62% 30% 21%Off-Highway <strong>Diesel</strong> Share <strong>of</strong> Mobile Source <strong>Pollution</strong> 53% 56% 37% 61% 5% 2%Off-Highway Heavy <strong>Diesel</strong> Equipment Share <strong>of</strong> Mobile Source <strong>Pollution</strong> 38% 40% 15% 31% 4% 2%Heavy Equipment (<strong>Diesel</strong>) 3,005 2,765 24,622 3,069 3,215 14,931Agriculture 1,856 1,708 13,208 1,494 1,806 8,314Airport Ground Support 3 3 34 5 3 17Commercial 85 79 598 85 116 426Construction 828 762 8,328 1,127 1,010 4,995Industrial 158 145 1,489 225 188 768Lawn and Garden 18 16 145 21 26 85Logging 40 37 491 67 42 230Recreational 3 3 15 2 5 21Underground MiningPleasure Craft 8 8 282 40 12 47Railroad Equipment 5 5 32 4 7 29
42 l<strong>Union</strong> <strong>of</strong> <strong>Concerned</strong> <strong>Scientists</strong>CALIFORNIA1999 Emissions in Tons per YearPM10 PM2.5 NOx SO2 ROG COMobile Sources - TOTAL 46,394 39,662 1,070,842 63,880 650,214 6,615,291Highway Vehicles 20,524 14,293 703,556 11,305 521,940 5,701,038Off-Highway Equipment and Vehicles 25,869 25,369 367,287 52,574 128,274 914,253Heavy Equipment (<strong>Diesel</strong>) 14,426 14,282 218,929 26,861 25,982 101,107Heavy Equipment (Gasoline) 3,804 3,766 20,954 384 80,831 680,726Heavy Equipment (LNG & CNG) 66 65 12,184 6 2,549 28,625Marine Vessels (<strong>Diesel</strong>) 3,238 3,026 39,457 21,827 2,824 6,406Railroads (<strong>Diesel</strong>) 1,172 1,091 54,787 2,548 2,243 8,592Aircraft 3,165 3,139 20,977 949 13,845 88,797Off-Highway <strong>Diesel</strong> 18,835 18,399 313,172 51,236 31,049 116,105Off-Highway (Other Fuels) 7,034 6,970 54,115 1,339 97,225 798,148Off-Highway Share <strong>of</strong> Mobile Source <strong>Pollution</strong> 56% 64% 34% 82% 20% 14%Off-Highway <strong>Diesel</strong> Share <strong>of</strong> Mobile Source <strong>Pollution</strong> 41% 46% 29% 80% 5% 2%Off-Highway Heavy <strong>Diesel</strong> Equipment Share <strong>of</strong> Mobile Source <strong>Pollution</strong> 31% 36% 20% 42% 4% 2%Heavy Equipment (<strong>Diesel</strong>) 14,426 14,282 218,929 26,861 25,982 101,107Agriculture 3,609 3,573 56,235 7,037 7,028 25,912Airport Ground Support 110 109 1,483 47 127 681Commercial 746 738 10,151 1,210 1,436 5,232Construction 7,721 7,644 122,109 15,614 13,258 53,542Industrial 1,777 1,759 21,250 2,357 3,160 12,043Lawn and Garden 180 178 2,485 35 339 1,619Logging 258 256 4,267 556 422 1,660RecreationalUnderground MiningPleasure Craft (includes Recreational) 25 25 949 5 213 419Railroad EquipmentCOLORADO1999 Emissions in Tons per YearPM10 PM2.5 NOx SO2 VOC COMobile Sources - TOTAL 7,522 6,886 178,437 9,409 121,652 1,570,526Highway Vehicles 2,927 2,682 124,557 4,807 85,303 1,188,935Off-Highway Equipment and Vehicles 4,594 4,204 53,880 4,602 36,350 381,592Heavy Equipment (<strong>Diesel</strong>) 3,303 3,038 28,961 3,746 3,790 17,518Heavy Equipment (Gasoline) 800 736 2,896 151 31,135 344,493Heavy Equipment (LNG & CNG) 14 14 3,095 3 10 12,165Marine Vessels (<strong>Diesel</strong>) - - - - - -Railroads (<strong>Diesel</strong>) 414 372 16,636 483 646 1,648Aircraft 63 44 2,292 218 768 5,768Off-Highway <strong>Diesel</strong> 3,717 3,411 45,597 4,229 4,436 19,165Off-Highway (Other Fuels) 878 794 8,283 373 31,914 362,427Off-Highway Share <strong>of</strong> Mobile Source <strong>Pollution</strong> 61% 61% 30% 49% 30% 24%Off-Highway <strong>Diesel</strong> Share <strong>of</strong> Mobile Source <strong>Pollution</strong> 49% 50% 26% 45% 4% 1%Off-Highway Heavy <strong>Diesel</strong> Equipment Share <strong>of</strong> Mobile Source <strong>Pollution</strong> 44% 44% 16% 40% 3% 1%Heavy Equipment (<strong>Diesel</strong>) 3,303 3,038 28,961 3,746 3,790 17,518Agriculture 1,189 1,094 8,466 956 1,157 5,329Airport Ground Support 20 18 219 29 21 109Commercial 165 152 1,154 164 225 821Construction 1,599 1,471 16,073 2,155 1,952 9,642Industrial 197 182 1,946 282 242 956Lawn and Garden 107 99 862 128 159 514Logging 2 2 26 4 2 12Recreational 12 11 51 7 18 72Underground MiningPleasure Craft 3 3 116 16 5 19Railroad Equipment 8 7 48 6 10 44
<strong>Cleaning</strong> <strong>Up</strong> <strong>Diesel</strong> <strong>Pollution</strong> l 43CONNECTICUT1999 Emissions in Tons per YearPM10 PM2.5 NOx SO2 VOC COMobile Sources - TOTAL 4,963 4,147 111,700 5,943 82,877 1,019,070Highway Vehicles 2,565 1,945 88,629 3,496 54,017 729,230Off-Highway Equipment and Vehicles 2,398 2,202 23,071 2,447 28,860 289,840Heavy Equipment (<strong>Diesel</strong>) 1,279 1,177 12,248 1,692 1,585 7,195Heavy Equipment (Gasoline) 909 836 2,431 124 26,987 264,687Heavy Equipment (LNG & CNG) 19 19 4,020 4 9 15,860Marine Vessels (<strong>Diesel</strong>) 169 155 3,975 587 124 524Railroads (<strong>Diesel</strong>) - - - - - -Aircraft 23 16 397 38 154 1,574Off-Highway <strong>Diesel</strong> 1,448 1,332 16,223 2,280 1,710 7,719Off-Highway (Other Fuels) 950 870 6,848 167 27,150 282,121Off-Highway Share <strong>of</strong> Mobile Source <strong>Pollution</strong> 48% 53% 21% 41% 35% 28%Off-Highway <strong>Diesel</strong> Share <strong>of</strong> Mobile Source <strong>Pollution</strong> 29% 32% 15% 38% 2% 1%Off-Highway Heavy <strong>Diesel</strong> Equipment Share <strong>of</strong> Mobile Source <strong>Pollution</strong> 26% 28% 11% 29% 2% 1%Heavy Equipment (<strong>Diesel</strong>) 1,279 1,177 12,248 1,692 1,585 7,195Agriculture 36 34 260 29 36 164Airport Ground Support 3 3 33 4 3 16Commercial 121 111 844 120 164 601Construction 833 766 8,363 1,127 1,016 5,017Industrial 189 174 1,753 268 225 914Lawn and Garden 78 72 631 94 116 375Logging 1 1 10 1 1 5Recreational 3 3 14 2 5 19Underground MiningPleasure Craft 9 8 301 42 12 50Railroad Equipment 7 6 39 5 8 36DELAWARE1999 Emissions in Tons per YearPM10 PM2.5 NOx SO2 VOC COMobile Sources - TOTAL 1,920 1,641 38,701 2,667 26,205 271,130Highway Vehicles 794 611 26,577 1,037 16,041 192,931Off-Highway Equipment and Vehicles 1,126 1,030 12,124 1,630 10,164 78,199Heavy Equipment (<strong>Diesel</strong>) 463 426 4,259 566 542 2,501Heavy Equipment (Gasoline) 365 336 680 38 9,364 70,111Heavy Equipment (LNG & CNG) 4 4 900 1 2 3,552Marine Vessels (<strong>Diesel</strong>) 262 241 6,029 1,017 189 794Railroads (<strong>Diesel</strong>) 6 6 247 7 10 25Aircraft 26 18 10 1 57 1,218Off-Highway <strong>Diesel</strong> 731 673 10,535 1,590 740 3,319Off-Highway (Other Fuels) 395 358 1,590 40 9,423 74,880Off-Highway Share <strong>of</strong> Mobile Source <strong>Pollution</strong> 59% 63% 31% 61% 39% 29%Off-Highway <strong>Diesel</strong> Share <strong>of</strong> Mobile Source <strong>Pollution</strong> 38% 41% 27% 60% 3% 1%Off-Highway Heavy <strong>Diesel</strong> Equipment Share <strong>of</strong> Mobile Source <strong>Pollution</strong> 24% 26% 11% 21% 2% 1%Heavy Equipment (<strong>Diesel</strong>) 463 426 4,259 566 542 2,501Agriculture 120 110 852 96 116 536Airport Ground Support 1 1 7 1 1 3Commercial 23 21 159 23 31 113Construction 251 231 2,522 340 306 1,513Industrial 43 39 395 60 51 206Lawn and Garden 18 17 149 22 26 87Logging 1 1 7 1 1 3Recreational 1 1 4 1 1 6Underground MiningPleasure Craft 5 4 156 22 6 26Railroad Equipment 2 1 9 1 2 8
44 l<strong>Union</strong> <strong>of</strong> <strong>Concerned</strong> <strong>Scientists</strong>DISTRICT OF COLUMBIA1999 Emissions in Tons per YearPM10 PM2.5 NOx SO2 VOC COMobile Sources - TOTAL 506 418 12,062 671 8,869 98,819Highway Vehicles 260 193 9,529 380 7,521 83,615Off-Highway Equipment and Vehicles 245 226 2,533 291 1,347 15,204Heavy Equipment (<strong>Diesel</strong>) 207 191 2,036 278 255 1,219Heavy Equipment (Gasoline) 32 29 103 6 1,083 13,277Heavy Equipment (LNG & CNG) 1 1 175 0 0 686Marine Vessels (<strong>Diesel</strong>) 0 0 4 1 0 1Railroads (<strong>Diesel</strong>) 5 5 214 6 9 21Aircraft - - - - - -Off-Highway <strong>Diesel</strong> 213 196 2,254 285 264 1,241Off-Highway (Other Fuels) 33 30 278 6 1,084 13,963Off-Highway Share <strong>of</strong> Mobile Source <strong>Pollution</strong> 49% 54% 21% 43% 15% 15%Off-Highway <strong>Diesel</strong> Share <strong>of</strong> Mobile Source <strong>Pollution</strong> 42% 47% 19% 43% 3% 1%Off-Highway Heavy <strong>Diesel</strong> Equipment Share <strong>of</strong> Mobile Source <strong>Pollution</strong> 41% 46% 17% 41% 3% 1%Heavy Equipment (<strong>Diesel</strong>) 207 191 2,036 278 255 1,219AgricultureAirport Ground Support 1 1 14 2 1 7Commercial 9 8 60 9 12 43Construction 181 166 1,815 245 221 1,089Industrial 16 14 133 21 20 73Lawn and GardenLoggingRecreational 0 0 0 0 0 1Underground MiningPleasure Craft 0 0 9 1 0 2Railroad Equipment 1 1 5 1 1 5FLORIDA1999 Emissions in Tons per YearPM10 PM2.5 NOx SO2 VOC COMobile Sources - TOTAL 28,086 23,812 572,858 33,129 523,950 5,062,191Highway Vehicles 12,286 9,335 426,164 16,628 329,310 3,388,594Off-Highway Equipment and Vehicles 15,800 14,477 146,694 16,501 194,640 1,673,598Heavy Equipment (<strong>Diesel</strong>) 7,012 6,451 66,579 9,108 8,643 39,225Heavy Equipment (Gasoline) 6,545 6,021 12,092 759 181,886 1,577,622Heavy Equipment (LNG & CNG) 36 36 7,972 8 23 30,968Marine Vessels (<strong>Diesel</strong>) 1,581 1,454 37,264 5,528 1,165 4,911Railroads (<strong>Diesel</strong>) 393 353 15,782 455 621 1,565Aircraft 235 162 7,005 643 2,302 19,307Off-Highway <strong>Diesel</strong> 8,985 8,258 119,625 15,092 10,429 45,701Off-Highway (Other Fuels) 6,816 6,219 27,069 1,409 184,211 1,627,897Off-Highway Share <strong>of</strong> Mobile Source <strong>Pollution</strong> 56% 61% 26% 50% 37% 33%Off-Highway <strong>Diesel</strong> Share <strong>of</strong> Mobile Source <strong>Pollution</strong> 32% 35% 21% 46% 2% 1%Off-Highway Heavy <strong>Diesel</strong> Equipment Share <strong>of</strong> Mobile Source <strong>Pollution</strong> 25% 27% 12% 28% 2% 1%Heavy Equipment (<strong>Diesel</strong>) 7,012 6,451 66,579 9,108 8,643 39,225Agriculture 610 562 4,346 491 594 2,736Airport Ground Support 55 51 613 81 58 306Commercial 672 618 4,699 668 915 3,343Construction 4,481 4,123 44,972 6,090 5,462 26,980Industrial 495 455 4,340 676 613 2,336Lawn and Garden 510 469 4,093 614 758 2,444Logging 58 53 718 98 62 337Recreational 27 25 120 16 42 169Underground MiningPleasure Craft 74 68 2,502 352 103 413Railroad Equipment 29 27 176 21 37 160
<strong>Cleaning</strong> <strong>Up</strong> <strong>Diesel</strong> <strong>Pollution</strong> l 45GEORGIA1999 Emissions in Tons per YearPM10 PM2.5 NOx SO2 VOC COMobile Sources - TOTAL 16,211 13,496 404,279 19,604 272,348 3,208,610Highway Vehicles 9,271 7,140 314,439 12,061 208,127 2,532,843Off-Highway Equipment and Vehicles 6,940 6,355 89,840 7,543 64,221 675,767Heavy Equipment (<strong>Diesel</strong>) 4,172 3,838 38,276 5,148 4,946 22,753Heavy Equipment (Gasoline) 1,680 1,545 4,700 262 56,699 607,475Heavy Equipment (LNG & CNG) 38 38 8,475 8 20 33,405Marine Vessels (<strong>Diesel</strong>) 271 249 6,384 945 200 841Railroads (<strong>Diesel</strong>) 699 629 28,111 811 1,106 2,789Aircraft 81 56 3,895 369 1,249 8,504Off-Highway <strong>Diesel</strong> 5,142 4,716 72,771 6,903 6,252 26,383Off-Highway (Other Fuels) 1,799 1,639 17,070 639 57,968 649,383Off-Highway Share <strong>of</strong> Mobile Source <strong>Pollution</strong> 43% 47% 22% 39% 24% 21%Off-Highway <strong>Diesel</strong> Share <strong>of</strong> Mobile Source <strong>Pollution</strong> 32% 35% 18% 35% 2% 1%Off-Highway Heavy <strong>Diesel</strong> Equipment Share <strong>of</strong> Mobile Source <strong>Pollution</strong> 26% 28% 10% 26% 2% 1%Heavy Equipment (<strong>Diesel</strong>) 4,172 3,838 38,276 5,148 4,946 22,753Agriculture 848 780 6,034 682 825 3,798Airport Ground Support 35 32 389 52 36 194Commercial 313 288 2,190 311 426 1,558Construction 2,277 2,095 22,869 3,095 2,776 13,720Industrial 402 370 3,715 568 482 1,943Lawn and Garden 177 163 1,419 213 264 849Logging 85 79 1,057 145 91 496Recreational 5 5 23 3 8 32Underground MiningPleasure Craft 14 13 490 69 20 81Railroad Equipment 15 14 91 11 19 82HAWAII1999 Emissions in Tons per YearPM10 PM2.5 NOx SO2 VOC COMobile Sources - TOTAL 1,852 1,580 40,585 3,097 28,128 295,751Highway Vehicles 714 544 24,417 960 19,340 201,070Off-Highway Equipment and Vehicles 1,138 1,036 16,168 2,137 8,788 94,681Heavy Equipment (<strong>Diesel</strong>) 499 459 4,717 649 614 2,824Heavy Equipment (Gasoline) 227 209 554 35 7,241 84,901Heavy Equipment (LNG & CNG) 1 1 310 0 1 1,175Marine Vessels (<strong>Diesel</strong>) 361 333 8,527 1,260 267 1,124Railroads (<strong>Diesel</strong>) - - - - - -Aircraft 48 33 2,060 192 665 4,658Off-Highway <strong>Diesel</strong> 861 792 13,244 1,909 881 3,948Off-Highway (Other Fuels) 277 244 2,924 228 7,907 90,734Off-Highway Share <strong>of</strong> Mobile Source <strong>Pollution</strong> 61% 66% 40% 69% 31% 32%Off-Highway <strong>Diesel</strong> Share <strong>of</strong> Mobile Source <strong>Pollution</strong> 47% 50% 33% 62% 3% 1%Off-Highway Heavy <strong>Diesel</strong> Equipment Share <strong>of</strong> Mobile Source <strong>Pollution</strong> 27% 29% 12% 21% 2% 1%Heavy Equipment (<strong>Diesel</strong>) 499 459 4,717 649 614 2,824Agriculture 35 32 247 28 34 156Airport Ground Support 12 11 129 17 12 64Commercial 42 39 295 42 58 210Construction 348 321 3,492 476 425 2,096Industrial 30 28 255 40 39 141Lawn and Garden 28 26 221 35 42 133LoggingRecreational 0 0 1 0 0 1Underground MiningPleasure Craft 2 2 64 9 3 11Railroad Equipment 2 2 14 2 3 13
46 l<strong>Union</strong> <strong>of</strong> <strong>Concerned</strong> <strong>Scientists</strong>IDAHO1999 Emissions in Tons per YearPM10 PM2.5 NOx SO2 VOC COMobile Sources - TOTAL 3,786 3,272 74,357 3,733 48,631 524,665Highway Vehicles 1,437 1,123 49,148 1,786 29,047 391,997Off-Highway Equipment and Vehicles 2,349 2,149 25,209 1,947 19,584 132,668Heavy Equipment (<strong>Diesel</strong>) 1,580 1,453 12,681 1,554 1,665 7,698Heavy Equipment (Gasoline) 480 442 958 65 17,411 118,025Heavy Equipment (LNG & CNG) 5 5 1,088 1 3 4,281Marine Vessels (<strong>Diesel</strong>) 1 1 22 4 1 3Railroads (<strong>Diesel</strong>) 254 229 10,233 301 387 1,010Aircraft 29 20 228 22 117 1,652Off-Highway <strong>Diesel</strong> 1,835 1,683 22,936 1,859 2,053 8,711Off-Highway (Other Fuels) 514 466 2,273 88 17,531 123,958Off-Highway Share <strong>of</strong> Mobile Source <strong>Pollution</strong> 62% 66% 34% 52% 40% 25%Off-Highway <strong>Diesel</strong> Share <strong>of</strong> Mobile Source <strong>Pollution</strong> 49% 51% 31% 50% 4% 2%Off-Highway Heavy <strong>Diesel</strong> Equipment Share <strong>of</strong> Mobile Source <strong>Pollution</strong> 42% 44% 17% 42% 3% 2%Heavy Equipment (<strong>Diesel</strong>) 1,580 1,453 12,681 1,554 1,665 7,698Agriculture 1,077 991 7,669 866 1,048 4,827Airport Ground Support 2 2 20 3 2 10Commercial 49 45 341 48 66 243Construction 308 283 3,095 415 376 1,858Industrial 55 51 504 77 67 265Lawn and Garden 20 18 160 23 28 93Logging 59 54 730 100 63 342Recreational 4 4 19 2 7 26Underground MiningPleasure Craft 4 4 131 18 5 22Railroad Equipment 2 2 14 2 3 13ILLINOIS1999 Emissions in Tons per YearPM10 PM2.5 NOx SO2 VOC COMobile Sources - TOTAL 23,851 20,475 507,123 30,207 310,250 3,684,134Highway Vehicles 9,039 6,891 320,189 12,119 214,996 2,686,845Off-Highway Equipment and Vehicles 14,812 13,584 186,934 18,088 95,254 997,289Heavy Equipment (<strong>Diesel</strong>) 9,780 8,997 79,765 10,017 10,663 48,696Heavy Equipment (Gasoline) 2,260 2,079 7,355 393 79,970 872,294Heavy Equipment (LNG & CNG) 65 65 14,183 14 36 55,956Marine Vessels (<strong>Diesel</strong>) 1,391 1,280 31,419 5,737 982 4,132Railroads (<strong>Diesel</strong>) 1,212 1,091 48,768 1,415 1,896 4,830Aircraft 104 72 5,444 511 1,707 11,380Off-Highway <strong>Diesel</strong> 12,384 11,368 159,952 17,169 13,541 57,658Off-Highway (Other Fuels) 2,429 2,215 26,982 919 81,713 939,630Off-Highway Share <strong>of</strong> Mobile Source <strong>Pollution</strong> 62% 66% 37% 60% 31% 27%Off-Highway <strong>Diesel</strong> Share <strong>of</strong> Mobile Source <strong>Pollution</strong> 52% 56% 32% 57% 4% 2%Off-Highway Heavy <strong>Diesel</strong> Equipment Share <strong>of</strong> Mobile Source <strong>Pollution</strong> 41% 44% 16% 33% 3% 1%Heavy Equipment (<strong>Diesel</strong>) 9,780 8,997 79,765 10,017 10,663 48,696Agriculture 5,576 5,130 39,690 4,483 5,427 24,984Airport Ground Support 54 50 598 79 56 299Commercial 487 448 3,404 483 663 2,422Construction 2,718 2,500 27,306 3,661 3,315 16,380Industrial 670 616 6,228 948 801 3,239Lawn and Garden 215 198 1,729 256 318 1,030Logging 0 0 3 0 0 1Recreational 9 8 38 5 13 54Underground Mining 12 11 82 9 18 69Pleasure Craft 16 15 546 76 22 90Railroad Equipment 24 22 142 17 30 129
<strong>Cleaning</strong> <strong>Up</strong> <strong>Diesel</strong> <strong>Pollution</strong> l 47INDIANA1999 Emissions in Tons per YearPM10 PM2.5 NOx SO2 VOC COMobile Sources - TOTAL 15,292 13,057 345,663 19,811 199,269 2,451,125Highway Vehicles 6,813 5,279 235,316 8,702 151,170 1,921,750Off-Highway Equipment and Vehicles 8,478 7,778 110,347 11,109 48,099 529,376Heavy Equipment (<strong>Diesel</strong>) 5,639 5,187 46,775 5,905 6,181 28,484Heavy Equipment (Gasoline) 1,054 969 3,826 197 39,800 455,043Heavy Equipment (LNG & CNG) 42 42 9,256 9 22 36,650Marine Vessels (<strong>Diesel</strong>) 1,059 974 24,196 4,184 756 3,184Railroads (<strong>Diesel</strong>) 633 570 25,451 734 1,003 2,525Aircraft 52 36 842 81 337 3,490Off-Highway <strong>Diesel</strong> 7,331 6,731 96,423 10,822 7,940 34,193Off-Highway (Other Fuels) 1,148 1,047 13,925 287 40,159 495,183Off-Highway Share <strong>of</strong> Mobile Source <strong>Pollution</strong> 55% 60% 32% 56% 24% 22%Off-Highway <strong>Diesel</strong> Share <strong>of</strong> Mobile Source <strong>Pollution</strong> 48% 52% 28% 55% 4% 1%Off-Highway Heavy <strong>Diesel</strong> Equipment Share <strong>of</strong> Mobile Source <strong>Pollution</strong> 37% 40% 14% 30% 3% 1%Heavy Equipment (<strong>Diesel</strong>) 5,639 5,187 46,775 5,905 6,181 28,484Agriculture 3,018 2,776 21,481 2,426 2,937 13,521Airport Ground Support 13 12 149 20 14 74Commercial 206 190 1,443 205 281 1,026Construction 1,848 1,700 18,572 2,490 2,255 11,141Industrial 404 372 3,802 577 478 1,967Lawn and Garden 108 100 875 130 161 520Logging 4 3 43 6 4 20Recreational 7 7 32 4 11 45Underground Mining 12 11 80 8 18 67Pleasure Craft 7 6 230 32 9 38Railroad Equipment 12 11 70 8 15 63IOWA1999 Emissions in Tons per YearPM10 PM2.5 NOx SO2 VOC COMobile Sources - TOTAL 11,755 10,380 193,523 11,814 97,908 1,168,000Highway Vehicles 2,992 2,337 102,974 3,724 62,625 857,152Off-Highway Equipment and Vehicles 8,763 8,043 90,549 8,090 35,283 310,848Heavy Equipment (<strong>Diesel</strong>) 7,166 6,593 54,444 6,464 7,334 33,800Heavy Equipment (Gasoline) 740 680 2,291 123 26,694 257,492Heavy Equipment (LNG & CNG) 16 16 3,702 3 11 14,619Marine Vessels (<strong>Diesel</strong>) 160 147 3,554 693 111 467Railroads (<strong>Diesel</strong>) 651 586 26,219 774 982 2,585Aircraft 31 21 339 33 152 1,885Off-Highway <strong>Diesel</strong> 7,976 7,325 84,218 7,932 8,426 36,852Off-Highway (Other Fuels) 787 718 6,331 159 26,857 273,996Off-Highway Share <strong>of</strong> Mobile Source <strong>Pollution</strong> 75% 78% 47% 69% 36% 27%Off-Highway <strong>Diesel</strong> Share <strong>of</strong> Mobile Source <strong>Pollution</strong> 68% 71% 44% 67% 9% 3%Off-Highway Heavy <strong>Diesel</strong> Equipment Share <strong>of</strong> Mobile Source <strong>Pollution</strong> 61% 64% 28% 55% 8% 3%Heavy Equipment (<strong>Diesel</strong>) 7,166 6,593 54,444 6,464 7,334 33,800Agriculture 5,820 5,355 41,429 4,679 5,665 26,078Airport Ground Support 1 1 16 2 2 8Commercial 132 122 926 131 180 659Construction 988 909 9,936 1,332 1,206 5,960Industrial 163 151 1,520 232 195 792Lawn and Garden 43 40 346 51 65 208Logging 1 1 13 2 1 6Recreational 4 3 15 2 5 21Underground MiningPleasure Craft 6 6 208 29 9 34Railroad Equipment 6 5 35 4 7 32
48 l<strong>Union</strong> <strong>of</strong> <strong>Concerned</strong> <strong>Scientists</strong>KANSAS1999 Emissions in Tons per YearPM10 PM2.5 NOx SO2 VOC COMobile Sources - TOTAL 10,031 8,814 175,924 10,063 83,068 1,034,258Highway Vehicles 2,702 2,094 93,382 3,449 58,759 770,765Off-Highway Equipment and Vehicles 7,328 6,720 82,542 6,614 24,310 263,493Heavy Equipment (<strong>Diesel</strong>) 6,080 5,593 46,645 5,572 6,264 28,881Heavy Equipment (Gasoline) 434 398 1,853 90 16,736 217,949Heavy Equipment (LNG & CNG) 13 13 3,015 3 10 11,909Marine Vessels (<strong>Diesel</strong>) 10 9 215 42 7 28Railroads (<strong>Diesel</strong>) 762 685 30,633 890 1,189 3,034Aircraft 30 21 181 18 103 1,693Off-Highway <strong>Diesel</strong> 6,852 6,287 77,493 6,504 7,460 31,942Off-Highway (Other Fuels) 477 432 5,049 110 16,849 231,551Off-Highway Share <strong>of</strong> Mobile Source <strong>Pollution</strong> 73% 76% 47% 66% 29% 26%Off-Highway <strong>Diesel</strong> Share <strong>of</strong> Mobile Source <strong>Pollution</strong> 68% 71% 44% 65% 9% 3%Off-Highway Heavy <strong>Diesel</strong> Equipment Share <strong>of</strong> Mobile Source <strong>Pollution</strong> 61% 64% 27% 55% 8% 3%Heavy Equipment (<strong>Diesel</strong>) 6,080 5,593 46,645 5,572 6,264 28,881Agriculture 4,786 4,403 34,062 3,850 4,657 21,441Airport Ground Support 1 1 8 1 1 4Commercial 116 107 812 115 158 578Construction 961 883 9,656 1,300 1,171 5,792Industrial 162 149 1,605 233 196 789Lawn and Garden 44 41 357 53 66 214LoggingRecreational 3 3 13 2 5 18Underground MiningPleasure Craft 3 3 100 14 4 17Railroad Equipment 5 5 32 4 7 29KENTUCKY1999 Emissions in Tons per YearPM10 PM2.5 NOx SO2 VOC COMobile Sources - TOTAL 10,545 8,999 252,526 17,193 130,064 1,503,220Highway Vehicles 4,772 3,712 162,610 6,022 97,581 1,228,501Off-Highway Equipment and Vehicles 5,773 5,287 89,916 11,171 32,484 274,719Heavy Equipment (<strong>Diesel</strong>) 2,599 2,392 22,077 2,830 2,940 13,454Heavy Equipment (Gasoline) 816 751 2,071 109 26,915 232,457Heavy Equipment (LNG & CNG) 18 18 4,187 4 10 16,538Marine Vessels (<strong>Diesel</strong>) 1,747 1,607 39,008 7,477 1,218 5,127Railroads (<strong>Diesel</strong>) 524 471 21,050 606 833 2,090Aircraft 68 47 1,524 146 568 5,053Off-Highway <strong>Diesel</strong> 4,870 4,470 82,135 10,912 4,991 20,671Off-Highway (Other Fuels) 903 817 7,781 259 27,493 254,048Off-Highway Share <strong>of</strong> Mobile Source <strong>Pollution</strong> 55% 59% 36% 65% 25% 18%Off-Highway <strong>Diesel</strong> Share <strong>of</strong> Mobile Source <strong>Pollution</strong> 46% 50% 33% 64% 4% 1%Off-Highway Heavy <strong>Diesel</strong> Equipment Share <strong>of</strong> Mobile Source <strong>Pollution</strong> 25% 27% 9% 17% 2% 1%Heavy Equipment (<strong>Diesel</strong>) 2,599 2,392 22,077 2,830 2,940 13,454Agriculture 1,124 1,034 7,998 904 1,093 5,035Airport Ground Support 6 5 64 8 6 32Commercial 120 110 838 119 163 596Construction 973 896 9,784 1,324 1,187 5,869Industrial 207 191 1,914 292 249 1,000Lawn and Garden 34 32 278 41 50 163Logging 10 9 122 17 10 57Recreational 4 3 17 2 6 23Underground Mining 105 96 695 72 153 584Pleasure Craft 9 8 320 45 13 53Railroad Equipment 8 7 48 6 10 43
<strong>Cleaning</strong> <strong>Up</strong> <strong>Diesel</strong> <strong>Pollution</strong> l 49LOUISIANA1999 Emissions in Tons per YearPM10 PM2.5 NOx SO2 VOC COMobile Sources - TOTAL 17,061 15,095 374,139 39,006 146,534 1,453,923Highway Vehicles 4,074 3,164 138,092 5,162 91,796 1,080,056Off-Highway Equipment and Vehicles 12,988 11,931 236,046 33,843 54,738 373,867Heavy Equipment (<strong>Diesel</strong>) 2,937 2,702 27,242 3,534 3,378 15,602Heavy Equipment (Gasoline) 1,535 1,412 2,714 166 44,598 314,578Heavy Equipment (LNG & CNG) 16 16 3,547 3 21 14,096Marine Vessels (<strong>Diesel</strong>) 8,061 7,417 187,775 29,618 5,870 24,734Railroads (<strong>Diesel</strong>) 388 350 13,989 448 552 1,550Aircraft 50 35 779 74 319 3,307Off-Highway <strong>Diesel</strong> 11,387 10,468 229,006 33,600 9,799 41,885Off-Highway (Other Fuels) 1,601 1,462 7,040 244 44,939 331,981Off-Highway Share <strong>of</strong> Mobile Source <strong>Pollution</strong> 76% 79% 63% 87% 37% 26%Off-Highway <strong>Diesel</strong> Share <strong>of</strong> Mobile Source <strong>Pollution</strong> 67% 69% 61% 86% 7% 3%Off-Highway Heavy <strong>Diesel</strong> Equipment Share <strong>of</strong> Mobile Source <strong>Pollution</strong> 17% 18% 7% 9% 2% 1%Heavy Equipment (<strong>Diesel</strong>) 2,937 2,702 27,242 3,534 3,378 15,602Agriculture 970 892 6,900 780 943 4,344Airport Ground Support 5 5 58 8 5 29Commercial 145 133 1,015 144 198 722Construction 1,339 1,232 13,452 1,821 1,632 8,067Industrial 365 336 4,184 552 455 1,820Lawn and Garden 32 30 259 39 47 153Logging 49 45 608 83 52 285Recreational 3 3 13 2 5 18Underground MiningPleasure Craft 21 19 702 99 29 116Railroad Equipment 9 8 52 6 11 48MAINE1999 Emissions in Tons per YearPM10 PM2.5 NOx SO2 VOC COMobile Sources - TOTAL 2,776 2,357 54,896 3,436 53,382 546,917Highway Vehicles 1,104 826 39,778 1,520 27,618 405,381Off-Highway Equipment and Vehicles 1,672 1,531 15,119 1,916 25,763 141,537Heavy Equipment (<strong>Diesel</strong>) 626 576 6,093 820 736 3,459Heavy Equipment (Gasoline) 727 668 1,040 89 24,724 131,198Heavy Equipment (LNG & CNG) 5 5 1,137 1 2 4,471Marine Vessels (<strong>Diesel</strong>) 285 262 6,716 993 210 885Railroads (<strong>Diesel</strong>) - - - - - -Aircraft 29 20 133 13 91 1,524Off-Highway <strong>Diesel</strong> 911 838 12,809 1,813 946 4,344Off-Highway (Other Fuels) 761 693 2,309 103 24,818 137,193Off-Highway Share <strong>of</strong> Mobile Source <strong>Pollution</strong> 60% 65% 28% 56% 48% 26%Off-Highway <strong>Diesel</strong> Share <strong>of</strong> Mobile Source <strong>Pollution</strong> 33% 36% 23% 53% 2% 1%Off-Highway Heavy <strong>Diesel</strong> Equipment Share <strong>of</strong> Mobile Source <strong>Pollution</strong> 23% 24% 11% 24% 1% 1%Heavy Equipment (<strong>Diesel</strong>) 626 576 6,093 820 736 3,459Agriculture 102 94 726 82 99 457Airport Ground Support 1 1 11 1 1 5Commercial 40 37 282 40 55 201Construction 278 256 2,795 375 339 1,676Industrial 59 55 542 83 72 285Lawn and Garden 16 15 130 19 24 77Logging 110 101 1,359 186 117 637Recreational 13 12 55 7 19 78Underground MiningPleasure Craft 5 5 180 25 7 30Railroad Equipment 2 2 14 2 3 13
50 l<strong>Union</strong> <strong>of</strong> <strong>Concerned</strong> <strong>Scientists</strong>MARYLAND1999 Emissions in Tons per YearPM10 PM2.5 NOx SO2 VOC COMobile Sources - TOTAL 8,421 7,055 193,501 10,500 137,387 1,638,697Highway Vehicles 4,355 3,322 150,739 5,831 92,168 1,196,646Off-Highway Equipment and Vehicles 4,067 3,733 42,762 4,669 45,218 442,051Heavy Equipment (<strong>Diesel</strong>) 1,990 1,831 18,217 2,459 2,405 10,847Heavy Equipment (Gasoline) 1,400 1,288 3,512 188 41,867 415,446Heavy Equipment (LNG & CNG) 13 13 2,820 3 7 11,052Marine Vessels (<strong>Diesel</strong>) 504 463 11,860 1,768 371 1,563Railroads (<strong>Diesel</strong>) 132 119 5,291 150 216 527Aircraft 28 19 1,062 101 353 2,616Off-Highway <strong>Diesel</strong> 2,626 2,413 35,367 4,377 2,992 12,937Off-Highway (Other Fuels) 1,441 1,320 7,395 292 42,227 429,114Off-Highway Share <strong>of</strong> Mobile Source <strong>Pollution</strong> 48% 53% 22% 45% 33% 27%Off-Highway <strong>Diesel</strong> Share <strong>of</strong> Mobile Source <strong>Pollution</strong> 31% 34% 18% 42% 2% 1%Off-Highway Heavy <strong>Diesel</strong> Equipment Share <strong>of</strong> Mobile Source <strong>Pollution</strong> 24% 26% 9% 23% 2% 1%Heavy Equipment (<strong>Diesel</strong>) 1,990 1,831 18,217 2,459 2,405 10,847Agriculture 356 327 2,532 286 346 1,594Airport Ground Support 7 7 81 11 8 41Commercial 148 136 1,037 147 202 738Construction 1,113 1,024 11,172 1,506 1,357 6,703Industrial 181 166 1,595 248 223 855Lawn and Garden 154 142 1,240 185 228 738Logging 4 4 53 7 5 25Recreational 4 4 19 3 7 27Underground MiningPleasure Craft 13 11 427 60 18 71Railroad Equipment 10 9 62 7 13 56MASSACHUSETTS1999 Emissions in Tons per YearPM10 PM2.5 NOx SO2 VOC COMobile Sources - TOTAL 10,956 9,341 227,008 13,750 157,161 1,895,468Highway Vehicles 4,371 3,302 159,461 6,013 104,954 1,374,477Off-Highway Equipment and Vehicles 6,585 6,039 67,548 7,737 52,208 520,992Heavy Equipment (<strong>Diesel</strong>) 4,534 4,171 44,503 6,043 5,575 26,476Heavy Equipment (Gasoline) 1,514 1,393 4,040 215 45,637 460,893Heavy Equipment (LNG & CNG) 31 31 6,603 7 16 26,050Marine Vessels (<strong>Diesel</strong>) 358 329 8,441 1,252 264 1,113Railroads (<strong>Diesel</strong>) 58 52 2,316 66 93 230Aircraft 91 63 1,646 154 624 6,230Off-Highway <strong>Diesel</strong> 4,949 4,552 55,260 7,361 5,931 27,819Off-Highway (Other Fuels) 1,636 1,487 12,288 376 46,276 493,173Off-Highway Share <strong>of</strong> Mobile Source <strong>Pollution</strong> 60% 65% 30% 56% 33% 28%Off-Highway <strong>Diesel</strong> Share <strong>of</strong> Mobile Source <strong>Pollution</strong> 45% 49% 24% 54% 4% 2%Off-Highway Heavy <strong>Diesel</strong> Equipment Share <strong>of</strong> Mobile Source <strong>Pollution</strong> 41% 45% 20% 44% 4% 1%Heavy Equipment (<strong>Diesel</strong>) 4,534 4,171 44,503 6,043 5,575 26,476Agriculture 44 40 312 35 43 197Airport Ground Support 16 15 181 24 17 90Commercial 221 204 1,549 220 302 1,102Construction 3,789 3,486 38,058 5,105 4,622 22,830Industrial 318 292 2,928 448 381 1,532Lawn and Garden 110 101 887 131 163 527Logging 0 0 5 1 0 2Recreational 9 8 38 5 13 54Underground MiningPleasure Craft 14 13 473 66 20 78Railroad Equipment 12 11 72 9 15 65
<strong>Cleaning</strong> <strong>Up</strong> <strong>Diesel</strong> <strong>Pollution</strong> l 51MICHIGAN1999 Emissions in Tons per YearPM10 PM2.5 NOx SO2 VOC COMobile Sources - TOTAL 19,628 16,693 424,467 24,151 351,062 3,813,742Highway Vehicles 8,784 6,742 312,462 11,543 213,526 2,852,143Off-Highway Equipment and Vehicles 10,844 9,951 112,005 12,607 137,536 961,599Heavy Equipment (<strong>Diesel</strong>) 4,954 4,557 43,921 5,781 5,700 25,974Heavy Equipment (Gasoline) 3,936 3,621 7,451 507 129,416 869,727Heavy Equipment (LNG & CNG) 60 60 13,133 14 31 51,961Marine Vessels (<strong>Diesel</strong>) 1,557 1,433 36,115 5,823 1,129 4,756Railroads (<strong>Diesel</strong>) 224 202 8,991 254 370 897Aircraft 113 78 2,394 229 890 8,284Off-Highway <strong>Diesel</strong> 6,735 6,192 89,027 11,858 7,199 31,627Off-Highway (Other Fuels) 4,109 3,759 22,978 750 130,337 929,972Off-Highway Share <strong>of</strong> Mobile Source <strong>Pollution</strong> 55% 60% 26% 52% 39% 25%Off-Highway <strong>Diesel</strong> Share <strong>of</strong> Mobile Source <strong>Pollution</strong> 34% 37% 21% 49% 2% 1%Off-Highway Heavy <strong>Diesel</strong> Equipment Share <strong>of</strong> Mobile Source <strong>Pollution</strong> 25% 27% 10% 24% 2% 1%Heavy Equipment (<strong>Diesel</strong>) 4,954 4,557 43,921 5,781 5,700 25,974Agriculture 1,678 1,544 11,948 1,349 1,633 7,521Airport Ground Support 24 22 265 35 25 132Commercial 314 289 2,199 312 428 1,565Construction 2,047 1,883 20,566 2,758 2,498 12,339Industrial 605 556 5,648 859 719 2,933Lawn and Garden 167 154 1,343 199 248 801Logging 48 44 597 82 51 280Recreational 17 15 73 10 26 104Underground MiningPleasure Craft 34 31 1,165 162 48 192Railroad Equipment 20 18 118 14 25 107MINNESOTA1999 Emissions in Tons per YearPM10 PM2.5 NOx SO2 VOC COMobile Sources - TOTAL 16,206 14,161 289,957 18,614 205,436 2,038,359Highway Vehicles 4,937 3,817 172,090 6,350 106,904 1,487,075Off-Highway Equipment and Vehicles 11,268 10,344 117,867 12,264 98,531 551,284Heavy Equipment (<strong>Diesel</strong>) 6,700 6,164 53,261 6,511 7,068 32,560Heavy Equipment (Gasoline) 2,660 2,447 4,658 330 89,077 483,409Heavy Equipment (LNG & CNG) 28 28 6,186 6 16 24,421Marine Vessels (<strong>Diesel</strong>) 1,250 1,150 29,127 4,589 911 3,837Railroads (<strong>Diesel</strong>) 572 514 22,997 671 885 2,275Aircraft 58 40 1,639 157 574 4,783Off-Highway <strong>Diesel</strong> 8,522 7,829 105,385 11,771 8,863 38,671Off-Highway (Other Fuels) 2,746 2,515 12,482 494 89,668 512,612Off-Highway Share <strong>of</strong> Mobile Source <strong>Pollution</strong> 70% 73% 41% 66% 48% 27%Off-Highway <strong>Diesel</strong> Share <strong>of</strong> Mobile Source <strong>Pollution</strong> 53% 55% 36% 63% 4% 2%Off-Highway Heavy <strong>Diesel</strong> Equipment Share <strong>of</strong> Mobile Source <strong>Pollution</strong> 41% 44% 18% 35% 3% 2%Heavy Equipment (<strong>Diesel</strong>) 6,700 6,164 53,261 6,511 7,068 32,560Agriculture 4,641 4,269 33,030 3,731 4,516 20,791Airport Ground Support 26 24 286 38 27 143Commercial 211 194 1,473 209 287 1,048Construction 1,422 1,308 14,291 1,916 1,734 8,572Industrial 278 256 2,585 394 331 1,345Lawn and Garden 59 54 470 70 87 282Logging 19 18 239 33 20 112Recreational 14 13 63 8 22 89Underground MiningPleasure Craft 22 21 769 107 32 127Railroad Equipment 9 9 56 7 12 51
52 l<strong>Union</strong> <strong>of</strong> <strong>Concerned</strong> <strong>Scientists</strong>MISSISSIPPI1999 Emissions in Tons per YearPM10 PM2.5 NOx SO2 VOC COMobile Sources - TOTAL 8,958 7,732 203,281 13,747 103,982 1,032,862Highway Vehicles 3,908 3,103 126,699 4,490 74,786 832,570Off-Highway Equipment and Vehicles 5,049 4,629 76,582 9,258 29,197 200,292Heavy Equipment (<strong>Diesel</strong>) 2,212 2,035 19,079 2,438 2,415 11,282Heavy Equipment (Gasoline) 810 745 1,489 87 24,879 167,584Heavy Equipment (LNG & CNG) 14 14 3,278 3 8 12,971Marine Vessels (<strong>Diesel</strong>) 1,537 1,414 34,925 6,196 1,091 4,595Railroads (<strong>Diesel</strong>) 438 394 17,615 516 673 1,741Aircraft 39 27 197 19 131 2,120Off-Highway <strong>Diesel</strong> 4,186 3,843 71,618 9,149 4,179 17,617Off-Highway (Other Fuels) 863 786 4,964 109 25,017 182,675Off-Highway Share <strong>of</strong> Mobile Source <strong>Pollution</strong> 56% 60% 38% 67% 28% 19%Off-Highway <strong>Diesel</strong> Share <strong>of</strong> Mobile Source <strong>Pollution</strong> 47% 50% 35% 67% 4% 2%Off-Highway Heavy <strong>Diesel</strong> Equipment Share <strong>of</strong> Mobile Source <strong>Pollution</strong> 25% 26% 9% 18% 2% 1%Heavy Equipment (<strong>Diesel</strong>) 2,212 2,035 19,079 2,438 2,415 11,282Agriculture 1,120 1,031 7,974 902 1,090 5,020Airport Ground Support 1 1 9 1 1 5Commercial 76 70 533 76 104 379Construction 696 641 6,999 947 849 4,198Industrial 157 145 1,465 223 188 761Lawn and Garden 16 15 127 19 23 76Logging 127 117 1,569 215 135 736Recreational 3 3 13 2 5 18Underground MiningPleasure Craft 10 10 355 50 15 59Railroad Equipment 6 5 34 4 7 31MISSOURI1999 Emissions in Tons per YearPM10 PM2.5 NOx SO2 VOC COMobile Sources - TOTAL 15,008 12,836 337,338 19,323 192,614 2,150,960Highway Vehicles 6,307 4,864 216,585 8,177 138,576 1,674,267Off-Highway Equipment and Vehicles 8,701 7,973 120,753 11,146 54,039 476,694Heavy Equipment (<strong>Diesel</strong>) 5,026 4,624 40,676 5,058 5,414 24,805Heavy Equipment (Gasoline) 1,436 1,321 3,635 196 45,260 414,490Heavy Equipment (LNG & CNG) 27 27 6,057 6 16 23,886Marine Vessels (<strong>Diesel</strong>) 1,106 1,017 25,239 4,387 789 3,321Railroads (<strong>Diesel</strong>) 1,052 947 42,319 1,228 1,645 4,192Aircraft 54 37 2,827 272 915 5,999Off-Highway <strong>Diesel</strong> 7,184 6,588 108,234 10,673 7,847 32,318Off-Highway (Other Fuels) 1,517 1,385 12,519 473 46,191 444,376Off-Highway Share <strong>of</strong> Mobile Source <strong>Pollution</strong> 58% 62% 36% 58% 28% 22%Off-Highway <strong>Diesel</strong> Share <strong>of</strong> Mobile Source <strong>Pollution</strong> 48% 51% 32% 55% 4% 2%Off-Highway Heavy <strong>Diesel</strong> Equipment Share <strong>of</strong> Mobile Source <strong>Pollution</strong> 34% 36% 12% 26% 3% 1%Heavy Equipment (<strong>Diesel</strong>) 5,026 4,624 40,676 5,058 5,414 24,805Agriculture 3,100 2,852 22,069 2,492 3,017 13,891Airport Ground Support 21 19 232 31 22 116Commercial 223 205 1,561 222 304 1,110Construction 1,277 1,175 12,837 1,720 1,558 7,701Industrial 288 265 2,655 405 345 1,389Lawn and Garden 79 72 634 94 116 376Logging 3 3 41 6 4 19Recreational 9 8 38 5 14 54Underground MiningPleasure Craft 16 15 544 76 22 90Railroad Equipment 11 10 65 8 14 59
<strong>Cleaning</strong> <strong>Up</strong> <strong>Diesel</strong> <strong>Pollution</strong> l 53MONTANA1999 Emissions in Tons per YearPM10 PM2.5 NOx SO2 VOC COMobile Sources - TOTAL 4,376 3,865 81,871 4,258 32,600 378,636Highway Vehicles 1,064 837 36,421 1,293 20,492 291,257Off-Highway Equipment and Vehicles 3,311 3,028 45,450 2,965 12,109 87,379Heavy Equipment (<strong>Diesel</strong>) 2,434 2,239 18,248 2,138 2,459 11,350Heavy Equipment (Gasoline) 209 192 615 35 8,563 70,297Heavy Equipment (LNG & CNG) 2 2 434 0 2 1,694Marine Vessels (<strong>Diesel</strong>) - - - - - -Railroads (<strong>Diesel</strong>) 643 578 25,890 767 964 2,551Aircraft 25 17 263 25 122 1,487Off-Highway <strong>Diesel</strong> 3,076 2,817 44,138 2,905 3,423 13,901Off-Highway (Other Fuels) 235 211 1,312 61 8,686 73,478Off-Highway Share <strong>of</strong> Mobile Source <strong>Pollution</strong> 76% 78% 56% 70% 37% 23%Off-Highway <strong>Diesel</strong> Share <strong>of</strong> Mobile Source <strong>Pollution</strong> 70% 73% 54% 68% 11% 4%Off-Highway Heavy <strong>Diesel</strong> Equipment Share <strong>of</strong> Mobile Source <strong>Pollution</strong> 56% 58% 22% 50% 8% 3%Heavy Equipment (<strong>Diesel</strong>) 2,434 2,239 18,248 2,138 2,459 11,350Agriculture 2,090 1,923 14,881 1,681 2,035 9,367Airport Ground Support 1 1 15 2 1 7Commercial 37 34 258 37 50 184Construction 241 222 2,429 325 294 1,456Industrial 33 30 313 46 41 157Lawn and Garden 3 3 29 4 4 15Logging 18 17 228 31 20 107Recreational 6 6 28 4 10 39Underground MiningPleasure Craft 2 2 58 8 2 9Railroad Equipment 2 2 10 1 2 10NEBRASKA1999 Emissions in Tons per YearPM10 PM2.5 NOx SO2 VOC COMobile Sources - TOTAL 8,198 7,290 151,748 8,089 57,274 702,677Highway Vehicles 1,832 1,429 63,234 2,291 38,448 520,981Off-Highway Equipment and Vehicles 6,366 5,861 88,514 5,798 18,826 181,696Heavy Equipment (<strong>Diesel</strong>) 4,815 4,430 36,021 4,238 4,878 22,452Heavy Equipment (Gasoline) 304 280 1,280 60 11,910 142,657Heavy Equipment (LNG & CNG) 8 8 1,743 2 6 6,873Marine Vessels (<strong>Diesel</strong>) 4 3 79 15 2 10Railroads (<strong>Diesel</strong>) 1,212 1,128 48,833 1,441 1,832 4,815Aircraft 24 12 557 41 199 4,889Off-Highway <strong>Diesel</strong> 6,031 5,562 84,933 5,695 6,712 27,278Off-Highway (Other Fuels) 335 299 3,581 103 12,114 154,418Off-Highway Share <strong>of</strong> Mobile Source <strong>Pollution</strong> 78% 80% 58% 72% 33% 26%Off-Highway <strong>Diesel</strong> Share <strong>of</strong> Mobile Source <strong>Pollution</strong> 74% 76% 56% 70% 12% 4%Off-Highway Heavy <strong>Diesel</strong> Equipment Share <strong>of</strong> Mobile Source <strong>Pollution</strong> 59% 61% 24% 52% 9% 3%Heavy Equipment (<strong>Diesel</strong>) 4,815 4,430 36,021 4,238 4,878 22,452Agriculture 4,112 3,783 29,263 3,308 4,001 18,420Airport Ground Support 2 2 26 3 2 13Commercial 77 71 536 76 104 381Construction 508 467 5,111 688 620 3,066Industrial 82 76 758 116 99 396Lawn and Garden 27 25 217 33 41 132LoggingRecreational 2 2 9 1 3 13Underground MiningPleasure Craft 2 2 83 12 3 14Railroad Equipment 3 3 19 2 4 18
54 l<strong>Union</strong> <strong>of</strong> <strong>Concerned</strong> <strong>Scientists</strong>NEVADA1999 Emissions in Tons per YearPM10 PM2.5 NOx SO2 VOC COMobile Sources - TOTAL 3,773 3,218 82,528 4,583 57,274 619,228Highway Vehicles 1,573 1,204 53,840 2,082 40,267 457,332Off-Highway Equipment and Vehicles 2,201 2,014 28,687 2,502 17,007 161,897Heavy Equipment (<strong>Diesel</strong>) 1,479 1,360 14,255 1,924 1,802 8,549Heavy Equipment (Gasoline) 435 400 1,216 65 14,128 145,958Heavy Equipment (LNG & CNG) 3 3 639 1 2 2,486Marine Vessels (<strong>Diesel</strong>) - - - - - -Railroads (<strong>Diesel</strong>) 258 232 10,390 303 400 1,028Aircraft 26 18 2,188 209 675 3,875Off-Highway <strong>Diesel</strong> 1,737 1,593 24,645 2,227 2,202 9,577Off-Highway (Other Fuels) 464 421 4,042 274 14,804 152,319Off-Highway Share <strong>of</strong> Mobile Source <strong>Pollution</strong> 58% 63% 35% 55% 30% 26%Off-Highway <strong>Diesel</strong> Share <strong>of</strong> Mobile Source <strong>Pollution</strong> 46% 50% 30% 49% 4% 2%Off-Highway Heavy <strong>Diesel</strong> Equipment Share <strong>of</strong> Mobile Source <strong>Pollution</strong> 39% 42% 17% 42% 3% 1%Heavy Equipment (<strong>Diesel</strong>) 1,479 1,360 14,255 1,924 1,802 8,549Agriculture 104 95 738 83 101 464Airport Ground Support 7 7 79 11 7 40Commercial 48 44 338 48 66 240Construction 1,202 1,106 12,069 1,627 1,466 7,241Industrial 49 45 416 65 61 227Lawn and Garden 60 55 483 72 89 288LoggingRecreational 2 2 11 1 4 15Underground MiningPleasure Craft 3 3 104 15 4 17Railroad Equipment 3 3 19 2 4 18NEW HAMPSHIRE1999 Emissions in Tons per YearPM10 PM2.5 NOx SO2 VOC COMobile Sources - TOTAL 2,298 1,942 50,552 2,417 42,636 467,944Highway Vehicles 1,197 932 41,986 1,503 24,579 346,172Off-Highway Equipment and Vehicles 1,101 1,010 8,566 914 18,057 121,772Heavy Equipment (<strong>Diesel</strong>) 468 431 4,513 618 575 2,624Heavy Equipment (Gasoline) 552 507 1,002 67 17,350 112,302Heavy Equipment (LNG & CNG) 7 7 1,443 1 3 5,691Marine Vessels (<strong>Diesel</strong>) 60 55 1,409 208 44 186Railroads (<strong>Diesel</strong>) - - - - - -Aircraft 15 11 198 19 85 970Off-Highway <strong>Diesel</strong> 528 486 5,923 827 619 2,810Off-Highway (Other Fuels) 573 524 2,643 87 17,438 118,962Off-Highway Share <strong>of</strong> Mobile Source <strong>Pollution</strong> 48% 52% 17% 38% 42% 26%Off-Highway <strong>Diesel</strong> Share <strong>of</strong> Mobile Source <strong>Pollution</strong> 23% 25% 12% 34% 2% 1%Off-Highway Heavy <strong>Diesel</strong> Equipment Share <strong>of</strong> Mobile Source <strong>Pollution</strong> 20% 22% 9% 26% 1% 1%Heavy Equipment (<strong>Diesel</strong>) 468 431 4,513 618 575 2,624Agriculture 26 24 183 21 25 115Airport Ground Support 1 1 9 1 1 5Commercial 46 43 324 46 63 231Construction 279 256 2,801 376 340 1,681Industrial 68 62 628 96 81 327Lawn and Garden 19 18 155 23 27 90Logging 15 14 188 26 16 88Recreational 8 7 33 4 12 46Underground MiningPleasure Craft 5 5 179 25 7 30Railroad Equipment 2 2 14 2 3 13
<strong>Cleaning</strong> <strong>Up</strong> <strong>Diesel</strong> <strong>Pollution</strong> l 55NEW JERSEY1999 Emissions in Tons per YearPM10 PM2.5 NOx SO2 VOC COMobile Sources - TOTAL 11,270 9,451 249,716 13,725 195,596 2,193,023Highway Vehicles 5,476 4,132 193,295 7,557 125,827 1,495,174Off-Highway Equipment and Vehicles 5,795 5,319 56,421 6,168 69,768 697,850Heavy Equipment (<strong>Diesel</strong>) 3,027 2,785 28,578 3,941 3,760 16,915Heavy Equipment (Gasoline) 2,182 2,007 5,897 304 64,867 642,876Heavy Equipment (LNG & CNG) 36 36 7,870 8 20 30,888Marine Vessels (<strong>Diesel</strong>) 475 437 11,172 1,680 349 1,472Railroads (<strong>Diesel</strong>) 14 13 559 16 23 56Aircraft 60 42 2,346 218 749 5,643Off-Highway <strong>Diesel</strong> 3,516 3,235 40,308 5,637 4,132 18,443Off-Highway (Other Fuels) 2,278 2,085 16,113 531 65,636 679,407Off-Highway Share <strong>of</strong> Mobile Source <strong>Pollution</strong> 51% 56% 23% 45% 36% 32%Off-Highway <strong>Diesel</strong> Share <strong>of</strong> Mobile Source <strong>Pollution</strong> 31% 34% 16% 41% 2% 1%Off-Highway Heavy <strong>Diesel</strong> Equipment Share <strong>of</strong> Mobile Source <strong>Pollution</strong> 27% 30% 11% 29% 2% 1%Heavy Equipment (<strong>Diesel</strong>) 3,027 2,785 28,578 3,941 3,760 16,915Agriculture 125 115 891 101 122 561Airport Ground Support 23 21 256 34 24 128Commercial 384 353 2,684 381 523 1,910Construction 1,879 1,728 18,863 2,542 2,291 11,317Industrial 391 359 3,571 548 471 1,877Lawn and Garden 180 166 1,444 216 267 863LoggingRecreational 8 7 34 5 12 48Underground MiningPleasure Craft 22 20 736 103 30 122Railroad Equipment 16 15 99 12 21 90NEW MEXICO1999 Emissions in Tons per YearPM10 PM2.5 NOx SO2 VOC COMobile Sources - TOTAL 4,347 3,657 121,396 5,022 63,794 791,382Highway Vehicles 2,288 1,787 77,416 2,850 51,445 675,261Off-Highway Equipment and Vehicles 2,059 1,870 43,980 2,172 12,349 116,121Heavy Equipment (<strong>Diesel</strong>) 920 846 8,284 1,094 1,078 4,982Heavy Equipment (Gasoline) 268 246 826 45 9,800 102,685Heavy Equipment (LNG & CNG) 3 3 769 1 3 3,012Marine Vessels (<strong>Diesel</strong>) - - - - - -Railroads (<strong>Diesel</strong>) 835 752 33,640 989 1,274 3,321Aircraft 33 23 462 44 195 2,121Off-Highway <strong>Diesel</strong> 1,755 1,598 41,924 2,082 2,352 8,303Off-Highway (Other Fuels) 304 272 2,056 90 9,997 107,818Off-Highway Share <strong>of</strong> Mobile Source <strong>Pollution</strong> 47% 51% 36% 43% 19% 15%Off-Highway <strong>Diesel</strong> Share <strong>of</strong> Mobile Source <strong>Pollution</strong> 40% 44% 35% 42% 4% 1%Off-Highway Heavy <strong>Diesel</strong> Equipment Share <strong>of</strong> Mobile Source <strong>Pollution</strong> 21% 23% 7% 22% 2% 1%Heavy Equipment (<strong>Diesel</strong>) 920 846 8,284 1,094 1,078 4,982Agriculture 251 231 1,784 202 244 1,123Airport Ground Support 2 2 23 3 2 12Commercial 51 47 355 50 69 253Construction 511 470 5,126 694 623 3,077Industrial 68 62 656 96 85 325Lawn and Garden 27 25 217 33 41 131Logging 1 1 13 2 1 6Recreational 4 4 19 3 7 27Underground MiningPleasure Craft 2 2 72 10 3 12Railroad Equipment 3 3 20 2 4 18
56 l<strong>Union</strong> <strong>of</strong> <strong>Concerned</strong> <strong>Scientists</strong>NEW YORK1999 Emissions in Tons per YearPM10 PM2.5 NOx SO2 VOC COMobile Sources - TOTAL 24,651 20,886 549,803 32,460 393,618 4,594,262Highway Vehicles 11,080 8,436 389,468 14,917 261,037 3,380,067Off-Highway Equipment and Vehicles 13,571 12,451 160,335 17,543 132,581 1,214,195Heavy Equipment (<strong>Diesel</strong>) 7,133 6,562 66,079 8,932 8,641 39,488Heavy Equipment (Gasoline) 3,765 3,463 9,601 551 120,182 1,101,190Heavy Equipment (LNG & CNG) 63 63 13,792 14 37 53,971Marine Vessels (<strong>Diesel</strong>) 2,006 1,846 47,192 7,082 1,475 6,219Railroads (<strong>Diesel</strong>) 474 427 19,038 543 767 1,894Aircraft 131 90 4,635 423 1,479 11,433Off-Highway <strong>Diesel</strong> 9,613 8,834 132,308 16,556 10,883 47,601Off-Highway (Other Fuels) 3,959 3,617 28,027 987 121,698 1,166,594Off-Highway Share <strong>of</strong> Mobile Source <strong>Pollution</strong> 55% 60% 29% 54% 34% 26%Off-Highway <strong>Diesel</strong> Share <strong>of</strong> Mobile Source <strong>Pollution</strong> 39% 42% 24% 51% 3% 1%Off-Highway Heavy <strong>Diesel</strong> Equipment Share <strong>of</strong> Mobile Source <strong>Pollution</strong> 29% 31% 12% 28% 2% 1%Heavy Equipment (<strong>Diesel</strong>) 7,133 6,562 66,079 8,932 8,641 39,488Agriculture 901 829 6,414 724 877 4,037Airport Ground Support 68 62 748 99 70 373Commercial 814 749 5,695 809 1,109 4,052Construction 4,293 3,950 43,122 5,784 5,237 25,868Industrial 754 694 6,795 1,047 919 3,602Lawn and Garden 187 172 1,510 224 277 897Logging 19 18 241 33 21 113Recreational 23 21 101 13 35 142Underground MiningPleasure Craft 36 33 1,233 172 51 204Railroad Equipment 37 34 220 27 46 199NORTH CAROLINA1999 Emissions in Tons per YearPM10 PM2.5 NOx SO2 VOC COMobile Sources - TOTAL 15,610 13,098 364,410 17,894 257,354 2,958,978Highway Vehicles 8,475 6,558 286,170 10,860 187,870 2,258,091Off-Highway Equipment and Vehicles 7,134 6,540 78,240 7,035 69,484 700,887Heavy Equipment (<strong>Diesel</strong>) 4,520 4,158 41,547 5,561 5,312 24,527Heavy Equipment (Gasoline) 1,981 1,822 5,258 283 62,640 620,582Heavy Equipment (LNG & CNG) 54 54 11,843 12 27 46,864Marine Vessels (<strong>Diesel</strong>) 157 144 3,686 556 115 486Railroads (<strong>Diesel</strong>) 335 301 13,470 390 526 1,335Aircraft 88 61 2,436 233 864 7,094Off-Highway <strong>Diesel</strong> 5,012 4,604 58,703 6,507 5,953 26,348Off-Highway (Other Fuels) 2,123 1,936 19,537 528 63,531 674,539Off-Highway Share <strong>of</strong> Mobile Source <strong>Pollution</strong> 46% 50% 22% 39% 27% 24%Off-Highway <strong>Diesel</strong> Share <strong>of</strong> Mobile Source <strong>Pollution</strong> 32% 35% 16% 36% 2% 1%Off-Highway Heavy <strong>Diesel</strong> Equipment Share <strong>of</strong> Mobile Source <strong>Pollution</strong> 29% 32% 11% 31% 2% 1%Heavy Equipment (<strong>Diesel</strong>) 4,520 4,158 41,547 5,561 5,312 24,527Agriculture 1,018 937 7,246 819 991 4,561Airport Ground Support 18 17 200 27 19 100Commercial 277 255 1,941 275 378 1,381Construction 2,368 2,179 23,791 3,205 2,888 14,269Industrial 516 475 4,858 738 610 2,515Lawn and Garden 165 151 1,325 198 245 791Logging 112 103 1,385 190 119 649Recreational 11 10 49 7 17 69Underground MiningPleasure Craft 19 18 662 93 27 109Railroad Equipment 15 14 90 11 19 82
<strong>Cleaning</strong> <strong>Up</strong> <strong>Diesel</strong> <strong>Pollution</strong> l 57NORTH DAKOTA1999 Emissions in Tons per YearPM10 PM2.5 NOx SO2 VOC COMobile Sources - TOTAL 6,681 6,030 83,781 5,924 29,454 331,724Highway Vehicles 778 612 26,828 950 15,635 230,051Off-Highway Equipment and Vehicles 5,903 5,419 56,953 4,974 13,819 101,673Heavy Equipment (<strong>Diesel</strong>) 5,262 4,840 38,393 4,416 5,217 24,062Heavy Equipment (Gasoline) 198 182 725 37 7,906 73,376Heavy Equipment (LNG & CNG) 2 2 456 0 3 1,792Marine Vessels (<strong>Diesel</strong>) - - - - - -Railroads (<strong>Diesel</strong>) 429 386 17,286 512 643 1,703Aircraft 13 9 93 9 50 740Off-Highway <strong>Diesel</strong> 5,691 5,227 55,679 4,928 5,860 25,765Off-Highway (Other Fuels) 212 192 1,274 46 7,959 75,908Off-Highway Share <strong>of</strong> Mobile Source <strong>Pollution</strong> 88% 90% 68% 84% 47% 31%Off-Highway <strong>Diesel</strong> Share <strong>of</strong> Mobile Source <strong>Pollution</strong> 85% 87% 67% 83% 20% 8%Off-Highway Heavy <strong>Diesel</strong> Equipment Share <strong>of</strong> Mobile Source <strong>Pollution</strong> 79% 80% 46% 75% 18% 7%Heavy Equipment (<strong>Diesel</strong>) 5,262 4,840 38,393 4,416 5,217 24,062Agriculture 4,901 4,508 34,878 3,939 4,769 21,955Airport Ground Support 1 1 7 1 1 3Commercial 38 35 267 38 52 190Construction 295 271 2,965 397 360 1,779Industrial 21 20 188 29 26 101Lawn and Garden 3 3 24 3 4 13LoggingRecreational 1 1 5 1 2 7Underground MiningPleasure Craft 2 1 52 7 2 9Railroad Equipment 1 1 7 1 2 6OHIO1999 Emissions in Tons per YearPM10 PM2.5 NOx SO2 VOC COMobile Sources - TOTAL 22,663 19,332 507,177 30,225 319,081 3,946,969Highway Vehicles 9,712 7,456 336,407 12,751 220,451 2,923,447Off-Highway Equipment and Vehicles 12,951 11,876 170,770 17,475 98,630 1,023,522Heavy Equipment (<strong>Diesel</strong>) 7,363 6,774 64,885 8,485 8,475 38,948Heavy Equipment (Gasoline) 2,560 2,355 7,735 407 86,594 907,991Heavy Equipment (LNG & CNG) 69 69 15,112 15 37 59,774Marine Vessels (<strong>Diesel</strong>) 1,916 1,763 44,141 7,346 1,380 5,811Railroads (<strong>Diesel</strong>) 929 836 37,339 1,071 1,486 3,709Aircraft 114 79 1,557 150 659 7,289Off-Highway <strong>Diesel</strong> 10,208 9,373 146,365 16,903 11,340 48,468Off-Highway (Other Fuels) 2,743 2,503 24,404 572 87,290 975,054Off-Highway Share <strong>of</strong> Mobile Source <strong>Pollution</strong> 57% 61% 34% 58% 31% 26%Off-Highway <strong>Diesel</strong> Share <strong>of</strong> Mobile Source <strong>Pollution</strong> 45% 49% 29% 56% 4% 1%Off-Highway Heavy <strong>Diesel</strong> Equipment Share <strong>of</strong> Mobile Source <strong>Pollution</strong> 33% 35% 13% 28% 3% 1%Heavy Equipment (<strong>Diesel</strong>) 7,363 6,774 64,885 8,485 8,475 38,948Agriculture 2,496 2,296 17,768 2,007 2,429 11,184Airport Ground Support 15 14 163 22 15 81Commercial 391 360 2,739 389 533 1,949Construction 3,425 3,152 34,414 4,615 4,179 20,645Industrial 708 651 6,694 1,010 843 3,440Lawn and Garden 243 223 1,954 290 361 1,165Logging 10 10 127 18 11 60Recreational 15 14 67 9 23 95Underground Mining 16 15 104 11 23 88Pleasure Craft 21 19 721 101 30 119Railroad Equipment 22 21 134 16 28 122
58 l<strong>Union</strong> <strong>of</strong> <strong>Concerned</strong> <strong>Scientists</strong>OKLAHOMA1999 Emissions in Tons per YearPM10 PM2.5 NOx SO2 VOC COMobile Sources - TOTAL 8,825 7,496 191,900 9,457 126,016 1,406,441Highway Vehicles 4,115 3,184 139,506 5,272 95,622 1,125,754Off-Highway Equipment and Vehicles 4,711 4,311 52,394 4,185 30,393 280,688Heavy Equipment (<strong>Diesel</strong>) 3,327 3,061 27,197 3,361 3,574 16,357Heavy Equipment (Gasoline) 807 742 2,058 114 25,789 247,494Heavy Equipment (LNG & CNG) 13 13 2,867 3 13 11,349Marine Vessels (<strong>Diesel</strong>) 29 27 694 103 22 92Railroads (<strong>Diesel</strong>) 474 426 19,066 556 734 1,886Aircraft 60 42 512 50 261 3,510Off-Highway <strong>Diesel</strong> 3,831 3,515 46,957 4,019 4,330 18,335Off-Highway (Other Fuels) 880 796 5,437 166 26,064 262,353Off-Highway Share <strong>of</strong> Mobile Source <strong>Pollution</strong> 53% 58% 27% 44% 24% 20%Off-Highway <strong>Diesel</strong> Share <strong>of</strong> Mobile Source <strong>Pollution</strong> 43% 47% 25% 43% 3% 1%Off-Highway Heavy <strong>Diesel</strong> Equipment Share <strong>of</strong> Mobile Source <strong>Pollution</strong> 38% 41% 14% 36% 3% 1%Heavy Equipment (<strong>Diesel</strong>) 3,327 3,061 27,197 3,361 3,574 16,357Agriculture 2,105 1,937 14,979 1,694 2,048 9,429Airport Ground Support 5 5 60 8 6 30Commercial 118 108 823 117 160 586Construction 802 737 8,056 1,090 977 4,831Industrial 235 217 2,566 350 291 1,163Lawn and Garden 43 40 346 52 65 208LoggingRecreational 4 3 16 2 6 23Underground MiningPleasure Craft 9 8 312 44 13 51Railroad Equipment 7 6 40 5 8 36OREGON1999 Emissions in Tons per YearPM10 PM2.5 NOx SO2 VOC COMobile Sources - TOTAL 7,748 6,621 166,652 9,638 105,127 1,254,980Highway Vehicles 3,402 2,638 115,556 4,326 69,127 932,069Off-Highway Equipment and Vehicles 4,346 3,983 51,097 5,312 36,000 322,912Heavy Equipment (<strong>Diesel</strong>) 2,579 2,373 23,781 3,134 2,972 13,940Heavy Equipment (Gasoline) 993 914 2,578 137 31,974 289,913Heavy Equipment (LNG & CNG) 15 15 3,340 3 8 13,148Marine Vessels (<strong>Diesel</strong>) 469 432 11,001 1,678 344 1,450Railroads (<strong>Diesel</strong>) 238 214 9,561 279 367 945Aircraft 52 36 835 80 335 3,516Off-Highway <strong>Diesel</strong> 3,286 3,018 44,342 5,091 3,682 16,335Off-Highway (Other Fuels) 1,061 965 6,754 221 32,318 306,577Off-Highway Share <strong>of</strong> Mobile Source <strong>Pollution</strong> 56% 60% 31% 55% 34% 26%Off-Highway <strong>Diesel</strong> Share <strong>of</strong> Mobile Source <strong>Pollution</strong> 42% 46% 27% 53% 4% 1%Off-Highway Heavy <strong>Diesel</strong> Equipment Share <strong>of</strong> Mobile Source <strong>Pollution</strong> 33% 36% 14% 33% 3% 1%Heavy Equipment (<strong>Diesel</strong>) 2,579 2,373 23,781 3,134 2,972 13,940Agriculture 720 662 5,124 579 701 3,226Airport Ground Support 7 6 74 10 7 37Commercial 135 124 945 134 184 673Construction 1,219 1,122 12,254 1,643 1,487 7,350Industrial 163 150 1,496 229 196 785Lawn and Garden 76 70 611 91 113 364Logging 235 216 2,911 399 250 1,365Recreational 9 9 41 5 14 58Underground MiningPleasure Craft 8 8 286 40 12 47Railroad Equipment 7 6 39 5 8 36
<strong>Cleaning</strong> <strong>Up</strong> <strong>Diesel</strong> <strong>Pollution</strong> l 59PENNSYLVANIA1999 Emissions in Tons per YearPM10 PM2.5 NOx SO2 VOC COMobile Sources - TOTAL 18,893 15,910 460,461 25,440 297,147 3,672,357Highway Vehicles 9,639 7,432 333,057 12,484 211,627 2,761,299Off-Highway Equipment and Vehicles 9,253 8,478 127,404 12,956 85,520 911,058Heavy Equipment (<strong>Diesel</strong>) 4,858 4,469 43,689 5,863 5,803 26,271Heavy Equipment (Gasoline) 2,027 1,861 6,680 364 76,498 817,532Heavy Equipment (LNG & CNG) 59 59 12,926 13 31 51,042Marine Vessels (<strong>Diesel</strong>) 1,632 1,502 38,331 5,769 1,200 5,051Railroads (<strong>Diesel</strong>) 566 510 22,697 652 905 2,255Aircraft 110 76 3,081 294 1,084 8,907Off-Highway <strong>Diesel</strong> 7,057 6,481 104,717 12,285 7,908 33,578Off-Highway (Other Fuels) 2,197 1,997 22,687 671 77,613 877,480Off-Highway Share <strong>of</strong> Mobile Source <strong>Pollution</strong> 49% 53% 28% 51% 29% 25%Off-Highway <strong>Diesel</strong> Share <strong>of</strong> Mobile Source <strong>Pollution</strong> 37% 41% 23% 48% 3% 1%Off-Highway Heavy <strong>Diesel</strong> Equipment Share <strong>of</strong> Mobile Source <strong>Pollution</strong> 26% 28% 10% 23% 2% 1%Heavy Equipment (<strong>Diesel</strong>) 4,858 4,469 43,689 5,863 5,803 26,271Agriculture 983 904 6,994 790 956 4,402Airport Ground SupportCommercial 396 364 2,768 393 539 1,969Construction 2,471 2,273 24,811 3,343 3,013 14,884Industrial 640 589 5,926 904 768 3,090Lawn and Garden 186 172 1,502 224 276 893Logging 26 24 327 45 28 153Recreational 19 18 85 11 30 120Underground Mining 99 91 654 68 144 549Pleasure Craft 14 13 477 67 20 79Railroad Equipment 24 22 146 18 30 132RHODE ISLAND1999 Emissions in Tons per YearPM10 PM2.5 NOx SO2 VOC COMobile Sources - TOTAL 1,277 1,058 31,751 1,742 23,026 275,757Highway Vehicles 669 502 24,568 941 16,155 200,877Off-Highway Equipment and Vehicles 608 557 7,183 802 6,871 74,880Heavy Equipment (<strong>Diesel</strong>) 268 247 2,531 353 334 1,483Heavy Equipment (Gasoline) 208 191 604 31 6,360 67,609Heavy Equipment (LNG & CNG) 5 5 1,150 1 3 4,531Marine Vessels (<strong>Diesel</strong>) 113 104 2,671 395 84 352Railroads (<strong>Diesel</strong>) 0 0 1 0 0 0Aircraft 13 9 227 22 91 905Off-Highway <strong>Diesel</strong> 381 351 5,203 748 418 1,835Off-Highway (Other Fuels) 227 206 1,980 54 6,453 73,044Off-Highway Share <strong>of</strong> Mobile Source <strong>Pollution</strong> 48% 53% 23% 46% 30% 27%Off-Highway <strong>Diesel</strong> Share <strong>of</strong> Mobile Source <strong>Pollution</strong> 30% 33% 16% 43% 2% 1%Off-Highway Heavy <strong>Diesel</strong> Equipment Share <strong>of</strong> Mobile Source <strong>Pollution</strong> 21% 23% 8% 20% 2% 1%Heavy Equipment (<strong>Diesel</strong>) 268 247 2,531 353 334 1,483Agriculture 5 4 33 4 5 21Airport Ground Support 1 1 9 1 1 4Commercial 36 33 249 35 49 177Construction 150 138 1,509 203 183 905Industrial 55 51 514 79 66 268Lawn and Garden 16 15 130 19 24 77LoggingRecreational 1 1 6 1 2 8Underground MiningPleasure Craft 2 2 69 10 3 11Railroad Equipment 2 2 12 2 3 11
60 l<strong>Union</strong> <strong>of</strong> <strong>Concerned</strong> <strong>Scientists</strong>SOUTH CAROLINA1999 Emissions in Tons per YearPM10 PM2.5 NOX SO2 VOC COMobile Sources - TOTAL 8,359 7,050 199,280 9,877 139,698 1,571,400Highway Vehicles 4,521 3,531 153,775 5,631 98,286 1,210,372Off-Highway Equipment and Vehicles 3,838 3,519 45,505 4,246 41,412 361,028Heavy Equipment (<strong>Diesel</strong>) 1,991 1,831 18,617 2,512 2,349 10,837Heavy Equipment (Gasoline) 1,234 1,135 2,652 151 36,537 316,832Heavy Equipment (LNG & CNG) 23 23 5,037 5 11 19,922Marine Vessels (<strong>Diesel</strong>) 278 256 6,567 971 205 866Railroads (<strong>Diesel</strong>) 276 248 11,100 321 433 1,100Aircraft 37 25 1,532 286 1,876 11,471Off-Highway <strong>Diesel</strong> 2,545 2,336 36,284 3,804 2,987 12,803Off-Highway (Other Fuels) 1,293 1,183 9,221 442 38,425 348,225Off-Highway Share <strong>of</strong> Mobile Source <strong>Pollution</strong> 46% 50% 23% 43% 30% 23%Off-Highway <strong>Diesel</strong> Share <strong>of</strong> Mobile Source <strong>Pollution</strong> 30% 33% 18% 39% 2% 1%Off-Highway Heavy <strong>Diesel</strong> Equipment Share <strong>of</strong> Mobile Source <strong>Pollution</strong> 24% 26% 9% 25% 2% 1%Heavy Equipment (<strong>Diesel</strong>) 1,991 1,831 18,617 2,512 2,349 10,837Agriculture 405 372 2,880 326 394 1,813Airport Ground Support 6 6 66 9 6 33Commercial 114 105 798 113 155 568Construction 1,029 947 10,335 1,399 1,255 6,199Industrial 232 213 2,164 330 276 1,125Lawn and Garden 88 81 702 106 131 421Logging 93 85 1,148 157 99 538Recreational 4 3 16 2 6 22Underground MiningPleasure Craft 14 12 462 65 19 76Railroad Equipment 8 7 47 6 10 42SOUTH DAKOTA1999 Emissions in Tons per YearPM10 PM2.5 NOx SO2 VOC COMobile Sources - TOTAL 4,964 4,443 62,544 4,414 28,649 333,383Highway Vehicles 890 700 30,633 1,083 17,097 243,873Off-Highway Equipment and Vehicles 4,075 3,743 31,911 3,331 11,552 89,510Heavy Equipment (<strong>Diesel</strong>) 3,788 3,485 27,781 3,209 3,770 17,382Heavy Equipment (Gasoline) 199 183 651 34 7,621 68,011Heavy Equipment (LNG & CNG) 3 3 730 1 3 2,881Marine Vessels (<strong>Diesel</strong>) 0 0 2 0 0 0Railroads (<strong>Diesel</strong>) 66 59 2,657 79 99 262Aircraft 18 13 90 9 59 973Off-Highway <strong>Diesel</strong> 3,854 3,545 30,440 3,288 3,869 17,644Off-Highway (Other Fuels) 220 199 1,472 43 7,682 71,866Off-Highway Share <strong>of</strong> Mobile Source <strong>Pollution</strong> 82% 84% 51% 76% 40% 27%Off-Highway <strong>Diesel</strong> Share <strong>of</strong> Mobile Source <strong>Pollution</strong> 78% 80% 49% 75% 14% 5%Off-Highway Heavy <strong>Diesel</strong> Equipment Share <strong>of</strong> Mobile Source <strong>Pollution</strong> 76% 78% 44% 73% 13% 5%Heavy Equipment (<strong>Diesel</strong>) 3,788 3,485 27,781 3,209 3,770 17,382Agriculture 3,474 3,196 24,728 2,793 3,381 15,566Airport Ground Support 1 1 7 1 1 3Commercial 35 32 243 34 47 173Construction 234 215 2,358 315 285 1,413Industrial 33 31 305 47 41 161Lawn and Garden 3 3 26 4 4 14Logging 2 2 28 4 2 13Recreational 3 3 15 2 5 21Underground MiningPleasure Craft 2 2 61 9 2 10Railroad Equipment 2 1 9 1 2 8
<strong>Cleaning</strong> <strong>Up</strong> <strong>Diesel</strong> <strong>Pollution</strong> l 61TENNESSEE1999 Emissions in Tons per YearPM10 PM2.5 NOX SO2 VOC COMobile Sources - TOTAL 12,433 10,508 300,769 17,469 186,488 2,129,990Highway Vehicles 6,113 4,716 211,719 7,898 139,020 1,701,910Off-Highway Equipment and Vehicles 6,320 5,791 89,050 9,571 47,467 428,081Heavy Equipment (<strong>Diesel</strong>) 3,278 3,015 29,455 3,904 3,792 17,556Heavy Equipment (Gasoline) 1,276 1,174 3,202 174 41,311 371,289Heavy Equipment (LNG & CNG) 32 32 7,153 7 16 28,281Marine Vessels (<strong>Diesel</strong>) 1,146 1,054 25,904 4,698 809 3,407Railroads (<strong>Diesel</strong>) 524 472 21,366 599 855 2,148Aircraft 65 45 1,970 188 684 5,399Off-Highway <strong>Diesel</strong> 4,947 4,541 76,725 9,201 5,456 23,111Off-Highway (Other Fuels) 1,373 1,251 12,325 370 42,011 404,969Off-Highway Share <strong>of</strong> Mobile Source <strong>Pollution</strong> 51% 55% 30% 55% 26% 20%Off-Highway <strong>Diesel</strong> Share <strong>of</strong> Mobile Source <strong>Pollution</strong> 40% 43% 26% 53% 3% 1%Off-Highway Heavy <strong>Diesel</strong> Equipment Share <strong>of</strong> Mobile Source <strong>Pollution</strong> 26% 29% 10% 22% 2% 1%Heavy Equipment (<strong>Diesel</strong>) 3,278 3,015 29,455 3,904 3,792 17,556Agriculture 971 893 6,913 782 945 4,351Airport Ground Support 14 13 152 20 14 76Commercial 185 170 1,293 184 252 920Construction 1,654 1,522 16,610 2,249 2,016 9,964Industrial 328 302 3,062 467 390 1,593Lawn and Garden 74 69 598 90 111 357Logging 21 19 262 36 22 123Recreational 6 5 25 3 9 35Underground MiningPleasure Craft 14 13 477 67 20 79Railroad Equipment 11 10 65 8 13 59TEXAS1999 Emissions in Tons per YearPM10 PM2.5 NOx SO2 VOC COMobile Sources - TOTAL 43,910 37,363 956,097 64,423 619,425 6,691,570Highway Vehicles 18,856 14,407 648,850 25,132 466,475 4,967,626Off-Highway Equipment and Vehicles 25,054 22,956 307,247 39,291 152,950 1,723,945Heavy Equipment (<strong>Diesel</strong>) 12,972 11,934 126,745 15,018 17,451 79,900Heavy Equipment (Gasoline) 3,843 3,534 11,094 643 127,454 1,530,294Heavy Equipment (LNG & CNG) 80 80 16,766 17 57 69,734Marine Vessels (<strong>Diesel</strong>) 5,798 5,334 57,085 20,352 1,764 7,796Railroads (<strong>Diesel</strong>) 2,119 1,907 85,752 2,479 2,664 6,923Aircraft 243 168 9,805 783 3,561 29,298Off-Highway <strong>Diesel</strong> 20,889 19,175 269,583 37,849 21,878 94,619Off-Highway (Other Fuels) 4,165 3,781 37,664 1,442 131,072 1,629,325Off-Highway Share <strong>of</strong> Mobile Source <strong>Pollution</strong> 57% 61% 31% 61% 25% 26%Off-Highway <strong>Diesel</strong> Share <strong>of</strong> Mobile Source <strong>Pollution</strong> 48% 51% 27% 59% 4% 1%Off-Highway Heavy <strong>Diesel</strong> Equipment Share <strong>of</strong> Mobile Source <strong>Pollution</strong> 30% 32% 14% 23% 3% 1%Heavy Equipment (<strong>Diesel</strong>) 12,972 11,934 126,745 15,018 17,451 79,900Agriculture 4,599 4,230 32,728 3,701 4,474 20,601Airport Ground Support 80 74 2,688 118 842 5,550Commercial 739 680 5,168 734 1,006 3,677Construction 5,636 5,185 70,000 7,661 9,038 41,995Industrial 1,367 1,257 11,012 2,025 1,319 5,325Lawn and Garden 394 363 3,169 475 585 1,889Logging 64 59 792 108 68 371Recreational 22 20 96 13 34 136Underground MiningPleasure Craft 32 29 858 154 36 143Railroad Equipment 39 36 236 28 49 213
62 l<strong>Union</strong> <strong>of</strong> <strong>Concerned</strong> <strong>Scientists</strong>UTAH1999 Emissions in Tons per YearPM10 PM2.5 NOX SO2 VOC COMobile Sources - TOTAL 5,247 4,510 108,432 5,966 70,923 813,868Highway Vehicles 1,881 1,427 67,105 2,556 47,382 628,719Off-Highway Equipment and Vehicles 3,367 3,083 41,328 3,410 23,541 185,149Heavy Equipment (<strong>Diesel</strong>) 2,548 2,345 24,552 3,289 3,061 14,696Heavy Equipment (Gasoline) 540 497 1,316 79 19,775 159,717Heavy Equipment (LNG & CNG) 9 9 1,862 2 5 7,339Marine Vessels (<strong>Diesel</strong>) - - - - - -Railroads (<strong>Diesel</strong>) 10 214 12,207 12 15 39Aircraft 260 19 1,391 29 685 3,358Off-Highway <strong>Diesel</strong> 2,558 2,559 36,759 3,301 3,075 14,734Off-Highway (Other Fuels) 809 525 4,568 110 20,466 170,414Off-Highway Share <strong>of</strong> Mobile Source <strong>Pollution</strong> 64% 68% 38% 57% 33% 23%Off-Highway <strong>Diesel</strong> Share <strong>of</strong> Mobile Source <strong>Pollution</strong> 49% 57% 34% 55% 4% 2%Off-Highway Heavy <strong>Diesel</strong> Equipment Share <strong>of</strong> Mobile Source <strong>Pollution</strong> 49% 52% 23% 55% 4% 2%Heavy Equipment (<strong>Diesel</strong>) 2,548 2,345 24,552 3,289 3,061 14,696Agriculture 266 244 1,891 214 258 1,190Airport Ground Support 10 10 115 15 11 57Commercial 71 66 498 71 97 355Construction 2,054 1,890 20,622 2,779 2,505 12,373Industrial 104 96 995 148 127 504Lawn and Garden 31 29 253 38 46 150LoggingRecreational 4 3 16 2 6 22Underground MiningPleasure Craft 4 4 140 20 6 23Railroad Equipment 4 4 24 3 5 21VERMONT1999 Emissions in Tons per YearPM10 PM2.5 NOx SO2 VOC COMobile Sources - TOTAL 1,283 1,080 28,409 1,295 23,550 276,805Highway Vehicles 714 558 24,437 883 14,681 218,149Off-Highway Equipment and Vehicles 570 522 3,973 412 8,870 58,656Heavy Equipment (<strong>Diesel</strong>) 331 304 2,872 375 381 1,732Heavy Equipment (Gasoline) 226 208 426 32 8,457 53,913Heavy Equipment (LNG & CNG) 3 3 634 1 1 2,495Marine Vessels (<strong>Diesel</strong>) - - - - - -Railroads (<strong>Diesel</strong>) - - - - - -Aircraft 10 7 40 4 30 515Off-Highway <strong>Diesel</strong> 331 304 2,872 375 381 1,732Off-Highway (Other Fuels) 239 217 1,100 37 8,489 56,923Off-Highway Share <strong>of</strong> Mobile Source <strong>Pollution</strong> 44% 48% 14% 32% 38% 21%Off-Highway <strong>Diesel</strong> Share <strong>of</strong> Mobile Source <strong>Pollution</strong> 26% 28% 10% 29% 2% 1%Off-Highway Heavy <strong>Diesel</strong> Equipment Share <strong>of</strong> Mobile Source <strong>Pollution</strong> 26% 28% 10% 29% 2% 1%Heavy Equipment (<strong>Diesel</strong>) 331 304 2,872 375 381 1,732Agriculture 122 112 865 98 118 544Airport Ground Support 1 1 8 1 1 4Commercial 23 21 161 23 31 115Construction 132 121 1,326 178 161 796Industrial 31 29 286 44 37 150Lawn and Garden 12 11 90 14 18 56Logging 5 5 66 9 6 31Recreational 4 4 17 2 6 24Underground MiningPleasure Craft 1 1 48 7 2 8Railroad Equipment 1 1 7 1 1 6
<strong>Cleaning</strong> <strong>Up</strong> <strong>Diesel</strong> <strong>Pollution</strong> l 63VIRGINIA1999 Emissions in Tons per YearPM10 PM2.5 NOX SO2 VOC COMobile Sources - TOTAL 13,582 11,419 330,965 17,182 208,422 2,440,849Highway Vehicles 6,899 5,309 239,174 8,996 150,953 1,865,989Off-Highway Equipment and Vehicles 6,683 6,111 91,791 8,186 57,468 574,860Heavy Equipment (<strong>Diesel</strong>) 3,400 3,127 31,264 4,182 4,074 18,682Heavy Equipment (Gasoline) 1,639 1,508 4,269 230 50,786 521,164Heavy Equipment (LNG & CNG) 25 25 5,600 5 13 22,085Marine Vessels (<strong>Diesel</strong>) 761 700 17,925 2,670 561 2,362Railroads (<strong>Diesel</strong>) 757 681 30,431 880 1,190 3,016Aircraft 102 70 2,303 219 845 7,550Off-Highway <strong>Diesel</strong> 4,918 4,508 79,620 7,732 5,825 24,061Off-Highway (Other Fuels) 1,765 1,603 12,171 454 51,644 550,799Off-Highway Share <strong>of</strong> Mobile Source <strong>Pollution</strong> 49% 54% 28% 48% 28% 24%Off-Highway <strong>Diesel</strong> Share <strong>of</strong> Mobile Source <strong>Pollution</strong> 36% 40% 24% 45% 3% 1%Off-Highway Heavy <strong>Diesel</strong> Equipment Share <strong>of</strong> Mobile Source <strong>Pollution</strong> 25% 27% 9% 24% 2% 1%Heavy Equipment (<strong>Diesel</strong>) 3,400 3,127 31,264 4,182 4,074 18,682Agriculture 623 573 4,436 501 606 2,792Airport Ground Support 21 19 227 30 21 114Commercial 189 174 1,320 187 257 939Construction 1,924 1,769 19,330 2,604 2,346 11,595Industrial 302 278 2,745 422 366 1,448Lawn and Garden 167 154 1,346 201 248 802Logging 58 53 714 98 61 335Recreational 9 8 40 5 14 57Underground Mining 80 74 532 55 117 446Pleasure Craft 14 13 493 69 20 81Railroad Equipment 14 12 81 10 17 73WASHINGTON1999 Emissions in Tons per YearPM10 PM2.5 NOx SO2 VOC COMobile Sources - TOTAL 12,068 10,337 261,539 16,230 160,906 1,886,820Highway Vehicles 4,685 3,575 162,770 6,264 102,915 1,379,135Off-Highway Equipment and Vehicles 7,383 6,763 98,770 9,966 57,991 507,685Heavy Equipment (<strong>Diesel</strong>) 3,787 3,484 34,229 4,491 4,342 20,182Heavy Equipment (Gasoline) 1,652 1,519 4,179 223 51,076 454,399Heavy Equipment (LNG & CNG) 24 24 5,201 5 14 20,471Marine Vessels (<strong>Diesel</strong>) 1,242 1,142 29,244 4,360 914 3,854Railroads (<strong>Diesel</strong>) 595 535 23,925 697 923 2,367Aircraft 84 58 1,991 190 723 6,411Off-Highway <strong>Diesel</strong> 5,624 5,162 87,398 9,548 6,179 26,404Off-Highway (Other Fuels) 1,760 1,601 11,372 419 51,813 481,281Off-Highway Share <strong>of</strong> Mobile Source <strong>Pollution</strong> 61% 65% 38% 61% 36% 27%Off-Highway <strong>Diesel</strong> Share <strong>of</strong> Mobile Source <strong>Pollution</strong> 47% 50% 33% 59% 4% 1%Off-Highway Heavy <strong>Diesel</strong> Equipment Share <strong>of</strong> Mobile Source <strong>Pollution</strong> 31% 34% 13% 28% 3% 1%Heavy Equipment (<strong>Diesel</strong>) 3,787 3,484 34,229 4,491 4,342 20,182Agriculture 1,207 1,111 8,593 971 1,175 5,409Airport Ground Support 21 19 227 30 21 113Commercial 225 207 1,575 224 306 1,120Construction 1,660 1,528 16,682 2,237 2,026 10,006Industrial 263 242 2,400 368 318 1,264Lawn and Garden 111 102 897 133 164 532Logging 260 239 3,215 440 276 1,507Recreational 14 13 60 8 21 85Underground MiningPleasure Craft 15 14 513 72 21 85Railroad Equipment 11 10 68 8 14 61
64 l<strong>Union</strong> <strong>of</strong> <strong>Concerned</strong> <strong>Scientists</strong>WEST VIRGINIA1999 Emissions in Tons per YearPM10 PM2.5 NOX SO2 VOC COMobile Sources - TOTAL 4,308 3,679 109,933 7,256 53,335 648,285Highway Vehicles 2,022 1,587 68,770 2,477 40,179 540,910Off-Highway Equipment and Vehicles 2,286 2,092 41,163 4,779 13,156 107,376Heavy Equipment (<strong>Diesel</strong>) 854 786 7,646 999 1,046 4,721Heavy Equipment (Gasoline) 259 238 765 41 10,955 93,185Heavy Equipment (LNG & CNG) 5 5 1,153 1 3 4,547Marine Vessels (<strong>Diesel</strong>) 833 766 18,914 3,362 591 2,488Railroads (<strong>Diesel</strong>) 313 281 12,577 365 488 1,245Aircraft 22 15 108 10 73 1,189Off-Highway <strong>Diesel</strong> 2,000 1,833 39,137 4,726 2,125 8,455Off-Highway (Other Fuels) 286 259 2,026 53 11,031 98,921Off-Highway Share <strong>of</strong> Mobile Source <strong>Pollution</strong> 53% 57% 37% 66% 25% 17%Off-Highway <strong>Diesel</strong> Share <strong>of</strong> Mobile Source <strong>Pollution</strong> 46% 50% 36% 65% 4% 1%Off-Highway Heavy <strong>Diesel</strong> Equipment Share <strong>of</strong> Mobile Source <strong>Pollution</strong> 20% 21% 7% 14% 2% 1%Heavy Equipment (<strong>Diesel</strong>) 854 786 7,646 999 1,046 4,721Agriculture 141 130 1,007 114 138 634Airport Ground Support 1 1 14 2 1 7Commercial 47 43 328 47 64 234Construction 442 407 4,452 599 540 2,671Industrial 79 72 749 111 97 379Lawn and Garden 12 11 96 15 19 60Logging 11 10 133 18 11 62Recreational 3 2 11 1 4 15Underground Mining 113 104 747 78 164 627Pleasure Craft 3 2 88 12 4 15Railroad Equipment 3 3 21 3 4 19WISCONSIN1999 Emissions in Tons per YearPM10 PM2.5 NOx SO2 VOC COMobile Sources - TOTAL 12,780 10,934 263,600 14,007 194,226 2,094,097Highway Vehicles 5,607 4,352 191,146 7,118 114,898 1,556,635Off-Highway Equipment and Vehicles 7,174 6,582 72,455 6,890 79,329 537,461Heavy Equipment (<strong>Diesel</strong>) 4,307 3,962 36,095 4,581 4,731 21,749Heavy Equipment (Gasoline) 2,106 1,937 4,085 286 72,738 478,599Heavy Equipment (LNG & CNG) 37 37 8,136 8 19 32,181Marine Vessels (<strong>Diesel</strong>) 392 360 8,815 1,633 275 1,159Railroads (<strong>Diesel</strong>) 264 238 7,451 311 281 735Aircraft 69 47 7,873 71 1,284 3,038Off-Highway <strong>Diesel</strong> 4,963 4,560 52,361 6,525 5,288 23,644Off-Highway (Other Fuels) 2,211 2,021 20,094 365 74,041 513,818Off-Highway Share <strong>of</strong> Mobile Source <strong>Pollution</strong> 56% 60% 28% 49% 41% 26%Off-Highway <strong>Diesel</strong> Share <strong>of</strong> Mobile Source <strong>Pollution</strong> 39% 42% 20% 47% 3% 1%Off-Highway Heavy <strong>Diesel</strong> Equipment Share <strong>of</strong> Mobile Source <strong>Pollution</strong> 34% 36% 14% 33% 2% 1%Heavy Equipment (<strong>Diesel</strong>) 4,307 3,962 36,095 4,581 4,731 21,749Agriculture 2,255 2,074 16,050 1,813 2,194 10,103Airport Ground Support 5 4 51 7 5 25Commercial 189 174 1,319 187 257 939Construction 1,341 1,234 13,484 1,808 1,636 8,087Industrial 357 328 3,353 509 421 1,736Lawn and Garden 75 69 602 89 111 360Logging 45 41 552 76 47 259Recreational 15 14 65 8 23 92Underground MiningPleasure Craft 16 15 555 77 23 92Railroad Equipment 11 10 63 8 13 57
<strong>Cleaning</strong> <strong>Up</strong> <strong>Diesel</strong> <strong>Pollution</strong> l 65WYOMING1999 Emissions in Tons per YearPM10 PM2.5 NOX SO2 VOC COMobile Sources - TOTAL 2,288 1,980 57,047 2,438 25,044 294,048Highway Vehicles 833 655 29,194 1,018 16,406 240,204Off-Highway Equipment and Vehicles 1,455 1,325 27,854 1,420 8,637 53,845Heavy Equipment (<strong>Diesel</strong>) 745 685 6,221 768 826 3,807Heavy Equipment (Gasoline) 177 163 369 26 6,984 46,149Heavy Equipment (LNG & CNG) 1 1 276 0 2 1,093Marine Vessels (<strong>Diesel</strong>) - - - - - -Railroads (<strong>Diesel</strong>) 519 467 20,910 619 778 2,060Aircraft 14 9 77 7 47 736Off-Highway <strong>Diesel</strong> 1,264 1,152 27,131 1,387 1,605 5,867Off-Highway (Other Fuels) 191 173 723 33 7,033 47,978Off-Highway Share <strong>of</strong> Mobile Source <strong>Pollution</strong> 64% 67% 49% 58% 35% 18%Off-Highway <strong>Diesel</strong> Share <strong>of</strong> Mobile Source <strong>Pollution</strong> 55% 58% 48% 57% 6% 2%Off-Highway Heavy <strong>Diesel</strong> Equipment Share <strong>of</strong> Mobile Source <strong>Pollution</strong> 33% 35% 11% 32% 3% 1%Heavy Equipment (<strong>Diesel</strong>) 745 685 6,221 768 826 3,807Agriculture 391 359 2,781 314 380 1,751Airport Ground Support 1 0 5 1 1 3Commercial 19 18 134 19 26 95Construction 247 227 2,483 333 301 1,490Industrial 36 33 420 55 46 180Lawn and Garden 3 3 27 4 4 14Logging 5 5 64 9 6 30Recreational 6 6 28 4 10 39Underground Mining 35 32 232 24 51 194Pleasure Craft 1 1 42 6 2 7Railroad Equipment 1 1 5 1 1 4
l<strong>Cleaning</strong> <strong>Up</strong> <strong>Diesel</strong> <strong>Pollution</strong>E M I S S I O N S F R O M O F F - H I G H W AY E N G I N E S B Y S T A T EFrom tractors to trains to cruise ships,“<strong>of</strong>f-highway” diesel engines are foundin every part <strong>of</strong> the country. We rely onthese workhorses to do our heavy movingand lifting, but unlike highway trucksand buses that have to meet strictpollution standards, <strong>of</strong>f-highway engineshave been allowed to run wild, leavinga trail <strong>of</strong> toxic soot and smog-formingpollutants in the air we breathe.This report’s analysis <strong>of</strong> pollution from<strong>of</strong>f-highway diesel engines in all 50 statesand 20 major metropolitan areas showsthe significant impact these engines haveon air quality both locally and nationally.For just a slight increase in equipmentcosts, existing cleanup technologies couldbe installed on <strong>of</strong>f-highway diesel engines,cutting pollution significantly andallowing us all to breathe a little easier.National HeadquartersTwo Brattle SquareCambridge, MA 02238-9105Phone: (617) 547-5552Fax: (617) 864-9405West Coast Office2397 Shattuck Ave., Ste. 203Berkeley, CA 94704Phone: (510) 843-1872Fax: (510) 843-3785Washington Office1707 H St. NW, Ste. 600Washington, DC 20006-3962Phone: (202) 223-6133Fax: (202) 223-6162Website www.ucsusa.orgEmail ucs@ucsusa.orgPrinted on recycled paper using soy-based inks