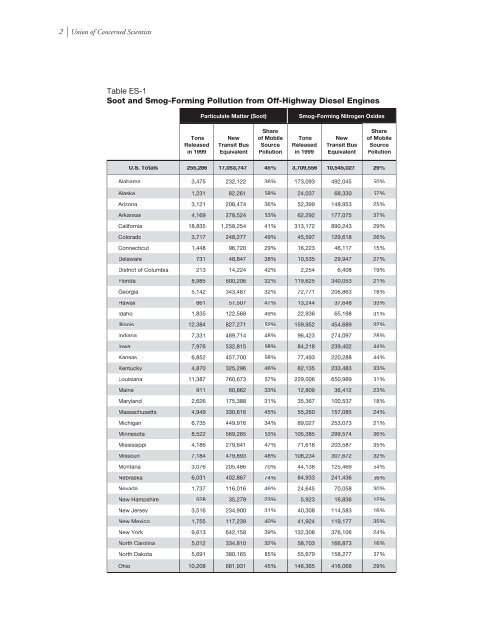
2 l <strong>Union</strong> <strong>of</strong> <strong>Concerned</strong> <strong>Scientists</strong> Particulate Matter (Soot) Smog-Forming Nitrogen OxidesTable ES-1Soot and Smog-Forming <strong>Pollution</strong> from Off-Highway <strong>Diesel</strong> EnginesTonsReleasedin 1999NewTransit BusEquivalentShare<strong>of</strong> MobileSource<strong>Pollution</strong>TonsReleasedin 1999NewTransit BusEquivalentShare<strong>of</strong> MobileSource<strong>Pollution</strong>U.S. Totals 255,286 17,053,747 45% 3,709,556 10,545,027 29%Alabama 3,475 232,122 36% 173,093 492,045 50%Alaska 1,231 82,261 58% 24,037 68,330 57%Arizona 3,121 208,474 36% 52,399 148,953 25%Arkansas 4,169 278,524 53% 62,292 177,075 37%California 18,835 1,258,254 41% 313,172 890,243 29%Colorado 3,717 248,277 49% 45,597 129,618 26%Connecticut 1,448 96,720 29% 16,223 46,117 15%Delaware 731 48,847 38% 10,535 29,947 27%District <strong>of</strong> Columbia 213 14,224 42% 2,254 6,408 19%Florida 8,985 600,206 32% 119,625 340,053 21%Georgia 5,142 343,487 32% 72,771 206,863 18%Hawaii 861 57,507 47% 13,244 37,648 33%Idaho 1,835 122,568 49% 22,936 65,198 31%Illinois 12,384 827,271 52% 159,952 454,689 32%Indiana 7,331 489,714 48% 96,423 274,097 28%Iowa 7,976 532,815 68% 84,218 239,402 44%Kansas 6,852 457,700 68% 77,493 220,288 44%Kentucky 4,870 325,296 46% 82,135 233,483 33%Louisiana 11,387 760,673 67% 229,006 650,989 61%Maine 911 60,862 33% 12,809 36,412 23%Maryland 2,626 175,388 31% 35,367 100,537 18%Massachusetts 4,949 330,616 45% 55,260 157,085 24%Michigan 6,735 449,916 34% 89,027 253,073 21%Minnesota 8,522 569,285 53% 105,385 299,574 36%Mississippi 4,186 279,641 47% 71,618 203,587 35%Missouri 7,184 479,893 48% 108,234 307,672 32%Montana 3,076 205,486 70% 44,138 125,469 54%Nebraska 6,031 402,867 74% 84,933 241,436 56%Nevada 1,737 116,016 46% 24,645 70,058 30%New Hampshire 528 35,279 23% 5,923 16,836 12%New Jersey 3,516 234,900 31% 40,308 114,583 16%New Mexico 1,755 117,239 40% 41,924 119,177 35%New York 9,613 642,158 39% 132,308 376,106 24%North Carolina 5,012 334,810 32% 58,703 166,873 16%North Dakota 5,691 380,165 85% 55,679 158,277 67%Ohio 10,208 681,931 45% 146,365 416,068 29%
<strong>Cleaning</strong> <strong>Up</strong> <strong>Diesel</strong> <strong>Pollution</strong> l 3Table ES-1 continuedParticulate Matter (Soot)Smog-Forming Nitrogen OxidesTonsReleasedin 1999NewTransit BusEquivalentShare<strong>of</strong> MobileSource<strong>Pollution</strong>TonsReleasedin 1999NewTransit BusEquivalentShare<strong>of</strong> MobileSource<strong>Pollution</strong>U.S. Totals 255,286 17,053,747 45% 3,709,556 10,545,027 29%Oklahoma 3,831 255,891 43% 46,957 133,482 25%Oregon 3,286 219,500 42% 44,342 126,050 27%Pennsylvania 7,057 471,403 37% 104,717 297,675 23%Rhode Island 381 25,465 30% 5,203 14,790 16%South Carolina 2,545 170,009 30% 36,284 103,143 18%South Dakota 3,854 257,484 78% 30,440 86,529 49%Tennessee 4,947 330,485 40% 76,725 218,102 26%Texas 20,889 1,395,461 48% 269,583 766,334 29%Utah 2,558 170,886 49% 36,759 104,495 34%Vermont 331 22,110 26% 2,872 8,165 10%Virginia 4,918 328,509 36% 79,620 226,332 24%Washington 5,624 375,665 47% 87,398 248,443 33%West Virginia 2,000 133,571 46% 39,137 111,253 36%Wisconsin 4,963 331,511 39% 52,361 148,843 48%Wyoming 1,264 84,408 55% 27,131 77,123 48%NOTE: Off-highway diesel engines include heavy equipment, marine vessels, and locomotives. Particulate matter emissions are forparticles 10 microns in diameter and less (PM10). To calculate new transit bus equivalent emissions, we assumed a model year 2004transit bus would release 0.44 grams per mile <strong>of</strong> particulate matter and 10.34 grams per mile <strong>of</strong> nitrogen oxides, and that the bus wouldtravel 30,861 miles per year. See Appendix A for more details on UCS’s compilation <strong>of</strong> the 1999 emission inventory and thecalculation <strong>of</strong> new transit bus equivalent emissions.SOURCE: All the mobile source emission data except California’s <strong>of</strong>f-highway pollution are based on the final 1999 emission inventorycompiled by the U.S. EPA. The data are located at: ftp://ftp.epa.gov/EmisInventory/finalnei99ver2/criteria. California’s <strong>of</strong>f-highwayemissions were provided by the California Air Resources Board. New transit bus grams-per-mile emissions are from Mark and Morey,2000. Transit bus annual miles traveled are from U.S. DOE, 2002.buses. These engines also release about one-quarter<strong>of</strong> the smog-forming nitrogen oxides from allmobile sources—equal to the emissions <strong>of</strong> about10.5 million new urban transit buses.California and Texas are the nation’s biggestpolluters in terms <strong>of</strong> particulate matter and nitrogenoxide emissions from <strong>of</strong>f-highway engines(Table ES-1). In seven other states (Iowa, Kansas,Louisiana, Montana, Nebraska, North Dakota,and South Dakota), these engines contributemore than 60 percent <strong>of</strong> the particulate matterreleased by mobile sources.New York and Los Angeles top the list <strong>of</strong>metropolitan areas with the most particulatematter and nitrogen oxide emissions from <strong>of</strong>fhighwayengines, followed by Houston, Boston,and Chicago (Table ES-2, p.4). In the Houstonand Pittsburgh areas, <strong>of</strong>f-highway engines areresponsible for at least half <strong>of</strong> all particulatematter emitted by mobile sources.PLAYING BY UNFAIR RULESGrowing awareness <strong>of</strong> the public health dangers<strong>of</strong> diesel exhaust has led to stricter emissions standardsfor highway engines, but standards for <strong>of</strong>fhighwayengines continue to lag behind. Heavydiesel equipment, for example, was not requiredto meet any emissions standards until 1996—a