National Elephant Strategy - People's Trust for Endangered Species
National Elephant Strategy - People's Trust for Endangered Species
National Elephant Strategy - People's Trust for Endangered Species

Create successful ePaper yourself
Turn your PDF publications into a flip-book with our unique Google optimized e-Paper software.
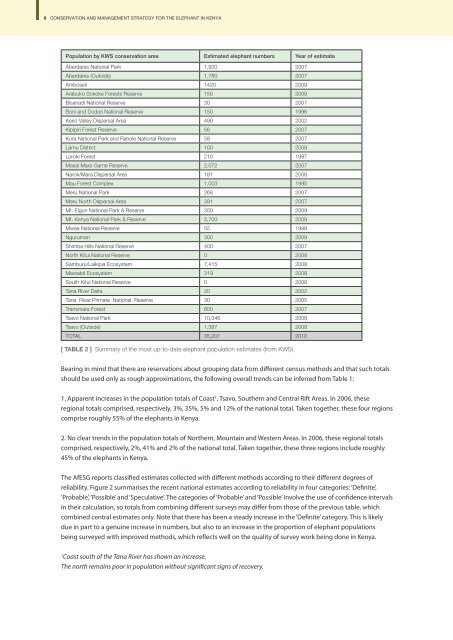
6 CONSERVATION AND MANAGEMENT STRATEGY FOR THE ELEPHANT IN KENYACONSERVATION AND MANAGEMENT STRATEGY FOR THE ELEPHANT IN KENYA 7Population by KWS conservation area Estimated elephant numbers Year of estimateAberdares <strong>National</strong> Park 1,920 2007Aberdares (Outside) 1,780 2007Amboseli 1420 2009Arabuko Sokoke Forests Reserve 150 2009Bisanadi <strong>National</strong> Reserve 30 2007Boni and Dodori <strong>National</strong> Reserve 150 1996Kerio Valley Dispersal Area 490 2002Kipipiri Forest Reserve 56 2007Kora <strong>National</strong> Park and Rahole <strong>National</strong> Reserve 58 2007Lamu District 100 2009Loroki Forest 210 1997Masai Mara Game Reserve 2,072 2007Narok/Mara Dispersal Area 181 2006Mau Forest Complex 1,003 1995Meru <strong>National</strong> Park 268 2007Meru North Dispersal Area 391 2007Mt. Elgon <strong>National</strong> Park & Reserve 350 2009Mt. Kenya <strong>National</strong> Park & Reserve 3,700 2009Mwea <strong>National</strong> Reserve 55 1998Nguruman 300 2009Shimba Hills <strong>National</strong> Reserve 400 2007North Kitui <strong>National</strong> Reserve 0 2008Samburu/Laikipia Ecosystem 7,415 2008Marsabit Ecosystem 319 2008South Kitui <strong>National</strong> Reserve 0 2008Tana River Delta 20 2002Tana River Primate <strong>National</strong> Reserve 30 2005Transmara Forest 600 2007Tsavo <strong>National</strong> Park 10,346 2008Tsavo (Outside) 1,387 2008TOTAL 35,201 2010[ TABLE 2 ] Summary of the most up-to-date elephant population estimates (from KWS).Bearing in mind that there are reservations about grouping data from different census methods and that such totalsshould be used only as rough approximations, the following overall trends can be inferred from Table 1:<strong>Elephant</strong> numbers35,00030,00025,00020,00015,00010,000[ FIGURE 2 ]5,0000Speculative Possible Probable Definite1995 1998 2002 2006Survey yearTotal estimates <strong>for</strong> elephant numbers in Kenya in different reliability categories 1995–2006 ((AfESG reports).KWS – internal estimates indicate that there are about 35,000 elephants in the country in 2010 (not verifiedby AfESG at date of publication).The report prepared <strong>for</strong> the years 1990 to 2002 by KWS and Save the <strong>Elephant</strong>s (Thouless et al., 2008) is the mostrecent comprehensive summary of the status of elephants across Kenya, compiling and discussing the availablein<strong>for</strong>mation on numbers and trends in the period following the ivory trade ban of 1989. The previous national levelef<strong>for</strong>t was in 1992 (Poole et al., 1992), which described the history of elephants in the country up to that date anddocumented the dramatic decline in elephant populations across the country. The decline appeared to be broughtto a halt with the protection of elephants offered by the <strong>for</strong>mation of an effective management by KWS in 1990 andthe CITES ban on the ivory trade.1. Apparent increases in the population totals of Coast 1 , Tsavo, Southern and Central Rift Areas. In 2006, theseregional totals comprised, respectively, 3%, 35%, 5% and 12% of the national total. Taken together, these four regionscomprise roughly 55% of the elephants in Kenya.2. No clear trends in the population totals of Northern, Mountain and Western Areas. In 2006, these regional totalscomprised, respectively, 2%, 41% and 2% of the national total. Taken together, these three regions include roughly45% of the elephants in Kenya.The AfESG reports classified estimates collected with different methods according to their different degrees ofreliability. Figure 2 summarises the recent national estimates according to reliability in four categories: ‘Definite’,‘Probable’, ‘Possible’ and ‘Speculative’. The categories of ‘Probable’ and ‘Possible’ involve the use of confidence intervalsin their calculation, so totals from combining different surveys may differ from those of the previous table, whichcombined central estimates only. Note that there has been a steady increase in the ‘Definite’ category. This is likelydue in part to a genuine increase in numbers, but also to an increase in the proportion of elephant populationsbeing surveyed with improved methods, which reflects well on the quality of survey work being done in Kenya.1Coast south of the Tana River has shown an increase.The north remains poor in population without significant signs of recovery.The KWS-STE 2008 report (Thouless et al., 2008) presented survey data and other estimates confirming that the1990s were the first decade since the 1960s that Kenya’s elephants were not in substantial decline. The numbers ofelephants in the major savannah populations such as Tsavo, Laikipia-Samburu and Amboseli appeared to beincreasing, while others such as Meru and the Mara ecosystem were stable or increasing slightly. The status of<strong>for</strong>est populations was much less clear within the Mount Kenya and Aberdare highland <strong>for</strong>ests (the largest <strong>for</strong>estpopulations), other highland areas in Central Rift or Western regions, and the coastal <strong>for</strong>ests. In contrast to thesavannah populations, there is no clear evidence that <strong>for</strong>est populations were affected by the massive poaching ofthe 1970–1980s, with some indication that most of these populations are at moderately high densities (more than 1elephant per km 2 ). However, as a result of continued de<strong>for</strong>estation, the <strong>for</strong>est habitat <strong>for</strong> elephants has been reducedsignificantly, and it is thus possible – though not reliably established – that <strong>for</strong>est populations may have beenreduced accordingly.Reliable trend data are available only where time series of good quality estimates are available, and this is the case<strong>for</strong> a limited number of well-studied populations in Tsavo, Amboseli, Meru, Masai Mara and Samburu / Laikipia. Datafrom aerial total counts in Tsavo during the period 1988–2008 show a steady annual increase rate of 3.5% (Figure 3).The Amboseli <strong>Elephant</strong> Research Project (Moss, 2001) has recorded known elephant numbers continuously since theearly 1970s and the population has increased at an average annual rate of 3.8% since 1978 (Figure 4).