National Elephant Strategy - People's Trust for Endangered Species
National Elephant Strategy - People's Trust for Endangered Species
National Elephant Strategy - People's Trust for Endangered Species

Create successful ePaper yourself
Turn your PDF publications into a flip-book with our unique Google optimized e-Paper software.
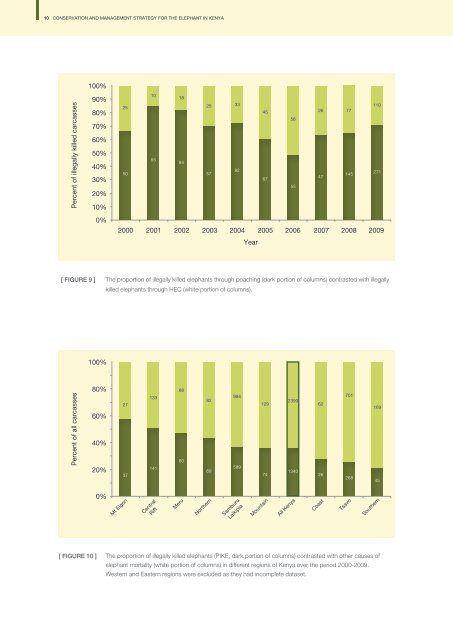
10 CONSERVATION AND MANAGEMENT STRATEGY FOR THE ELEPHANT IN KENYACONSERVATION AND MANAGEMENT STRATEGY FOR THE ELEPHANT IN KENYA 111.1.2 <strong>Elephant</strong> rangePercent of illegally killed carcasses100%90%80%70%60%50%40%30%20%10%0%25501055188425 3357824567585526 7747145110271Estimating and evaluating the quality of the range of elephant populations is central to their conservation, but facescertain difficulties. The area and configuration of terrain used by African elephants is affected by their search <strong>for</strong> foodand other resources, by the history of the use of the area by people and elephants, and the elephants’ own assessmentof the disturbance and risk posed by people. Where there are ‘hard edges’, such as fences or abrupt changes in habitator land use, e.g. a shift from savannah or <strong>for</strong>est to farmland, it may be possible to define accurately the boundaries of anelephant population range, often in relation to conflict incidence. In cases where survey areas have been based on theboundaries of PAs, natural landmarks or administrative boundaries, the definition of range is somewhat arbitrary and isnot necessarily an accurate assessment of the actual area used, or potentially used, by the population. Defining range is aparticular problem in remote areas with low-density populations and or few observers, or in areas where animals may becrossing international borders. It is often difficult to document reductions in elephant range, as people are far more likelyto notice when elephants are newly seen in an area, rather than when they have not been seen <strong>for</strong> a period of time.Since 2002, AfESG (Blanc et al., 2002) has employed a set of categories to refine the definition of elephant range. Thesecategories include:2000 2001 2002 2003 2004 2005 2006 2007 2008 2009YearCategoryDescription[ FIGURE 9 ]The proportion of illegally killed elephants through poaching (dark portion of columns) contrasted with illegallyKnown rangeAreas of suitable habitat which, if searched with reasonable intensity, are likely toyield signs of elephant presence. If such presence is absent <strong>for</strong> a 10-year period,Known range is degraded to Possible range.killed elephants through HEC (white portion of columns).Possible rangeAreas within historical range and in suitable habitat where there are no negative datato rule out the presence of elephants.Doubtful rangeAreas where there are reasons to believe that elephants are no longer present, butwhich have not been <strong>for</strong>mally surveyed. If further corroborative evidence is obtained,areas of Doubtful range are re-classified as Non-range.Non-rangeAreas with no elephants, due to habitat conversion or local extinction.100%Point recordsSightings or signs of elephants outside of Known range.Percent of all carcasses80%60%40%20%2737133141888082699945891297423901340622670126816945For the reasons discussed above, the systematic documenting and monitoring of elephant range has been difficult toachieve in most countries in Africa, and Kenya is no exception. In<strong>for</strong>mation on areas of known and possible range, whichwere surveyed or un-assessed and presented in the AfESG reports since 2002, are presented in Table 3.<strong>Elephant</strong> range in km 2 2002 2006Known Possible Total Known Possible TotalSurveyed/assessed 86,079Notavailable86,079 79,043 8,889 87,932Unassessed 15,670 7,318 22,988 12,597 6,584 19,1810%Mt ElgonCentralRiftMeruNorthernSamburuLaikipiaMountainAll KenyaCoastTsavoSouthernTotal 101,749 7,318 109,067 91,640 15,473 107,113[ TABLE 3 ]Areas of elephant range in Kenya, surveyed/assessed and un-assessed, in Known and Possible Categories (from AfESG reports).[ FIGURE 10 ]The proportion of illegally killed elephants (PIKE; dark portion of columns) contrasted with other causes ofelephant mortality (white portion of columns) in different regions of Kenya over the period 2000-2009.Western and Eastern regions were excluded as they had incomplete dataset.