Global Car Parc - Inchcape
Global Car Parc - Inchcape
Global Car Parc - Inchcape
- No tags were found...

Create successful ePaper yourself
Turn your PDF publications into a flip-book with our unique Google optimized e-Paper software.
<strong>Inchcape</strong> plc14th Annual Deutsche Retail Store Tour26 January 2012André LacroixGroup Chief Executive
Overview1. Business model and strategy2. <strong>Global</strong> growth opportunities3. Our agenda for 20122
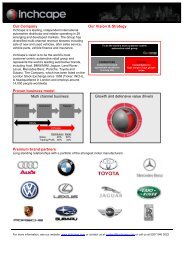
Proven business modelBroad geographicspread with scaleoperationsDistributionWell financed route tomarket for our BrandPartners:Distributionand RetailPortfolio of leadingluxury & premiumbrandsRetailDiversified revenuestreams fromgrowth anddefensive valuedriversDecentralised and empowered organisation withglobal synergies on governance and best practice3
Attractive Geographic and Channel Mix2/3 of profits from EmergingMarkets and Asia Pacific2/3 of profits from high returnDistribution businessRussia and EmergingMarkets16%Australasia22%Retail31%UK22%North Asia14%Distribution69%Europe11%South Asia15%* Note: 2010 underlying trading profit excludes central costs and exceptional items and Australia property profit/Romania impairments4
<strong>Inchcape</strong> Customer 1 st StrategyTo be the world’s most customer centricautomotive retail groupSTRENGTHENSuperior customer valueproposition through<strong>Inchcape</strong> AdvantageEXPANDConsolidation in highmargin / high growthareas5
Primary focus on organic growth through strongoperational discipline on Top Five PrioritiesCustomer 1 st strategyto create differentiationCommercial initiativesto grow revenues ahead ofcompetitorsCash initiativesto grow profit and operatingcash faster than revenueBalanced focus between commercial and cash initiativesBrand portfolioof the world’s leadingpremium and luxuryautomotive brands6
Structural Growth
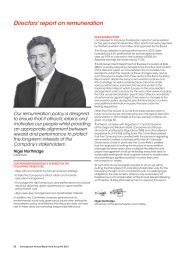
Strong growth forecast in global car market<strong>Global</strong> TIV<strong>Global</strong> <strong>Car</strong> <strong>Parc</strong>7578+30%84909498905 932 960+16%9881,018 1,051millionmillion2011 2012 2013 2014 2015 20162011 2012 2013 2014 2015 2016Source: IHS Automotive (<strong>Global</strong> Insight)Source: LMC Automotive (JD Power)Growth opportunities across the value chainGrowth opportunities across the value chainUpdated January 20128
Uniquely positioned to take advantage ofglobal growthStrongest playerswill lead industryconsolidation5 global trendsFiveglobaltrendsBroad basedglobal recovery<strong>Car</strong> <strong>Parc</strong>growth in boththe fastgrowing andadvancedmarketsTechnology willcreate value andacceleratereplacement inadvancedmarketsStructural growthled by wealthcreation inAPAC/EmergingMarkets<strong>Inchcape</strong> strengths play to key global trends to return topeak earnings and beyond9
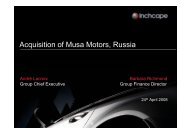
Majority of global growth in population and GDP willcome from Asia-Pacific and Emerging MarketsNorth AmericaGDP 2011:Growth 2011-16:Pop 2011:Growth 2011-16:$14,548bn+ $1,510bn347m+ 17mWestern EuropeGDP 2011:Growth 2011-16:Pop 2011:Growth 2011-16:$14,381bn+ $785bn411m+ 6mEastern Europe & RussiaGDP 2011:Growth 2011-16:Pop 2011:Growth 2011-16:$2,843bn+ $573bn447m+ 2mAsia & OceaniaGDP 2011:Growth 2011-16:$14,363bn+ $4,046bnPop 2011: 3,819mGrowth 2011-16: + 195mSouth & Central AmericaGDP 2011:Growth 2011-16:Pop 2011:Growth 2011-16:$3,344bn+ $735bn574m+ 33mSource: EIU (real GDP, 2005 US $), IMF (population)AfricaGDP 2011:Growth 2011-16:$1,140bn+ $272bnPop 2011: 1,029mGrowth 2011-16: + 128mGDP 2011:Growth 2011-16:Pop 2011:Growth 2011-16:Middle East$1,435bn+ $354bnAsia-Pacific and Emerging Markets will represent 94% of population growth2011 - 16 and 72% of GDP growth247m+ 27mUpdated January 201211
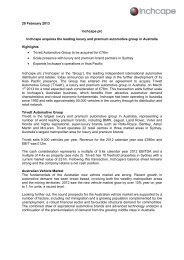
…this pattern is reflected in car industry growthNorth AmericaTIV 2011 14.3mGrowth 2011-16: +3.4mWestern EuropeTIV 2011 14.3mGrowth 2011-16: +2.2mEastern Europe & RussiaTIV 2011 4.7mGrowth 2011-16: +2.2mAsia & OceaniaTIV 2011 30.5mGrowth 2011-16: +12.2mSouth & Central AmericaTIV 2011 6.4mGrowth 2011-16: +2.5mAfricaTIV 2011 0.8mGrowth 2011-16: +0.4mMiddle EastTIV 2011 3.1mGrowth 2011-16: +0.4mSource: IHS Automotive (<strong>Global</strong> Insight) / <strong>Inchcape</strong> estimatesUpdated January 2012Asia-Pacific and Emerging Markets will represent 65% of global car salesby 2016 and 79% of car industry growth 2011 - 1612
<strong>Inchcape</strong> exposure to fast growing APAC /Emerging Markets<strong>Inchcape</strong>markets% <strong>Inchcape</strong>Revenue2006-10% <strong>Inchcape</strong>Trading profit2006-10GDP growthCAGR2011-16(Source: EIU)TIV growthCAGR2011-16(Source: IHS Automotive(<strong>Global</strong> Insight))<strong>Car</strong> parcgrowthCAGR2011-16(Source: LMC Automotive(JD Power))Asia-Pacific &Emerging Markets 21 42% 65% +3.6% +6.0% +3.5%UK & Europe5 58% 35% +1.0% +3.2% +1.1%<strong>Inchcape</strong> in 21 fast-growing economies moving forwardUpdated January 201213
Our 2012 Agenda1. Differentiated customer service2. Strong value for money proposition3. Continued focus on aftersales4. Increased focus on businessdevelopment5. Performance management
Differentiated customer service proposition• Innovative <strong>Inchcape</strong> Advantage programme now in its 5 th year• Strong funnel management alongside superior customerprocesses keeps <strong>Inchcape</strong> significantly ahead of competitors• Constantly evolving processes based on insight gained from12,000 monthly customer interviews• <strong>Inchcape</strong> Advantage team further strengthened with successfulbusiness operators• 2012 will see roll out of proven customer service innovations<strong>Inchcape</strong> Advantage remains asignificant competitive advantage15
Superior customer service20019018016Net Promoter Score:Sales & Service (rebased 6m MAV)130125170160120150115140130110120110105100100Feb-07May-07Aug-07Nov-07Feb-08May-08Aug-08Nov-08Feb-09May-09Aug-09Nov-09Feb-10May-10Aug-10Nov-10Feb-11May-11Aug-11Nov-11Sales NPS (LHS) Service NPS (RHS)* Sales and Service NPS series start when data collection commenced
Strong Value for Money proposition• Consumer analysis shows VFM has gained in importance inboth developed and emerging markets*• Core brand partners invest strongly in R&D to deliver superiorinnovation and strengthen pricing power• As a distributor in 22 of our 26 markets, our position in the valuechain allows us to leverage the pricing power of our brandpartners to sustain robust margins• <strong>Inchcape</strong> processes ensure both marketing effectiveness andpricing power of our brandsCreating value from the world’sleading automotive brands* Boston Consulting Group (June 2011)17
<strong>Inchcape</strong> marketing protects pricing power anddelivers robust marginsValue for Money is the perceived value of what you get for what you pay• Product innovation inpowertrain, design, comfort,safety and intelligence• The right vehicle specificationswith the right pricing architecture• Differentiated model USP andeffective marketing, digital andtraditional• Service / warranty packages• Financing options• Excellent customer serviceMargin Accretive Innovation• Belgium - Auris Hybrid ‘betterthan diesel’ campaign• Website, TV commercial andletter to all Toyota customersexplaining why Hybrid is betterthan diesel.GM 66% higher than diesel18
Continued focus on aftersales, 50% of GP• A top priority for <strong>Inchcape</strong> and our Advantage programme• Following the global downturn in new vehicle volumes there hasbeen a natural reduction in the warranty car parc for some markets• <strong>Inchcape</strong> aftersales focus on up-sell in the warranty period andhigher retention in the post warranty period• Innovative marketing programmes demonstrating significantopportunity to grow post-warranty retention• Medium / Long term - global carparc growth will fuel expansion inhighly profitable aftersales19
Post warranty retention success• Aftersales campaigns have delivered, e.g. more thandoubled year 6 retention % since 2008 in SingaporeRebased Singapore aftersales retention2402202001801601401201002008 2009 2010 2011Years 1 to 4 Year 5 Year 6• Toyota Shield Infinity(extended warrantyprogramme). Launched in2007 – customers retaintheir warranty for years 4to 6 if they consistentlyuse <strong>Inchcape</strong> for servicing• Margin accretive20
Increased focus on Business Development• Highly disciplined evaluation of market / brand / contractopportunities• <strong>Inchcape</strong> well positioned to gain access to consolidationopportunities in APAC and Emerging Markets• Long standing brand partnerships• Proven track record of effective brand stewardship – achievingmarket share growth and customer service excellence• Disciplined process to integrate acquisitions and deliver synergies• Well financed group with a strong balance sheet is attractive tobrand partners and is a platform for growth21
Business Development capability upgraded in 2011Arthur KipferlerGroup Strategy & BusinessDevelopment Director2011 DeliverablesDistributionRetailJeremy TaylorGroup Strategy ManagerOwen EdwardsDirector of Business DevelopmentHong KongLand RoverRussia - MoscowJaguar / Land RoverChileRolls RoyceRussia - MoscowBMWKieran GodwinDirector of Strategic Projects, APACLaura DoyleGroup Development ManagerChina - ShaoxingJaguar / Land RoverMartin WheatleyDirector of Corporate ServicesAndrey PatinMusa Motors, Russia22
Performance management discipline both centrallyand locally• Performance management focus in breadth and depth• Processes are timely, frequent and ingrained in the culture• Strong and experienced local management teams• Suite of customer metrics (sales & aftersales) provideleading indicators to help manage the business• Consistent definition of operational and financial metricsenable rigorous benchmarking and performance tracking• The group perspective enables best practice from developedmarkets to be deployed in our EM businesses - leapfroggingthe competition23
Breadth and Depth of <strong>Inchcape</strong> PerformanceManagement5 Year Strat Plan Yearly Budget3+9Forecast9+3ForecastCAPEXCommitteeIACommitteeiPOMCommitteeTalentPerformanceReviewBoardGovernanceDaily, Weekly & Monthly Traffic & VolumeIA Funnel DataWeekly / Monthly P&L, Cash Flow, WC & InventoryAnalysisMonthly Balanced Scorecard, by site, country andregionMonthly performance reviews with each market12 Month Rolling Forecast*iPOM: <strong>Inchcape</strong> peace of mind / Risk Management Committee24
Understanding <strong>Inchcape</strong>below the tip ofthe icebergProven& UniqueBusiness ModelGrowth &Defensive Drivers2/3 Exposure to APAC & EMCustomer Service DifferentiationLeading Premium Brand PartnersPerformance Management Discipline with IndustryLeading ProcessesFocus on Pricing Power in Sales and AftersalesQuality of Local Operations: Scale, Share and Market KnowledgeRigorous Business Development ProcessesDecentralised and Empowered Organisation with <strong>Global</strong>Synergies in Governance and Best Practice25
© <strong>Inchcape</strong> 2012. All rights reserved. Proprietary and confidentialinformation. No unauthorised copying or reproduction. <strong>Inchcape</strong> and the<strong>Inchcape</strong> logo are the registered trademarks of the <strong>Inchcape</strong> Group.The information contained in this presentation has been obtained from companysources and from sources which <strong>Inchcape</strong> believes to be reliable but it has notindependently verified such information and does not guarantee that it isaccurate or complete.Statements made in this presentation that look forward in time or thatexpress management's beliefs, expectations or estimates regarding futureoccurrences are "forward-looking statements" within the meaning of theUnited States federal securities laws. These forward-looking statementsreflect the Group's current expectations concerning future events and actualresults may differ materially from current expectations or historical results.