Measuring Knowledge Management Cycle: Evidence from Iran
Measuring Knowledge Management Cycle: Evidence from Iran
Measuring Knowledge Management Cycle: Evidence from Iran
- No tags were found...
Create successful ePaper yourself
Turn your PDF publications into a flip-book with our unique Google optimized e-Paper software.
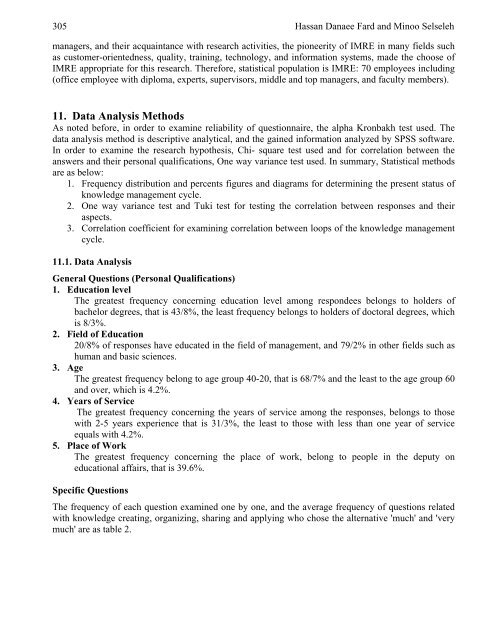
305 Hassan Danaee Fard and Minoo Selselehmanagers, and their acquaintance with research activities, the pioneerity of IMRE in many fields suchas customer-orientedness, quality, training, technology, and information systems, made the choose ofIMRE appropriate for this research. Therefore, statistical population is IMRE: 70 employees including(office employee with diploma, experts, supervisors, middle and top managers, and faculty members).11. Data Analysis MethodsAs noted before, in order to examine reliability of questionnaire, the alpha Kronbakh test used. Thedata analysis method is descriptive analytical, and the gained information analyzed by SPSS software.In order to examine the research hypothesis, Chi- square test used and for correlation between theanswers and their personal qualifications, One way variance test used. In summary, Statistical methodsare as below:1. Frequency distribution and percents figures and diagrams for determining the present status ofknowledge management cycle.2. One way variance test and Tuki test for testing the correlation between responses and theiraspects.3. Correlation coefficient for examining correlation between loops of the knowledge managementcycle.11.1. Data AnalysisGeneral Questions (Personal Qualifications)1. Education levelThe greatest frequency concerning education level among respondees belongs to holders ofbachelor degrees, that is 43/8%, the least frequency belongs to holders of doctoral degrees, whichis 8/3%.2. Field of Education20/8% of responses have educated in the field of management, and 79/2% in other fields such ashuman and basic sciences.3. AgeThe greatest frequency belong to age group 40-20, that is 68/7% and the least to the age group 60and over, which is 4.2%.4. Years of ServiceThe greatest frequency concerning the years of service among the responses, belongs to thosewith 2-5 years experience that is 31/3%, the least to those with less than one year of serviceequals with 4.2%.5. Place of WorkThe greatest frequency concerning the place of work, belong to people in the deputy oneducational affairs, that is 39.6%.Specific QuestionsThe frequency of each question examined one by one, and the average frequency of questions relatedwith knowledge creating, organizing, sharing and applying who chose the alternative 'much' and 'verymuch' are as table 2.


