edwards et al 2012.pdf - Litchman-Klausmeier Lab - Michigan State ...
edwards et al 2012.pdf - Litchman-Klausmeier Lab - Michigan State ...
edwards et al 2012.pdf - Litchman-Klausmeier Lab - Michigan State ...

Create successful ePaper yourself
Turn your PDF publications into a flip-book with our unique Google optimized e-Paper software.
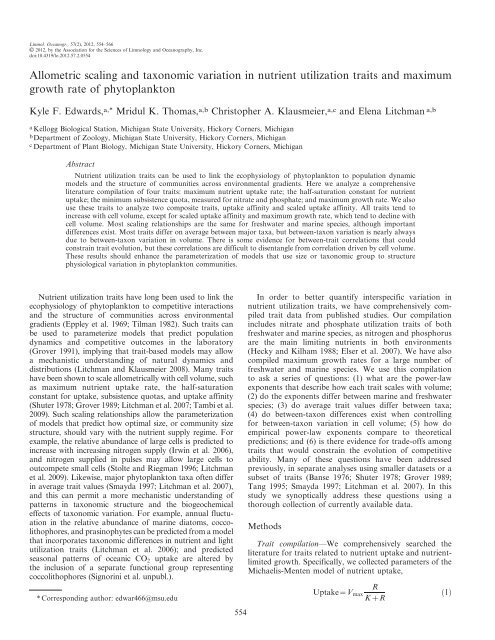
556 Edwards <strong>et</strong> <strong>al</strong>.Fig. 1. Sc<strong>al</strong>ing relationships b<strong>et</strong>ween primary nutrient utilization traits and cell volume. All variables are log 10 -transformed. Marinespecies are larger open circles, freshwater species are sm<strong>al</strong>ler filled circles. Lines plotted are from the SMA regressions in Table 1. If thereis no significant difference in slopes b<strong>et</strong>ween marine and freshwater species, as reported in Table 1, a single solid line is plotted. If theslopes differ significantly, a dotted line is plotted for the marine species and a dashed line is plotted for the freshwater species. If there isno significant correlation b<strong>et</strong>ween the variables, no line is plotted. (A) V N max , (B) KN , (C) Q N min , (D) V P max , (E) KP , (F) Q P min .fewer than two species. Therefore, the following groupswere compared for freshwater species: cyanobacteria,diatoms, desmids, and non-desmid chlorophytes (desmidswere only present for the phosphate traits). For the marinespecies, the following groups were compared: diatoms,dinoflagellates, chlorophytes, haptophytes, and raphidophytes.We <strong>al</strong>so used t-tests to compare mean trait v<strong>al</strong>uesfor freshwater and marine diatoms, because diatoms fromboth environments were relatively well represented.We tested for correlations b<strong>et</strong>ween the primary nutrientutilization traits, which could indicate physiologic<strong>al</strong> traitconstraints or correlated selection pressures. Because mosttraits are correlated with volume, we <strong>al</strong>so tested for parti<strong>al</strong>correlations that controlled for the combined effect ofvolume on each pair of traits. Correlations b<strong>et</strong>ween thecomposite traits are the subject of a separate manuscript, inwhich we use techniques for multivariate an<strong>al</strong>ysis in thepresence of missing data to b<strong>et</strong>ter estimate the correlationsb<strong>et</strong>ween cell volume, uptake affinity, and sc<strong>al</strong>ed uptakeaffinity for N and P (Edwards <strong>et</strong> <strong>al</strong>. 2011).ResultsTrait–volume sc<strong>al</strong>ing—All six of the primary nutrienttraits tend to increase with cell volume (Fig. 1). Four ofthese traits have no significant difference in slope b<strong>et</strong>weenfreshwater and marine species: V N max , Q N min , V P max , and Q P min(Table 1; Fig. 1). In contrast, K N and K P both havesignificantly different slopes for freshwater vs. marinespecies, with freshwater species exhibiting a steeper slopefor K N , but exhibiting no significant relationship withvolume for K P (Fig. 1B,E). Of the four composite nutrienttraits, P affinity, N affinity, and sc<strong>al</strong>ed N affinity <strong>al</strong>l haveslopes that are indistinguishable for freshwater and marinespecies. Both P affinity and N affinity increase with cellvolume, whereas sc<strong>al</strong>ed N affinity decreases with cellvolume (Fig. 2A,B,D). Sc<strong>al</strong>ed P affinity exhibits significantlydifferent slopes for freshwater and marine species,with marine species showing a negative relationship withvolume, and freshwater species showing no significantrelationship (Fig. 2C). Maximum growth rate tends todecline with cell volume (Fig. 3A), and marine species showa significantly sh<strong>al</strong>lower slope than freshwater species(Table 1).B<strong>et</strong>ween-taxon trait differences—m max differs significantlyb<strong>et</strong>ween taxa for both freshwater and marine species,with and without controlling for volume (Table 2;Fig. 3C,D). Because of the greater amount of data form max , we <strong>al</strong>so tested for differences in the <strong>al</strong>lom<strong>et</strong>ricexponent b<strong>et</strong>ween taxa; SMA slopes did not differ bytaxon for freshwater (likelihood ratio 5 6.46, p 5 0.09) ormarine species (likelihood ratio 5 0.58, p 5 0.96). Formarine species, after controlling for volume, mean maximum
Reviews in L&O 557Table 1. Coefficients for SMA regression of nutrient utilization traits and mmax with cell volume. Intercepts (int.) and slopes are listed for separate regressions offreshwater and marine species, and the common intercepts and slopes are listed for regressions that combine freshwater and marine species. 95% confidence interv<strong>al</strong>s for eachparam<strong>et</strong>er are in parentheses. ns is listed for traits not significantly correlated with volume. The fin<strong>al</strong> column lists the p v<strong>al</strong>ue for a test of wh<strong>et</strong>her the freshwater and marinespecies have different slopes. p v<strong>al</strong>ues , 0.05 are marked with an asterisk.Freshwater int. Freshwater slope Marine int. Marine slope Common int. Common slope Slope pV N max28.8(210, 27.4) 1.3(0.82, 2.1) 28.1(28.8, 27.3) 0.82(0.65, 1) 28.0(28.5, 27.4) 0.82(0.68, 0.98) 0.069K N 20.71(21.1, 20.28) 0.52(0.37, 0.73) 20.84(21.2, 20.44) 0.33(0.24, 0.45) 20.61(20.88, 20.34) 0.33(0.26, 0.42) 0.044*Q N min28.7(29.2, 28.2) 0.68(0.51, 0.93) 29.2(29.6, 28.7) 0.88(0.77, 1) 29.0(29.3, 28.8) 0.84(0.76, 0.94) 0.13V P max28.4(28.9, 27.9) 0.81(0.64, 1) 29.1(210, 28.2) 1.0(0.8, 1.3) 28.7(29.2, 28.3) 0.94(0.81, 1.1) 0.17K P ns ns 21.4(21.8, 20.88) 0.41(0.29, 0.56) 21.5(21.9, 21.1) 0.53(0.42, 0.67) 0.0097*Q P min210.5(210.8, 210.2) 0.86(0.74, 1) 210.6(211.1, 210.1) 0.97(0.84, 1.1) 210.7(210.9, 210.4) 0.96(0.87, 1.1) 0.3P affinity 29(29.7, 28.2) 1 .0(0.76, 1.3) 28.1(28.8, 27.5) 0.73(0.58, 0.94) 28.5(29, 28.1) 0.85(0.72, 1) 0.089N affinity 28.6(29.8, 27.3) 1 .0(0.6, 1.7) 28.2(29, 27.4) 0.75(0.58, 0.98) 28.1(28.7, 27.6) 0.75(0.61, 0.92) 0.33P sc<strong>al</strong>edaffinity ns ns 3.6(2.8, 4.3) 20.55(20.38, 20.8) 3.6(3.1, 4.1) 20.65(20.5, 20.83) 0.046*N sc<strong>al</strong>edaffinity 20.96(22.1, 0.2) 0.78(0.43, 1.4) 2.9(1.9, 3.9) 20.63(20.44, 20.91) 2.4(1.8, 3.0) 20.57(20.43, 20.78) 0.54m max 0.69(0.52, 0.86) 20.36(20.30, 20.43) 0.70(0.54, 0.85) 20.24(20.20, 20.29) 0.65(0.53, 0.76) 20.28(20.25, 20.32) 0.0014*growth rates for diatoms are greater than those ofchlorophytes, dinoflagellates, and cyanobacteria (Tukeypairwise comparison p , 0.001 for <strong>al</strong>l tests). This meansthat at a given cell size, diatoms grow faster than othertaxonomic groups. In addition, dinoflagellates and haptophyteshave greater growth rates than cyanobacteria whencontrolling for volume (p 5 0.0081 and p 5 0.0078,respectively). For freshwater species, cyanobacteria havelower growth rates than diatoms, desmids, non-desmidchlorophytes, and cryptomonads when controlling forvolume (p , 0.001 for <strong>al</strong>l tests).Most nutrient traits differ significantly b<strong>et</strong>ween taxawhen cell volume is not included as a covariate (Table 2;Figs.4–7).However,fewtraits differ b<strong>et</strong>ween taxa whenthe effect of volume is accounted for (Table 2; Figs. 4–7).For freshwater species, v<strong>al</strong>ues of primary nutrient traitstend to be greatest for the desmids and sm<strong>al</strong>lest for thecyanobacteria, with diatoms and non-desmid chlorophyteshaving intermediate v<strong>al</strong>ues (Fig. 4). For marinespecies, dinoflagellates and raphidophytes tend to hav<strong>et</strong>he largest trait v<strong>al</strong>ues, whereas diatoms have intermediatev<strong>al</strong>ues and haptophytes and chlorophytes have thesm<strong>al</strong>lest v<strong>al</strong>ues (Fig. 6). Because few b<strong>et</strong>ween-taxondifferences remain when cell volume is controlled for,these differences are evidently driven by differencesb<strong>et</strong>ween taxa in typic<strong>al</strong> cell size. For freshwater species,the exceptions are K P , P affinity, and sc<strong>al</strong>ed N affinity, <strong>al</strong>lof which differ b<strong>et</strong>ween taxa while controlling for volume(Table 2; Figs. 4, 5). Tukey tests show that for K P ,desmids have significantly greater v<strong>al</strong>ues than the otherthree taxa, and non-desmid chlorophytes have significantgreater v<strong>al</strong>ues than cyanobacteria (p , 0.01 for <strong>al</strong>l tests).For P affinity, desmids have significantly greater v<strong>al</strong>uesthan cyanobacteria (p 5 0.034). For sc<strong>al</strong>ed N affinity,diatoms and non-desmid chlorophytes both have significantlygreater v<strong>al</strong>ues than cyanobacteria (p 5 0.036 and0.026, respectively). For marine species, the traits withsignificant b<strong>et</strong>ween-taxon variation when controlling forvolume are K N and sc<strong>al</strong>ed N affinity (Table 2; Figs. 6, 7).For K N , chlorophytes have greater v<strong>al</strong>ues than diatoms (p, 0.001), dinoflagellates (p , 0.001), haptophytes (p ,0.001), and raphidophytes (p , 0.037). For sc<strong>al</strong>ed Naffinity, <strong>al</strong>though there is significant b<strong>et</strong>ween-taxonh<strong>et</strong>erogeneity, no pairwise comparisons are significantlydifferent at p , 0.05.Diatoms—We compared log-transformed mean traitv<strong>al</strong>ues for freshwater and marine diatoms using those traitsmeasured on at least five species from each environment(m max , K N , Q N min , V P max , KP , Q P min, P affinity, and sc<strong>al</strong>ed Paffinity). Marine diatoms have higher m max than freshwaterdiatoms (back-transformed means of 1.0 vs. 0.28, respectively;p 5 0.001). Marine diatoms have lower K N (backtransformedmeans of 1.6 vs. 3.5; p 5 0.018), higher V P max(back-transformed means of 2.8 3 10 26 vs. 2.5 3 10 27 ; p 50.029), and higher K P (back-transformed means of 1.1 vs.0.23; p 5 0.035). Marine diatoms are <strong>al</strong>so larger on average(means of 2090 vs. 436 m 3 ; p 5 0.009), but the othersignificant trait differences were unchanged in an<strong>al</strong>yses ofcovariance that included volume as a covariate.
558 Edwards <strong>et</strong> <strong>al</strong>.Fig. 2. Sc<strong>al</strong>ing relationships b<strong>et</strong>ween composite nutrient traits and cell volume. All variablesare log 10 -transformed. Lines plotted are from the SMA regressions in Table 1. If there is nosignificant difference in slopes b<strong>et</strong>ween marine and freshwater species, as reported in Table 1, asingle solid line is plotted. Symbols as in Fig. 1. (A) P affinity (aff.), (B) N aff., (C) sc<strong>al</strong>ed P aff.,(D) sc<strong>al</strong>ed N aff.Correlations b<strong>et</strong>ween traits—Raw correlations b<strong>et</strong>weenprimary nutrient utilization traits are dominated by strongpositive correlations (Table 3). For the marine species, <strong>al</strong>lpairs of traits are significantly positively correlated. For thefreshwater species, most pairs of traits either are significantlypositively correlated or show no significant correlation.The single exception to this pattern is a significantnegative correlation b<strong>et</strong>ween K P and K N among thefreshwater species (Table 3). The dominance of positivecorrelations among traits is likely driven by the fact that <strong>al</strong>ltraits tend to increase with cell volume (Fig. 1). A similarargument applies to the fact that <strong>al</strong>l of the raw correlationsof nutrient traits with m max are negative (Table 3). W<strong>et</strong>herefore tested for parti<strong>al</strong> correlations, which control forthe simultaneous effect of cell volume on each pair of traits.In this an<strong>al</strong>ysis, positive correlations b<strong>et</strong>ween nutrient traitsstill dominate, as do negative correlations b<strong>et</strong>ween nutrienttraits and m max (Table 3). Among marine species, five pairsof traits still show significant positive correlations b<strong>et</strong>weennutrient traits; among freshwater species, four pairs oftraits show significant positive correlations, whereas K Pand K N again show a negative correlation. As discussedbelow, the preponderance of positive correlations thatremain while controlling for volume may indicate that theeffect of volume is not fully removed.Q N min : Q P min ratios—We tested wh<strong>et</strong>her the ratio Q N min :Q P mintended to differ b<strong>et</strong>ween marine and freshwaterhabitats. Both habitats showed broad variation in thisratio, but freshwater species had a significantly higher ratioon average (Fig. 8; freshwater median molar ratio, 24.4;marine median molar ratio, 13.6; two-sample Wilcoxontest, p 5 0.032).DiscussionSc<strong>al</strong>ing relationships and marine–freshwater differences—We find that V max , K, and Q min <strong>al</strong>l tend to increase as cellvolume increases, <strong>al</strong>though this is not the case for K Pamong freshwater species (Fig. 1; Table 1). It is noteworthythat marine and freshwater slopes are indistinguishable forthose traits that appear to be the most strongly constrainedby volume, V max and Q min (Fig. 1). In contrast, the h<strong>al</strong>fsaturationconstants for uptake appear to be less stronglyconstrained by volume, and have significantly differentslopes for freshwater and marine species (Fig. 1B,E),possibly reflecting different selective pressures from N orP limitation. If P limitation is more prev<strong>al</strong>ent in freshwaterenvironments, it may select for low K P and thus decreas<strong>et</strong>his trait’s dependence on cell volume. The gener<strong>al</strong>lypositive effect of volume on <strong>al</strong>l of these traits is consistent
Reviews in L&O 559Fig. 3. Allom<strong>et</strong>ric sc<strong>al</strong>ing and b<strong>et</strong>ween-taxon differences in m max . (A) m max vs. cell volumefor freshwater and marine species. The fitted SMA regressions a plotted for marine (dashed line)and freshwater (dotted line) species. (B) Violin plots of m max (on a linear sc<strong>al</strong>e). The violin plotscombine a box plot (showing 10th, 25th, 50th, 75th, and 90th quantiles) with a density plot. (C)m max vs. volume for freshwater species, coded by taxon. (D) m max vs. volume for marine species,coded by taxon. Chrys, chrysophytes, crypt, cryptophytes; diat, diatoms; cyan, cyanobacteria;chlor, chlorophytes; dino, dinoflagellates; hapt, haptophytes.with prior an<strong>al</strong>yses (Shuter 1978; Grover 1989; <strong>Litchman</strong><strong>et</strong> <strong>al</strong>. 2007). These results are <strong>al</strong>so largely consistent withthe idea that marine and freshwater phytoplankton havesimilar physiologic<strong>al</strong> ecology (Kilham and Hecky 1988),<strong>al</strong>though the different environments may modify traitpatterns to some extent. For example, diatoms in marineand freshwater systems appear to occupy somewhatdifferent ecologic<strong>al</strong> niches and exhibit different strategies.Marine diatoms are a fast-growing group compared toother marine taxa and appear to be adapted to highnutrient conditions. In contrast, freshwater diatoms haveintermediate growth rates and low K P compared to otherfreshwater taxa. They <strong>al</strong>so have a relatively high P affinityamong freshwater groups, likely being adapted to P-limitedconditions. When marine and freshwater diatoms arecompared, marine diatoms have significantly higher growthrates and K P than freshwater diatoms; conversely, marinediatoms <strong>al</strong>so tend to have lower K N than freshwaterdiatoms. These differences possibly reflect different selectivepressures in marine and freshwater environments.Because of the heavy silica frustules of diatoms, in marineenvironments diatoms benefit from mixing conditionsassociated with high nutrients that select for high growthrates. In freshwaters, diatoms <strong>al</strong>so are associated withmixing conditions, but in sh<strong>al</strong>low lakes mixed layer depthsare too sm<strong>al</strong>l and strongly select against diatoms (Ptacnik<strong>et</strong> <strong>al</strong>. 2003). Therefore, freshwater diatoms may be moreprev<strong>al</strong>ent in deeper lakes that <strong>al</strong>so tend to be lower in P(Dillon and Rigler 1974), causing freshwater diatoms to begood P comp<strong>et</strong>itors.Uptake affinity is often used as a proxy of the ability togrow or comp<strong>et</strong>e under nutrient limitation; therefore, it isimportant to note that uptake affinity on a per-cell basisincreases with cell volume (Fig. 2A,B), because V max sc<strong>al</strong>es
560 Edwards <strong>et</strong> <strong>al</strong>.Table 2. Tests of b<strong>et</strong>ween-taxon trait differences. For each trait, the F statistic and p v<strong>al</strong>ue are listed for a one-way an<strong>al</strong>ysis of variance testing the effect of taxon inisolation (‘‘Taxon only’’ rows). Numerator and denominator degrees of freedom are in parentheses. In addition, the W<strong>al</strong>d (W) statistic and p v<strong>al</strong>ue are listed for a test ofcommon intercepts across taxa in an SMA regression with cell volume (‘‘Taxon with volume [w/vol.]’’ rows). P v<strong>al</strong>ues , 0.05 are marked with an asterisk.N sc<strong>al</strong>edaffinity m maxP sc<strong>al</strong>edaffinityV N max K N Q N minV P max K P Q P minP affinity N affinityMarine speciesTaxon only F 4.5(4,25) 5.3(4,32) 6.3(3,19) 0.9(4,22) 0.6(4,22) 5.2(4,23) 0.81(4,20) 6.5(4,25) 3.5(4,16) 5.8(3,12) 12.2(4, 91)Taxon only p 0.0075* 0.0022* 0.0038* 0.48 0.67 0.0038* 0.53 0.001* 0.031* 0.011* 5.6310 28 *Taxon w/vol. W 1.5 8.8 0.83 1.2 1.6 1.2 1.6 3.3 0.43 0.51 30Taxon w/vol. p 0.24 7.10310 25 * 0.5 0.35 0.21 0.35 0.22 0.029* 0.78 0.68 4.5310 26 *Freshwater speciesTaxon only F 9.2(2,13) 0.77(2,24) 3.1(2,17) 5.5(3,34) 5.1(3,31) 14(3,40) 1.7(3,31) 4.2(2,12) 2.8(3,28) 3.3(2,11) 2.3(4, 112)Taxon only p 0.0032* 0.48 0.074* 0.0034* 0.0056* 2.80310 26 * 0.19 0.042* 0.06 0.077 0.061Taxon w/vol. W 3.2 1.6 2 2.4 13 0.57 3.1 1.1 1.2 5.2 35Taxon w/vol. p 0.075 0.22 0.17 0.088 1.50310 25 * 0.64 0.043* 0.38 0.35 0.028* 5.0310 26 *more steeply with volume than K. In contrast, sc<strong>al</strong>eduptake affinity tends to decrease with cell volume, <strong>al</strong>thoughstrong support for this relationship is present only formarine species. Among freshwater species, sc<strong>al</strong>ed P affinityshows no relationship with cell volume (Fig. 2C). Furthermore,<strong>al</strong>though the slopes for sc<strong>al</strong>ed N affinity cannot bedistinguished for freshwater and marine species, thefreshwater species occupy a limited range of volumes, andby themselves show no correlation with volume (Kend<strong>al</strong>lrank correlation 0.03, p 5 0.91; Fig. 2D). Sc<strong>al</strong>ed uptakeaffinity should be a more appropriate proxy for comp<strong>et</strong>itiveability under nutrient limitation, because it standardizesuptake ability by the nutrient requirement for growth. Thisis supported by our comparison of sc<strong>al</strong>ed uptake affinitieswith the outcome of P-limited chemostat experiments (WebAppendix, Table A2). Our results therefore support theexpectation that the ability to comp<strong>et</strong>e for limitingnutrients tends to decline with increasing cell volume(Chisholm 1992), <strong>al</strong>though this relationship may be weakeror nonexistent in freshwater habitats. These results are <strong>al</strong>soconsistent with a study of marine species that measuredsc<strong>al</strong>ed P affinity directly, as the biomass-specific P turnoverrate, and found that sc<strong>al</strong>ed P affinity declines withincreasing equiv<strong>al</strong>ent spheric<strong>al</strong> radius (Tambi <strong>et</strong> <strong>al</strong>. 2009).Maximum growth rate tends to decline with increasing cellvolume, consistent with prior results (Banse 1976; Chisholm1992). To our knowledge, this is the first study comprehensivelycomparing marine and freshwater species, and we findthat the <strong>al</strong>lom<strong>et</strong>ric slope is sh<strong>al</strong>lower for marine species(Table 1; Fig. 3). The consequence of this difference in slopesis that, on average, marine phytoplankton of a certain sizegrow faster than freshwater species of the same size, and thisdifference is greater as cell size increases (Fig. 3A). The<strong>al</strong>lom<strong>et</strong>ric slopes of m max for freshwater and marine species are20.36 and 20.24 respectively, and the slope when <strong>al</strong>l speciesare combined is 20.28 (Table 1). These slopes are steeperthan some previously reported slopes (Banse 1976; Tang1995), but this may be due to our use of SMA regression.Lines fit using ordinary least squares (OLS) have slopesbiased towards zero (Warton <strong>et</strong> <strong>al</strong>. 2006), and if we fit ourdata using OLS the slopes are 20.10 and 20.096 forfreshwater and marine species, respectively. Because <strong>al</strong>lom<strong>et</strong>ricexponents are used to param<strong>et</strong>erize ecosystem models(Irwin <strong>et</strong> <strong>al</strong>. 2006), and to test hypothesized mechanisms forsc<strong>al</strong>ing relationships (DeLong <strong>et</strong> <strong>al</strong>. 2010), we recommend theuse of SMA regression in comparative an<strong>al</strong>yses, as discussedin d<strong>et</strong>ail by Warton <strong>et</strong> <strong>al</strong>. (2006).In gener<strong>al</strong>, there are a number of limitations to ourcomparisons of freshwater and marine species. Thefreshwater species in our datas<strong>et</strong> cover a sm<strong>al</strong>ler range ofcell volumes, which may limit our ability to d<strong>et</strong>ect sc<strong>al</strong>ingrelationships and therefore obscure potenti<strong>al</strong> effects ofvolume on sc<strong>al</strong>ed uptake affinity. However, freshwaterphytoplankton may have a sm<strong>al</strong>ler cell size range comparedto marine phytoplankton in gener<strong>al</strong> (<strong>Litchman</strong> <strong>et</strong> <strong>al</strong>. 2009;Kamenir <strong>et</strong> <strong>al</strong>. 2010). In addition, the species in ourcompilation are those that phytoplankton ecologists havechosen to study in the lab, rather than a random or sizestructuredsample from natur<strong>al</strong> communities. Future workon trait–volume sc<strong>al</strong>ing relationships would benefit from a
Reviews in L&O 561Fig. 4. B<strong>et</strong>ween-taxon variation in primary nutrient traits for freshwater species. All variables are log 10 -transformed. For eachtaxon, mean trait v<strong>al</strong>ue and mean volume are plotted, 6 1 SE. The SMA fits from Fig. 1 are plotted as dotted lines. cyan, cyanobacteria;diat, diatoms; chlor, non-desmid chlorophytes; desm, desmids. (A) V N max , (B) KN , (C) Q N min , (D) V P max , (E) KP , (F) Q P min .more comprehensive sampling of natur<strong>al</strong> communities,including endpoints of the size spectrum, from picoplanktonto giant diatoms.B<strong>et</strong>ween-taxon differences—We find strong differencesb<strong>et</strong>ween taxa in average nutrient trait v<strong>al</strong>ues (Figs. 3–6;Table 2). At the same time, few b<strong>et</strong>ween-taxon differencesremain when controlling for cell volume (Table 2),indicating that taxonomic variation in nutrient utilizationtraits is largely driven by size variation. Considering rawtrait v<strong>al</strong>ues (not corrected for volume), among marinespecies differences in sc<strong>al</strong>ed uptake affinities suggest thatthe relatively sm<strong>al</strong>l haptophytes and prymnesiophytesshould be b<strong>et</strong>ter comp<strong>et</strong>itors under P limitation, whereasthe relatively large dinoflagellates and raphidophytesshould be poorer comp<strong>et</strong>itors (Fig. 7C). The same trendsoccur for sc<strong>al</strong>ed N affinity, <strong>al</strong>though there are no data forchlorophytes (Fig. 7D). Among freshwater species, thedata for sc<strong>al</strong>ed P affinity suggest that cyanobacteria tendto be b<strong>et</strong>ter comp<strong>et</strong>itors, whereas the desmids are poorcomp<strong>et</strong>itors, with diatoms and non-desmid chlorophytesin b<strong>et</strong>ween (Fig. 5C). There are fewer data for sc<strong>al</strong>edN affinity among freshwater species, but the presentpatterns suggest that cyanobacteria may be poorercomp<strong>et</strong>itors for nitrate (Fig. 5D); however, only twocyanobacteria are present in this an<strong>al</strong>ysis, and one ofthese species can fix nitrogen, which may compensate forlow nitrate affinity.There is significant variation in mean m max b<strong>et</strong>ween taxa(Table 2), with most variation due to the fact that amongmarine species, diatoms have high growth rates relativ<strong>et</strong>o their cell volume, whereas among freshwater species,cyanobacteria have low growth rates relative to their cellvolume (Fig. 3C,D). However, because of the relativelysm<strong>al</strong>l size of cyanobacteria cells, their raw growth rates arestill relatively high among freshwater species, on average(Fig. 3B).Q N min : Q P minratios—Our an<strong>al</strong>ysis of the structur<strong>al</strong> N : Pratio supports prior work showing broad variation in thisratio across phytoplankton (Rhee and Gotham 1980;<strong>Klausmeier</strong> <strong>et</strong> <strong>al</strong>. 2004). We <strong>al</strong>so find that Q N min : Q P min isgreater on average for freshwater species. If the evolutionof this ratio is driven by the relative availability of N and P,the difference b<strong>et</strong>ween habitats may be due to greaterprev<strong>al</strong>ence of P limitation in freshwater systems (Elser <strong>et</strong> <strong>al</strong>.2007). Alternatively, if the evolution of this ratio is drivenby <strong>al</strong>location to resource acquisition proteins vs. ribosomes(<strong>Klausmeier</strong> <strong>et</strong> <strong>al</strong>. 2004), higher ratios among freshwaterspecies may indicate a greater tendency for nutrient or lightlimitation in freshwater systems, and a greater tendency fornear-maxim<strong>al</strong> growth rates in marine systems (Goldman<strong>et</strong> <strong>al</strong>. 1979).Comparison of sc<strong>al</strong>ing exponents to theor<strong>et</strong>ic<strong>al</strong> predictions—Theobserved sc<strong>al</strong>ing exponents of nutrient utilization
562 Edwards <strong>et</strong> <strong>al</strong>.Fig. 5. B<strong>et</strong>ween-taxon variation in composite traits for freshwater species. All variables arelog 10 -transformed. For each taxon, mean trait v<strong>al</strong>ue and mean volume are plotted, 6 1 SE. TheSMA fits from Fig. 2 are plotted as dotted lines. cyan, cyanobacteria; diat, diatoms; chlor, nondesmidchlorophytes; desm, desmids. (A) P affinity, (B) N affinity, (C) sc<strong>al</strong>ed P affinity, (D)sc<strong>al</strong>ed N affinity.traits can be compared to those expected under amechanistic model of nutrient uptake (Aksnes and Egge1991). If V max is d<strong>et</strong>ermined by the number of uptake siteson the cell surface, and if the density of uptake sites doesnot vary with cell volume, then cell-specific maximumuptake rate should be proportion<strong>al</strong> to surface area. Forspheric<strong>al</strong> cells, this will result in a sc<strong>al</strong>ing exponent of 2/3for V max relative to cell volume. Although a prior an<strong>al</strong>ysisof nitrate traits in marine species found a sc<strong>al</strong>ing exponentconsistent with two-thirds sc<strong>al</strong>ing (<strong>Litchman</strong> <strong>et</strong> <strong>al</strong>. 2007),with the current, larger datas<strong>et</strong>, both V N max and V P max sc<strong>al</strong>emore steeply than 2/3 (95% confidence interv<strong>al</strong>s are [0.68,0.98] and [0.81, 1.1], respectively; Table 1). However, aninterspecific comparison has found that species withgreater cell volume tend to show greater deviation froma spheric<strong>al</strong> shape, and as a result the surface area : volumeratio declines with increasing cell volume, but it declinesmore slowly than expected for spheric<strong>al</strong> cells (Reynolds2006). Therefore, our results for the sc<strong>al</strong>ing of V max arenot inconsistent with a sc<strong>al</strong>ing relationship driven bysurface area.K appears to be less constrained by cell volume thaneither V max or Q min , and unlike these traits, K exhibitsdifferent sc<strong>al</strong>ing patterns for freshwater and marine species,with K P showing no correlation with volume for freshwaterspecies (Table 1; Fig. 1). Therefore, <strong>al</strong>though cell volumemay affect K by <strong>al</strong>tering the mass transfer coefficient(Aksnes and Egge 1991), our results suggest that otherfactors beyond cell volume strongly affect K.We hypothesized earlier (<strong>Litchman</strong> <strong>et</strong> <strong>al</strong>. 2007) that<strong>al</strong>lom<strong>et</strong>ric exponents for Q min may range from 2/3 to 1, ifwe assume that the minimum nutrient quota is contained inthe cytoplasm that occupies most of the cell volume insm<strong>al</strong>l cells (isom<strong>et</strong>ric sc<strong>al</strong>ing), or is distributed <strong>al</strong>ong the cellw<strong>al</strong>l in cells with large vacuoles (thus sc<strong>al</strong>es with cellsurface, 2/3 of volume). We are, however, unaware ofmechanistic predictions for wh<strong>et</strong>her Q min sc<strong>al</strong>ing exponentsshould be different for N and P. Intriguingly, Q N min sc<strong>al</strong>es<strong>al</strong>lom<strong>et</strong>ric<strong>al</strong>ly with volume (95% confidence interv<strong>al</strong> [0.76,0.94]; Table 1), whereas the sc<strong>al</strong>ing of Q P minis indistinguishablefrom isom<strong>et</strong>ric (95% confidence interv<strong>al</strong> [0.87,1.1]; Table 1). This <strong>al</strong>so implies that the ratio Q N min : Q P minmay decline as volume increases. In our datas<strong>et</strong>, this is truewhen marine and freshwater species are combined (Kend<strong>al</strong>lrank correlation: 20.28, p 5 0.013), <strong>al</strong>though not whenmarine and freshwater species are an<strong>al</strong>yzed separately(marine correlation 20.059, p 5 0.77; freshwater correlation20.25, p 5 0.14).The <strong>al</strong>lom<strong>et</strong>ric sc<strong>al</strong>ing of uptake affinities and sc<strong>al</strong>eduptake affinities are consistent with the sc<strong>al</strong>ing of the
Reviews in L&O 563Fig. 6. B<strong>et</strong>ween-taxon variation in primary nutrient traits for marine species. All variables are log 10 -transformed. For each taxon,mean trait v<strong>al</strong>ue and mean volume are plotted, 6 1 SE. The SMA fits from Fig. 1 are plotted as dotted lines. hapt, haptophytes; diat,diatoms; chlor, chlorophytes; dino, dinoflagellates; raph. raphidophytes. (A) V N max , (B) KN , (C) Q N min , (D) V P max , (E) KP , (F) Q P min .component param<strong>et</strong>ers V max , K, and Q min . V max tends toincrease more steeply with volume than K, resulting in anincrease in cell-specific uptake affinity with volume (Fig. 2).When uptake affinity is sc<strong>al</strong>ed by Q min , this results in adecrease in sc<strong>al</strong>ed uptake affinity with increasing volume,because the sc<strong>al</strong>ing exponents of V max and Q min tend to besimilar. The exception to this trend is sc<strong>al</strong>ed P affinity forfreshwater species, which does not decline with increasingvolume; this may be due to the fact that K P does not declinewith volume.Potenti<strong>al</strong> constraints among nutrient utilization traits—Araw correlation an<strong>al</strong>ysis reve<strong>al</strong>s a preponderance of positivecorrelations among nutrient traits (Table 3). These positivecorrelations may parti<strong>al</strong>ly constrain the evolution ofcomp<strong>et</strong>itive ability, because for a given nutrient, a positivecorrelation b<strong>et</strong>ween V max and K, or b<strong>et</strong>ween V max andQ min , constrains the evolution of equilibrium comp<strong>et</strong>itiveability, whereas a positive correlation b<strong>et</strong>ween K and Q minhas the opposite effect (<strong>Litchman</strong> <strong>et</strong> <strong>al</strong>. 2007). However, ifthese trait correlations are driven solely by cell size, thenthe only relevant constraints for trait evolution are thos<strong>et</strong>hat will constrain size evolution, i.e., the trait–volumesc<strong>al</strong>ing param<strong>et</strong>ers (<strong>Litchman</strong> <strong>et</strong> <strong>al</strong>. 2009). Our parti<strong>al</strong>correlation an<strong>al</strong>ysis, which tested for trait correlations aftercontrolling for the effect of cell volume, yielded equivoc<strong>al</strong>results. This an<strong>al</strong>ysis yielded only positive significantcorrelations b<strong>et</strong>ween nutrient traits, with the exception ofK P vs. K N for freshwater species, which is <strong>al</strong>so negative inthe raw correlation an<strong>al</strong>ysis (Table 3). Furthermore, thesignificant correlations occurred among pairs of traits thatwere strongly correlated in the raw correlation an<strong>al</strong>ysis(Table 3). It therefore seems possible that the parti<strong>al</strong>correlation an<strong>al</strong>ysis did not succeed in fully removing thecorrelated effect of volume on nutrient traits. Measurementerror for either nutrient traits or cell volume, <strong>al</strong>ong withplasticity in cell volume, will tend to add noise to the trait–volume relationship. This noise will prevent the parti<strong>al</strong>correlation from fully removing the true relationshipb<strong>et</strong>ween a trait and volume. The same considerations applyto the negative correlations b<strong>et</strong>ween m max and nutrienttraits (Table 3).However, some of the parti<strong>al</strong> correlations may indeedrepresent constraints, or correlated selection pressures. Thenegative correlation b<strong>et</strong>ween K P and K N among freshwaterspecies is unlikely to be driven by volume, and may contribut<strong>et</strong>o a trade-off in comp<strong>et</strong>itive ability for nitrate vs.phosphate among freshwater species. Among the positiveparti<strong>al</strong> correlations, nearly <strong>al</strong>l would constrain the evolutionof high sc<strong>al</strong>ed uptake affinity for a single nutrient(for marine species, V N max vs. Q N min , V P max vs. KP ; forfreshwater species, V N max vs. Q N min), or would constrain thesimultaneous evolution of high sc<strong>al</strong>ed uptake affinity forboth nutrients (for marine species, V N max vs. KP , V P max vs. KN ;for freshwater species, V N max vs. V P max , V P max vs. Q N min ).Therefore, these relationships may represent eco-evolutionary
564 Edwards <strong>et</strong> <strong>al</strong>.Fig. 7. B<strong>et</strong>ween-taxon variation in composite traits for marine species. All variables arelog 10 -transformed. For each taxon, mean trait v<strong>al</strong>ue and mean volume are plotted, 6 1 SE. TheSMA fits from Fig. 2 are plotted as dotted lines. hapt, haptophytes; diat, diatoms; chlor,chlorophytes; dino, dinoflagellates; raph, raphidophytes. (A) P affinity, (B) N affinity, (C) sc<strong>al</strong>edP affinity, (D) sc<strong>al</strong>ed N affinity.Table 3. Correlation matrices for b<strong>et</strong>ween-trait relationships. Entries in the upper right are for marine species, entries in the lowerleft are for freshwater species.V N max K N Q N minV P max K P Q P minm maxRaw Kend<strong>al</strong>l rank correlationsV N 0.28* 0.69** 0.6** 0.71** 0.54* 20.37*maxK N 0.27 0.53* 0.6** 0.52* 0.56* 20.27*Q N 0.66** 0.13 0.66** 0.69** 0.84** 20.61**minV P 0.43* 20.066 0.52* 0.59** 0.66** 20.22maxK P 20.14 20.45* 20.3 0.19 0.64** 20.14Q P 0.7** 20.037 0.55** 0.42** 20.0034 20.35minm max 20.029 20.16 20.22 20.2 20.032 20.2Parti<strong>al</strong> Kend<strong>al</strong>l rank correlations thatcontrol for cell volumeV N 0.086 0.45* 0.34 0.53* 0.072 20.12maxK N 0.18 0.032 0.37* 0.19 0.078 20.091Q N 0.57* 0.065 0.087 0.13 0.53* 20.35*minV P 0.39* 20.1 0.62** 0.31* 0.13 0.06maxK P 0.051 20.38* 20.0095 0.19 0.20 0.12Q P 0.62* 20.18 0.3 0.21 0.059 20.23minm max 0.024 20.12 20.25 20.2 20.027 20.042* p , 0.05, ** p , 0.001.
Reviews in L&O 565freshwater environments, highlighting the interaction ofphylogeny and environment<strong>al</strong> controls.AcknowledgmentsThis work was in part supported by Nation<strong>al</strong> ScienceFoundation grant 09-28819 to E.L. and C.A.K., 08-45932 toE.L., and a James S. McDonnell Foundation grant to C.A.K. andE.L. We thank Jonathan J. Cole and two anonymous reviewersfor helpful comments. This is Kellogg Biologic<strong>al</strong> Stationcontribution No. 1635.Fig. 8. Distribution of Q N min :Q P minmolar ratios. X-axis is ona log sc<strong>al</strong>e. (A) Freshwater species, (B) marine species.trade-offs among nutrient utilization traits. Edwards <strong>et</strong> <strong>al</strong>.(2011) used the same datas<strong>et</strong> to test for trade-offs amongsc<strong>al</strong>ed N affinity, sc<strong>al</strong>ed P affinity, and cell volume. Theyfound evidence for a gener<strong>al</strong> three-way trade-off among thes<strong>et</strong>hree traits, with the relationship b<strong>et</strong>ween sc<strong>al</strong>ed N affinityand sc<strong>al</strong>ed P affinity most evident in freshwater species, andthe relationship b<strong>et</strong>ween cell volume and the two nutrienttraits most evident in marine species.Our extensive compilation of nutrient utilization traits inmarine and freshwater phytoplankton shows that there arefundament<strong>al</strong> sc<strong>al</strong>ing relationships for most traits, and theserelationships are usu<strong>al</strong>ly shared by marine and freshwaterphytoplankton. However, there are some trait differencesthat possibly reflect different selective pressures b<strong>et</strong>weenmarine and freshwater environments, such as the relativestrength of limitation by different nutrients. Major taxadiffer in their nutrient utilization traits, reflecting contrastingecologic<strong>al</strong> strategies that are often driven by differencesin cell volume. Our data <strong>al</strong>so suggest that some taxa, suchas diatoms, may have different strategies in marine vs.ReferencesAKSNES, D. L., AND J. K. EGGE. 1991. A theor<strong>et</strong>ic<strong>al</strong> model fornutrient uptake in phytoplankton. Mar. Ecol. Prog. Ser. 70:65–72, doi:10.3354/meps070065BANSE, K. 1976. Rates of growth, respiration and photosynthesisof unicellular <strong>al</strong>gae as related to cell size—review. J. Phycol.12: 135–140.CHISHOLM, S. W. 1992. Phytoplankton size, p. 213–237. In P. G.F<strong>al</strong>kowski and A. D. Woodhead [eds.], Primary productivityand biogeochemic<strong>al</strong> cycles in the sea. Plenum.DELONG, J. P., J. G. OKIE, M.E.MOSES, R.M.SIBLY, AND J. H.BROWN. 2010. Shifts in m<strong>et</strong>abolic sc<strong>al</strong>ing, production, andefficiency across major evolutionary transitions. Proc. Natl.Acad. Sci. USA 107: 12941–12945, doi:10.1073/pnas.1007783107DILLON, P. J., AND F. H. RIGLER. 1974. Test of a simple nutrientbudg<strong>et</strong> model predicting phosphorus concentration in lake water.J. Fish. Res. Board Can. 31: 1771–1778, doi:10.1139/f74-225EDWARDS, K. F., C. A. KLAUSMEIER, AND E. LITCHMAN. 2011.Evidence for a three-way tradeoff b<strong>et</strong>ween nitrogen andphosphorus comp<strong>et</strong>itive abilities and cell size in phytoplankton.Ecology 92: 1085–1095.ELSER, J. J., AND OTHERS. 2007. Glob<strong>al</strong> an<strong>al</strong>ysis of nitrogen andphosphorus limitation of primary producers in freshwater,marine and terrestri<strong>al</strong> ecosystems. Ecol. L<strong>et</strong>t. 10: 1135–1142,doi:10.1111/j.1461-0248.2007.01113.xEPPLEY, R. W., J. N. ROGERS, AND J. J. MCCARTHY. 1969. H<strong>al</strong>fsaturationconstants for uptake of nitrate and ammonium bymarine phytoplankton. Limnol. Oceanogr. 14: 912–920,doi:10.4319/lo.1969.14.6.0912GOLDMAN, J. C., J. J. MCCARTHY, AND D. G. PEAVEY. 1979.Growth influence on the chemic<strong>al</strong> composition of phytoplanktonin oceanic waters. Nature 279: 210–215, doi:10.1038/279210a0GROVER, J. P. 1989. Influence of cell shape and size on <strong>al</strong>g<strong>al</strong>comp<strong>et</strong>itive ability. J. Phycol. 25: 402–405, doi:10.1111/j.1529-8817.1989.tb00138.x———. 1991. Dynamics of comp<strong>et</strong>ition among micro<strong>al</strong>gae invariable environments: Experiment<strong>al</strong> tests of <strong>al</strong>ternativemodels. Oikos 62: 231–243, doi:10.2307/3545269HEALEY, F. P. 1980. Slope of the monod equation as an indicatorof advantage in nutrient comp<strong>et</strong>ition. Microb. Ecol. 5:281–286, doi:10.1007/BF02020335HECKY, R. E., AND P. KILHAM. 1988. Nutrient limitation ofphytoplankton in freshwater and marine environments: Areview of recent evidence on the effects of enrichment. Limnol.Oceanogr. 33: 796–822, doi:10.4319/lo.1988.33.4_part_2.0796IRWIN, A. J., Z. V. FINKEL, O. M. E. SCHOFIELD, AND P. G.FALKOWSKI. 2006. Sc<strong>al</strong>ing-up from nutrient physiology to thesize-structure of phytoplankton communities. J. PlanktonRes. 28: 459–471, doi:10.1093/plankt/fbi148KAMENIR, Y., Z. DUBINSKY, AND R. HARRIS. 2010. Taxonomic sizestructure consistency of the English Channel phytoplankton. J. Exp.Mar. Biol. Ecol. 383: 105–110, doi:10.1016/j.jembe.2009.12.009
566 Edwards <strong>et</strong> <strong>al</strong>.KILHAM, P., AND R. E. HECKY. 1988. Comparative ecology ofmarine and freshwater phytoplankton. Limnol. Oceanogr. 33:776–795, doi:10.4319/lo.1988.33.4_part_2.0776KLAUSMEIER, C. A., E. LITCHMAN,T.DAUFRESNE, AND S. A. LEVIN.2004. Optim<strong>al</strong> nitrogen-to-phosphorus stoichiom<strong>et</strong>ry of phytoplankton.Nature 429: 171–174, doi:10.1038/nature02454LITCHMAN, E., AND C. A. KLAUSMEIER. 2008. Trait-based communityecology of phytoplankton. Annu. Rev. Ecol. Evol. Syst.39: 615–639, doi:10.1146/annurev.ecolsys.39.110707.173549———, ———, J. R. MILLER, O. M. SCHOFIELD, AND P. G.FALKOWSKI. 2006. Multi-nutrient, multi-group model ofpresent and future oceanic phytoplankton communities.Biogeosciences 3: 585–606, doi:10.5194/bg-3-585-2006———, ———, O. M. SCHOFIELD, AND P. G. FALKOWSKI. 2007. Therole of function<strong>al</strong> traits and trade-offs in structuring phytoplanktoncommunities: Sc<strong>al</strong>ing from cellular to ecosystem level.Ecol. L<strong>et</strong>t. 10: 1170–1181, doi:10.1111/j.1461-0248.2007.01117.x———, ———, AND K. YOSHIYAMA. 2009. Contrasting sizeevolution in marine and freshwater diatoms. Proc. Natl. Acad.Sci. USA 106: 2665–2670, doi:10.1073/pnas.0810891106MOREL, F. M. M. 1987. Kin<strong>et</strong>ics of nutrient uptake and growth inphytoplankton. J. Phycol. 23: 137–150.PTACNIK, R., S. DIEHL, AND S. BERGER. 2003. Performance ofsinking and nonsinking phytoplankton taxa in a gradient ofmixing depths. Limnol. Oceanogr. 48: 1903–1912, doi:10.4319/lo.2003.48.5.1903REYNOLDS, C. S. 2006. Ecology of phytoplankton. CambridgeUniv. Press.RHEE, G. Y., AND I. J. GOTHAM. 1980. Optimum N : P ratios andcoexistence of planktonic <strong>al</strong>gae. J. Phycol. 16: 486–489,doi:10.1111/j.1529-8817.1980.tb03065.xSHUTER, B. J. 1978. Size-dependence of phosphorus and nitrogensubsistence quotas in unicellular micro-organisms. Limnol.Oceanogr. 23: 1248–1255, doi:10.4319/lo.1978.23.6.1248SMAYDA, T. J. 1997. Harmful <strong>al</strong>g<strong>al</strong> blooms: Their ecophysiology andgener<strong>al</strong> relevance to phytoplankton blooms in the sea. Limnol.Oceanogr. 42: 1137–1153, doi:10.4319/lo.1997.42.5_part_2.1137STERNER, R., AND J. J. ELSER. 2002. Ecologic<strong>al</strong> stoichiom<strong>et</strong>ry.Princ<strong>et</strong>on Univ. Press.STOLTE, W., AND R. RIEGMAN. 1996. A model approach for sizeselectivecomp<strong>et</strong>ition of marine phytoplankton for fluctuatingnitrate and ammonium. J. Phycol. 32: 732–740, doi:10.1111/j.0022-3646.1996.00732.xTAMBI, H., G. A. F. FLATEN, J. K. EGGE, G. BODTKER, A.JACOBSEN, AND T. F. THINGSTAD. 2009. Relationship b<strong>et</strong>weenphosphate affinities and cell size and shape in various bacteriaand phytoplankton. Aquat. Microb. Ecol. 57: 311–320,doi:10.3354/ame01369TANG, E. P. Y. 1995. The <strong>al</strong>lom<strong>et</strong>ry of <strong>al</strong>g<strong>al</strong> growth rates. J.Plankton Res. 17: 1325–1335, doi:10.1093/plankt/17.6.1325TILMAN, D. 1982. Resource comp<strong>et</strong>ition and community structure.Princ<strong>et</strong>on Univ. Press.WARTON, D. I., AND J. ORMEROD. 2007. smatr: (Standardised)major axis estimation and testing routines. R packageversion 2.1. Available from http://web.maths.unsw.edu.au/,dwarton———, I. J. WRIGHT, D.S.FALSTER, AND M. WESTOBY. 2006.Bivariate line-fitting m<strong>et</strong>hods for <strong>al</strong>lom<strong>et</strong>ry. Biol. Rev. 81:259–291, doi:10.1017/S1464793106007007Associate editor: Jonathan J. ColeReceived: 04 October 2011Accepted: 03 January 2012Amended: 20 January 2012