annual report 2011/12 - Manitoba Agricultural Services Corporation
annual report 2011/12 - Manitoba Agricultural Services Corporation
annual report 2011/12 - Manitoba Agricultural Services Corporation
- No tags were found...

Create successful ePaper yourself
Turn your PDF publications into a flip-book with our unique Google optimized e-Paper software.
<strong>2011</strong>/<strong>12</strong>Annual ReportLENDING AND INSURANCE - BUILDING A STRONG RURAL MANITOBA
Table of ContentsTransmittal Letters......................................................................................................................................................... 2Chair’s Message.............................................................................................................................................................. 4Vision / Mission / Values / Goals.................................................................................................................................. 6Corporate Governance.................................................................................................................................................. 7Administration............................................................................................................................................................... 8Organization Chart........................................................................................................................................................ 8Strategic Plan Review..................................................................................................................................................... 9Performance Indicators...............................................................................................................................................<strong>12</strong>Current Programs........................................................................................................................................................ 13Insurance................................................................................................................................................................13Lending................................................................................................................................................................... 19Other Initiatives.....................................................................................................................................................23Financial Statements.................................................................................................................................................... 27Responsibility for Financial Statements...............................................................................................................28Auditor’s Report.....................................................................................................................................................29Statement of Financial Position............................................................................................................................31Statement of Operations........................................................................................................................................ 32Statement of Change in Net Financial Assets.......................................................................................................33Statement of Cash Flows.......................................................................................................................................34Notes to Financial Statements............................................................................................................................... 35Schedule 1: Schedule of Administrative Expenses...............................................................................................57Schedule 2: Schedule of Operations and Accumulated Surplus.........................................................................58Office Locations....................................................................................................................................................................60Board of DirectorsJohn Plohman (Chair)Frieda Krpan (Vice Chair)Harry Sotas (Vice Chair)Bryan FerrissFrank FiarchukWilfred HarderCarol MasseSandy YanickExecutive ManagementNeil Hamilton – President & CEOPaul Bonnet – Vice President, Research & Program DevelopmentKevin Craig – Vice President, Lending OperationsJim Lewis – Vice President, Finance & AdministrationCraig Thomson – Vice President, Insurance OperationsLester Vopni – Vice President, Corporate <strong>Services</strong> & General CounselThis <strong>annual</strong> <strong>report</strong> can be found online at masc.mb.ca.La version française de ce rapport annuel se trouve sur le site Internet masc.mb.ca.<strong>2011</strong>/<strong>12</strong> Annual Report 1
The Honourable Philip S. Lee, C.M., O.M.Lieutenant-Governor of <strong>Manitoba</strong>235 Legislative BuildingWinnipeg, <strong>Manitoba</strong>R3C 0V8Your Honour:I am pleased to submit the Annual Report of the <strong>Manitoba</strong> <strong>Agricultural</strong> <strong>Services</strong> <strong>Corporation</strong> for the fiscal year endedMarch 31, 20<strong>12</strong>.Yours truly,Original signed byRon KostyshynMinister2<strong>Manitoba</strong> <strong>Agricultural</strong> <strong>Services</strong> <strong>Corporation</strong>
The Honourable Ron KostyshynMinister of Agriculture, Food and Rural Initiatives165 Legislative BuildingWinnipeg, <strong>Manitoba</strong>R3C 0V8Dear Sir:On behalf of the Board of Directors, I am pleased to submit the Annual Report of the <strong>Manitoba</strong> <strong>Agricultural</strong> <strong>Services</strong><strong>Corporation</strong> for the fiscal year ended March 31, 20<strong>12</strong>.Yours truly,Original signed byJohn S. PlohmanChair, Board of Directors<strong>2011</strong>/<strong>12</strong> Annual Report 3
Chair’s MessageThere can be no doubt that <strong>2011</strong> was one of the most challenging years in MASC’s long history. Flooding, excessmoisture and drought saw <strong>Manitoba</strong>’s farmers and rural communities facing the perils of nature in nearly every partof the province. Along with the high level of activity in its regular programming, MASC was assigned by the <strong>Manitoba</strong>Government the significant task of administering its response to the 300-year flood event of the Assiniboine River.True to its motto of ‘Building a Strong Rural <strong>Manitoba</strong>’,MASC accepted these increased duties in stride, managingthe support for rural <strong>Manitoba</strong>ns with commendabletimeliness and professionalism.<strong>2011</strong> in <strong>Manitoba</strong> began as a year of unsure footing andflooded foundations. Heavy rains loomed over muchof the province the previous fall, followed by heavywinter snowfalls in <strong>Manitoba</strong> and Saskatchewan alongthe Assiniboine River basin, and finally a wet spring, allcontributing to a waterlogged beginning to the year. Arecord 2.9 million insured acres went unseeded due toexcess moisture, with many more acres threatened bycontinued inundation.Many farmers wisely topped up their AgriInsurance coverage,insuring a record 9.6 million acres ($1.7 billion in liability).The combination of record enrolment and the year’s wetconditions led to the largest Excess Moisture Insurancepayout in MASC’s history, putting over $162 millioninto the hands of producers who experienced losses.Fortunately, hail was a much lesser concern for farmersin <strong>2011</strong>, with relatively few hail storms occurring acrossthe province. The Hail Insurance Program protected3.5 million acres ($493 million in liability), with a lossto premium ratio of only 28%, one of the lowest inthe program’s history. A total of 2,500 acres qualifiedas Canadian Foodgrains Bank projects, for which theassociated hail insurance premiums were waived. Weapplaud and continue to support this humanitarian effort.MASC’s continued support of rural <strong>Manitoba</strong> was also seenthrough adjustments to our lending programs. MASC keptpace with increasing land values by increasing the lendinglimits. MASC’s Direct Loan activity increased to one ofthe highest levels in recent years, resulting in a combinedloan and guarantee portfolio of $642 million. And withthe confidence of rural borrowers, MASC is finalizingpreparations for a further expansion of its lending mandatein 20<strong>12</strong>.Even with the support provided to rural <strong>Manitoba</strong> byMASC’s core programs, it soon became apparent thatadditional compensation would be required for thoseaffected by the flooding of the Assiniboine River. Asthe flood waters rose to record levels, the <strong>Manitoba</strong>Government looked to MASC to administer a host ofemergency assistance programs.MASC’s Flood Recovery Office opened its doors inMay <strong>2011</strong> for the purpose of administering the variouscomponents of the <strong>Manitoba</strong> Government’s Flood <strong>2011</strong>–Building and Recovery Action Plan. Handling flood issuesfor the Hoop and Holler Bend and areas surroundingLake <strong>Manitoba</strong>, Lake Dauphin and Shoal Lakes, theFlood Recovery Office continues to operate in 20<strong>12</strong>. As ofMarch 31, 20<strong>12</strong>, a total of $56.4 million had been paid toclaimants.In addition to the Flood Recovery Office, furtheradministrative support was required to deliver financialassistance to <strong>Manitoba</strong> farmers through the <strong>2011</strong>AgriRecovery Programs. This series of programs, whichwere designed to mitigate the impacts of excess moistureand flooding by providing additional funds to restore andrehabilitate farm operations, was delivered jointly with<strong>Manitoba</strong> Agriculture, Food and Rural Initiatives. A totalof $119 million had been paid to affected producers as ofMarch 31, 20<strong>12</strong>.Although these emergency assistance programs providedmuch needed support to the rural farms and ruralcommunities of <strong>Manitoba</strong>, they also impacted in a verysignificant way, the day-to-day workflow of MASC’s staff.Many MASC staff were re-assigned from their regular jobduties to work alongside new staff at the Flood RecoveryOffice, while others throughout the corporation carried outadditional duties in order to facilitate the administration ofthe flood programs. I would like to take this opportunity toapplaud and thank them all for their tireless efforts.4<strong>Manitoba</strong> <strong>Agricultural</strong> SeRVICes <strong>Corporation</strong>
VisionA strong rural economy with successful farms and businessesMissionEnhance financial stability in rural <strong>Manitoba</strong> by providing risk management solutions, lending options and otherprograms and services to address emerging needsValues• Innovation − in developing programs and services• Responsiveness − in program delivery• Excellence − in customer service• Consultation − with client and government stakeholders• Accountability − in managing public funds• Social Responsibility − in balancing public policy and business objectives• Employees − in a productive and positive work environmentGoals• Insurance − provide programs that mitigate risk for the majority of farmers• Lending − assist farming and other rural businesses in accessing credit• Other Programs and <strong>Services</strong> − deliver emergency assistance, other initiatives that align withgovernment priorities and inspection services• Corporate − carry on business effectively and efficiently6<strong>Manitoba</strong> <strong>Agricultural</strong> SeRVICes <strong>Corporation</strong>
Corporate GovernanceMandate of the BoardMASC was established through the introduction of The <strong>Manitoba</strong> <strong>Agricultural</strong> <strong>Services</strong> <strong>Corporation</strong> Act, and is a Crowncorporation of the <strong>Manitoba</strong> Government. MASC’s Board of Directors is comprised of up to nine directors who areappointed by the Lieutenant-Governor in Council, as are the Board chair and the two vice chairs.The Board is responsible for the overall stewardship of MASC, discharging its responsibilities either directly or throughthe assistance of three sub-committees. The Board sets MASC’s strategic direction and organizational objectives with theassistance of Executive Management, and provides final approval of all applicable budgets.The Board also makes recommendations for future programming to the Minister of Agriculture, Food and Rural Initiatives,ensures that the corporate governance policies by which MASC operates are relevant and current, and is responsible foroverseeing and monitoring corporate operations according to applicable legislative requirements and with acceptable levelsof risk.Board Committee StructureThe Board of Directors is assisted by the work of the following committees:Board Planning and Priorities Committee acts in place of the Board on matters requiring immediate action, andreviews policies as required prior to Board consideration;Board Audit and Finance Committee reviews MASC’s financial <strong>report</strong>ing, risk management, actuarial and auditfunctions, as well as monitors corporate integrity and compliance with applicable authorities; andBoard Producer Relations Committee assists the Board with interactions and communications with producers andproducer groups.<strong>2011</strong>/<strong>12</strong> Annual Report 7
AdministrationMASC has a permanent staff of 153, complemented by part-time staff and over 150 adjustors who are employed as needed.MASC is represented by 19 insurance and 15 lending offices located across the province, with corporate offices inPortage la Prairie and Brandon.MASC <strong>report</strong>s to the Minister of Agriculture, Food and Rural Initiatives (MAFRI), with the province’s contribution toMASC’s regular programming representing over 40% of MAFRI’s budget.An independent three-member Appeal Tribunal hears disputes between insured producers and MASC respecting MASC’sassessment of insurance loss. The Appeal Tribunal’s decisions are final and binding on both parties.With direction from the <strong>Manitoba</strong> Government’s initiatives under The Sustainable Development Act, MASC encourages andfacilitates day-to-day ‘green’ business practices that conserve our natural resources. MASC actively promotes teleconferencingand videoconferencing, and has significantly reduced its printed materials by replacing most internal paper manuals withdigital versions. MASC is also increasing the opportunities for producers to use paperless web-based transactions, such as<strong>report</strong>ing their harvested production and carryover grain through MASC’s Online <strong>Services</strong> and opting for a digital version ofthe AgriInsurance contract.MASC has established the Flood Recovery Office in Portage la Prairie to handle matters concerning the Flood <strong>2011</strong> –Building and Recovery Action Plan. As of March 31, 20<strong>12</strong>, over 40 staff operate out of the Flood Recovery Office, includingseveral MAFRI staff who are on secondment and a number of adjustors and appraisers contracted from private firms. TheFlood <strong>2011</strong> Appeals Commission has been appointed to hear appeals relating to <strong>2011</strong> flood programming.Organization ChartAs of March 31, 20<strong>12</strong>:MINISTER OF AGRICULTURE,FOOD & RURAL INITIATIVESBOARD OF DIRECTORSPRESIDENT & CHIEF EXECUTIVE OFFICERNEIL HAMILTONVice President,Insurance operationsCRAIG THOMSONVice President, Research &Program DevelopmentPaul BonnetVice President,FINANCE & ADMINISTRATIONJIM LEWISVice President, CORPORATESERVICES & GENERAL COUNSELLESTER VOPNIVice President,LENDING OPERATIONSKEVIN CRAIGINSURANCE PROJECTS,SALES & SERVICEPREMIUM RATES,COVERAGES &FORECASTINGFINANCIAL SERVICESRISK MANAGEMENTLENDING PROGRAMSCLAIM SERVICESPROGRAMDEVELOPMENTHUMAN RESOURCESCOMMUNICATIONS& PLANNINGGUARANTEEPROGRAMSFARMLAND SCHOOLTAX REBATEAGRONOMYRESEARCH & ADVICEADMINISTRATIVESERVICESINTERNAL AUDITLOANADMINISTRATIONINSPECTION SERVICESINFORMATIONTECHNOLOGY SERVICESFLOOD RECOVERYOFFICE8<strong>Manitoba</strong> <strong>Agricultural</strong> SeRVICes <strong>Corporation</strong>
Strategic Plan ReviewMASC’s vision of a strong rural <strong>Manitoba</strong> is achieved through a series of focused goals, as identified in its Strategic Plan.The following is a review of the associated actions implemented in <strong>2011</strong>/<strong>12</strong>, along with the progress towards MASC’sgoals. The actions identified are considered to be new initiatives and are incremental to MASC’s ongoing day-to-dayoperations and to the administration of emergency assistance programming.Goal: Insurance – provide programsthat mitigate risk for the majority offarmers• Due to rising input costs, AgriInsurance will be offeringan additional $15 per acre option in 20<strong>12</strong>, bringing thetotal available coverage for Excess Moisture Insuranceto $80 per acre.• The dollar coverage for Forage Establishment Insuranceand the Forage Restoration Benefit will be increasing in20<strong>12</strong>, providing more coverage to forage producers.• Under the new Overwinter Bee Mortality Insuranceprogram, which provided protection against overwinterbee losses starting in the winter of <strong>2011</strong>/<strong>12</strong>, 44<strong>Manitoba</strong> beekeepers insured 29,200 colonies for totalinsured liability of $3.0 million.• Manure Management Loans were introduced to providefinancing for projects approved under MAFRI’s ManureManagement Financial Assistance Program. Thisinitiative provides financing to eligible hog producers inorder to assist with construction costs associated withmanure storage, as well as construction of new manuretreatment projects.• MASC staff made 22 presentations across <strong>Manitoba</strong>to producers, producer groups and rural lenders toenhance awareness of MASC’s loan and guaranteeprograms. An additional 25 presentations were madespecifically promoting MASC’s new Operating CreditGuarantee for Rural Small Business.• Work continues with Agriculture and Agri-FoodCanada and other provinces to finalize guidelines forlivestock insurance proposals.• A premium replacement provision for theAgriInsurance reinsurance program was negotiated for20<strong>12</strong>, which will reduce the program’s loss in the eventof a large unseeded acreage component such as the onethat occurred in <strong>2011</strong>. This feature will assist in thefinancial sustainability of the AgriInsurance Program,thereby protecting future programming.Goal: Lending – assist farming andother rural businesses in accessing credit• An in-depth strategic review of MASC’s lendingprograms led to the approval of a new lending mandate,which will raise lending limits and remove certaineligibility criteria for new and existing borrowers. Thiswill allow more <strong>Manitoba</strong> producers access to MASCloans starting in 20<strong>12</strong>.<strong>2011</strong>/<strong>12</strong> Annual Report 9
Goal: Other Programs and <strong>Services</strong> –deliver emergency assistance, otherinitiatives that align with governmentpriorities and inspection services• In response to unprecedented water levels in westernand central <strong>Manitoba</strong> in the spring of <strong>2011</strong>, a numberof emergency assistance programs were developed. Aspecial unit of MASC, operating as the Flood RecoveryOffice, was established to deliver compensation, withthe assistance of MAFRI, for the Flood <strong>2011</strong> – Buildingand Recovery Action Plan and the <strong>2011</strong> AgriRecoveryProgram. A total of 11 emergency assistance programsinvolving MASC administration were offered, withsome of these programs continuing into 20<strong>12</strong>.• Administration of the 2010 Canada-<strong>Manitoba</strong> Feedand Transportation Assistance Program and the2010 Assiniboine Valley Producers Flood AssistanceProgram was completed.• Compensation under the Wildlife DamageCompensation Program was increased from 80% to90%, effective April 1, <strong>2011</strong>.• Inspection services were expanded to include assessingcrop damage associated with the construction of a windfarm.Goal: Corporate – carry on businesseffectively and efficiently• Two focus group meetings were held with producersto seek input on the future direction of MASC’sOnline <strong>Services</strong>. Enhancements that make it easier forproducers to complete their paperwork are ongoing,with the ability to file Seeded Acreage Reports onlinebeing new for 20<strong>12</strong>. In addition, producers cancomplete their Harvested Production Reports, declaretheir carry-over grain, apply for hail insurance, trackthe status of their claims, and access a number of theirinsurance and billing statements online.• Cross-training between insurance and lending field staffoccurred during the year, enabling field staff to providea higher level of customer service for clients on all ofMASC programs.• Enhancements were made to MASC’s website to allowusers of mobile devices better viewing capacity. Visitorsto the website via this medium increased substantially,with mobile devices now representing 3% of all MASCwebsite traffic.• A succession planning process was initiated forhigher level positions. Corporate core competencieswere established and the identification of potentialcandidates has commenced.10<strong>Manitoba</strong> <strong>Agricultural</strong> SeRVICes <strong>Corporation</strong>
• Progress on MASC’s corporate-wide workplaceDiversity Strategy continued, with the establishmentof a policy that sets out specific initiatives and goals toenhance staff diversity at MASC.• MASC’s Geographic Information System was enhancedto provide spatial information such as unseeded land,percentage hail losses and crop yields, which are usedto enhance the <strong>report</strong>ing of losses and to verify claimsmade through producer declarations.• A computerized grain bin information database hasbeen implemented, reducing data inputting time andimproving the accuracy of bin calculations for postharvestclaims that are completed by adjustors usinglaptop computers.• The claim tracking process for post-harvest interimpayments was improved, providing better monitoringof claim adjustments.• A new risk rating model for loans has been developed,which will increase the level of assessment and reducethe turnaround time for loan approvals.• Processes have been automated in order to reduce theamount of printed material: single-copy forms for anumber of insurance <strong>report</strong>s are in place, and producerscan now opt to download an electronic version of theAgriInsurance contract rather than having a printedcopy mailed out. A number of internal lending formshave also been automated to increase processingefficiencies and reduce the amount of paper used.• The <strong>annual</strong> loan activity statement was modified toimprove readability for clients.• MASC’s Board of Directors and staff met with 15producer groups for the purpose of assessing howprograms and services can be improved. Suggestionsmade at these meetings are very valuable and will beconsidered in future programming.<strong>2011</strong>/<strong>12</strong> Annual Report 11
Performance IndicatorsAgriInsuranceJust under 6.7 million acres of <strong>annual</strong> crops and forageswere insured in <strong>2011</strong>/<strong>12</strong>, which was about 2.6 million acresbelow the targeted amount. The decrease was due to over2.9 million acres that could not be seeded as a result of excessmoisture. Total AgriInsurance liability was $1.72 billion,roughly the same as in 2010/11, though significantlybelow the $2.05 billion that was budgeted, again due tothe unseeded acreage. The average insured coverage levelincreased from 76.4% to 77.3%, exceeding the 76.5% thatwas targeted.Indemnities totalled $326.9 million, significantly abovethe breakeven budgeted amount of $178.5 million. Out ofthe $326.9 million, $162.3 million was for Excess MoistureInsurance claims, with the balance due to damage to seededcrops. The number of claims totalled 14,130 (14% higherthan budgeted), with more than 5,800 of that number beingExcess Moisture Insurance claims. The average indemnityper claim was 61% higher than budgeted.Hail InsuranceHail Insurance participation was 3.5 million acres, withliability of $493 million (down from 4.3 million acres and$596 million of liability in 2010/11, and significantly belowthe targets of 4.6 million acres and $640 million of liability).This decline is attributed to the significant acreage thatcould not be seeded due to excess moisture in <strong>2011</strong>.Hail losses for the year were $4.8 million, which wasconsiderably below the breakeven budgeted amount of$17.1 million.LoansMASC approved 852 loans in <strong>2011</strong>/<strong>12</strong> totalling$107.7 million. The number of loans increased by 145compared to 2010/11, with the associated dollar amountbeing $30.1 million (39%) higher. The target for the yearwas 766 loans totalling $82.4 million. The increase inagricultural lending is attributed to increased profitabilityin the sector.Loan GuaranteesMASC approved 195 guarantees in <strong>2011</strong>/<strong>12</strong> on loanstotalling $79.4 million. Compared to 2010/11, the numberof guarantees and the dollar amount of the associated loansdecreased by 51 and $15.5 million, respectively. The targetfor the year was 276 guarantees on loans totalling$92.3 million. Improved farm profitability in <strong>2011</strong>/<strong>12</strong>resulted in fewer requests by lending institutions for loanguarantees.AdministrationMASC’s <strong>2011</strong>/<strong>12</strong> administrative expenses for its regularprogramming totalled $17.4 million, roughly $3.6 millionunder budget. The variance was mainly due to allocationsto emergency assistance programs for staff time andoverhead relating to these programs, lower than expectednumbers of adjusted AgriInsurance and Hail Insuranceclaims, and other expenditures that were either postponedor cancelled.<strong>12</strong><strong>Manitoba</strong> <strong>Agricultural</strong> SeRVICes <strong>Corporation</strong>
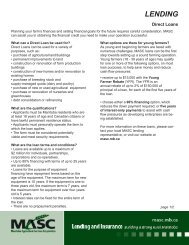
expected grazing period and the number of animal unitson pasture). In <strong>2011</strong>, 48 producers enrolled in the pilotprogram, with roughly 13,650 head of livestock (61,300acres of pasture) being covered for a total liability of$1.6 million.Insurance is available for the establishment of eligibleforage crops. Spot-loss compensation is provided when acrop fails to establish in the year of seeding due to naturalperils.Vegetable Acreage Loss Insurance provides commercialvegetable producers with protection against crop losses thatare severe enough to warrant working down all or part ofthe crop.Commercial strawberry and saskatoon growers are able toprotect themselves against losses during the establishmentperiod. Growers are eligible for compensation when plantlosses exceed 20% of the total stand.The Overwinter Bee Mortality Insurance Program, whichwas introduced in <strong>2011</strong>/<strong>12</strong>, enables commercial beekeepersto insure their honeybee colonies against unmanageableoverwinter losses. In <strong>2011</strong>, 44 beekeepers with 29,200colonies enrolled for a total liability of $3.1 million.For insurance purposes, MASC divides the Province of<strong>Manitoba</strong> into 15 areas of similar crop protection risk.These ‘risk areas’ form the geographic basis for determininginsurance coverages (liabilities) and premiums formost crops. The probable yield methodologies used todetermine coverages are individualized, and dependingon the crop, are based either on a producer’s relative yieldhistory (compared to the area average), or the producer’sindividual yield history.<strong>2011</strong> Crop YearThe <strong>2011</strong>/<strong>12</strong> growing season presented <strong>Manitoba</strong>’sproducers with considerable challenges including floodingfrom rivers and lakes, excess moisture, and even droughtconditions. Many fields entered the spring already saturatedby heavy rains during the previous fall. Over eight inchesof rain fell across much of <strong>Manitoba</strong> from August toNovember of 2010. Higher than normal rainfall andcooler than normal temperatures occurred in the springof <strong>2011</strong>, resulting in late seeding or no seeding in manycases. Waterlogged fields resulted in a record 2.9 millioninsured acres not being seeded. The areas surroundingLake <strong>Manitoba</strong>, the Parkland and the Southwest were thehardest hit.Weather conditions changed drastically in late June, withhot dry conditions continuing through September. Duringthis time, very few severe thunderstorms were experienced,with hail damage being substantially below average. Headinginto winter, the dry conditions continued with below normalamounts of precipitation from October to December.Poor early season growing conditions delayed seedemergence and plant development, resulting in delayedharvesting for some crops. Harvesting conditions weregenerally favorable, with the first killing frost occurring inmid-September. For most crops, provincial average yieldswere below average for <strong>2011</strong>. The exceptions were the heatlovingcrops (corn, dry edible beans and sunflowers), forwhich yields were above average.Figure 1 shows the major causes of loss for all crops in<strong>2011</strong>/<strong>12</strong>, compared to the historical average. In <strong>2011</strong>/<strong>12</strong>,excess moisture and drought/heat accounted for 73% and25% of the losses, respectively.For most AgriInsurance programs, premiums are paid 40%by insured producers, 36% by the Government of Canadaand 24% by the <strong>Manitoba</strong> Government. The exceptionis the EMI Zero Deductible Option premium, which ispaid entirely by participating producers. Administrativeexpenses for the AgriInsurance Program are shared 60% byCanada and 40% by <strong>Manitoba</strong>.14<strong>Manitoba</strong> <strong>Agricultural</strong> SeRVICes <strong>Corporation</strong>
Figure 1 – AgriInsurance Causes of LossCauses of Loss <strong>2011</strong>/<strong>12</strong>Figure 2 – AgriInsurance Premiums and Indemnities($ millions)Historical Causes of Loss (1966 to 2010)Excess Moisture (73%)Drought & Heat (25%)Hail (1%)Other (1%)350.0300.0250.0200.0150.0100.050.002007/08 2008/09 2009/10 2010/11 <strong>2011</strong>/<strong>12</strong>Excess Moisture (39%)Drought & Heat (35%)Frost (10%)Hail (7%)Disease (2%)Wind (1%)Other (6%)In summary, a total of 9.6 million acres were protected byAgriInsurance in <strong>2011</strong>/<strong>12</strong>, with 6.7 million seeded acresand 2.9 million unseeded acres (due to excess moisture).Total premiums were $168.8 million on $1.72 billion ofcoverage (liability). Indemnity payments for the yeartotalled $326.9 million, of which $162 million was paidout for Excess Moisture Insurance claims. Figure 2 showshow <strong>2011</strong>/<strong>12</strong> premiums and indemnities compare to theprevious four years. After accounting for interest revenueof $2.4 million, reinsurance premiums of $40.1 millionand prior year premium adjustments of $0.5 million,AgriInsurance had a net loss of $196.3 million for<strong>2011</strong>/<strong>12</strong>. The net loss resulted in the AgriInsurance reservedecreasing from $271.7 million to $75.4 million.PremiumsIndemnitiesLarge fluctuations in reserve levels are normal inAgriInsurance. When the surplus is high, a negative surplusload reduces premium rates and when the surplus is low, apositive surplus load increases premium rates. Normally,the reserve plus premium income and the additionalprotection provided by the purchase of private reinsurance,is sufficient to deal with the expected loss for the year. Withback-to-back losses in 2010/11 and <strong>2011</strong>/<strong>12</strong>, the federalprovincialreinsurance program may be required to providedeficit financing should another loss be experienced in20<strong>12</strong>/13.The AgriInsurance loss ratio (loss as a percentage of totalpremium) was 194% for <strong>2011</strong>/<strong>12</strong>. Loss ratios for individualcrops are listed in Table 1.<strong>2011</strong>/<strong>12</strong> Annual Report 15
Table 1: Summary of <strong>2011</strong>/<strong>12</strong> AgriInsuranceCrop Acres Insured Coverage (000) Total Premium (000) Indemnities (000) Loss Ratio (%)Red Spring Wheat 1,690,520 $346,446.7 $27,940.2 $30,037.4 108Durum Wheat 273 45.8 4.0 33.8 845Extra Strong Wheat 1,164 252.8 30.0 1.9 6Prairie Spring Wheat 2,037 381.9 51.6 79.5 154Hard White Wheat 14,772 2,976.4 215.7 3<strong>12</strong>.5 145Feed Wheat 26,709 3,617.5 452.2 477.1 106Winter Wheat 181,386 36,090.8 3,6<strong>12</strong>.4 3,364.2 93Barley 230,046 37,010.7 3,417.8 <strong>12</strong>,190.0 357Oats 398,496 78,831.0 7,776.9 15,483.8 199Mixed Grain 996 90.0 13.6 29.6 218Fall Rye 38,695 4,921.8 569.7 1,090.9 192Triticale 27 2.9 0.5 0.5 100Canola 2,528,284 659,287.5 56,270.9 70,948.6 <strong>12</strong>6Rapeseed 11,695 3,216.8 259.5 629.8 243Flax 83,482 18,250.3 2,068.9 5,073.8 245Mustard 1,137 146.2 30.9 110.1 356Oil Sunflowers 14,616 3,093.1 414.0 413.3 100Non Oil Sunflowers 19,207 6,094.9 1,081.7 589.7 55Buckwheat 2,639 294.7 73.5 78.5 107Grain Corn 170,487 47,439.9 9,422.8 1,685.7 18Silage Corn 32,309 9,237.6 679.4 1,151.3 170Potatoes 57,401 106,245.7 5,843.7 2,268.7 39Vegetables 1 1,535 4,4<strong>12</strong>.7 205.6 258.3 <strong>12</strong>6Field Peas 18,996 3,030.0 320.9 772.5 241Lentils 881 158.2 38.7 31.9 82Fababeans 1,986 330.1 66.2 135.2 204Dry Edible Beans 2 47,379 16,5<strong>12</strong>.5 2,540.8 519.6 21Soybeans 545,873 114,780.2 19,7<strong>12</strong>.7 7,222.9 37Tame Hay 3 263,066 23,<strong>12</strong>0.8 2,393.3 1,069.6 45Pasture - 1,781.2 205.8 49.0 24Pasture Days Pilot Program - 1,599.6 35.2 <strong>12</strong>1.0 344Native Hay 19,629 641.7 207.2 370.8 179Forage Establishment 37,876 2,037.6 363.0 185.3 51Strawberry Establishment - 23.6 1.4 - 0Saskatoon Establishment - 9.8 0.5 0.7 140Pedigreed Timothy Seed 11,277 1,257.7 238.1 44.0 19Alfalfa Seed <strong>12</strong>,302 2,956.0 733.6 271.1 37Canaryseed 9,762 1,896.8 289.5 732.1 253Annual Ryegrass Seed 1,147 209.5 32.2 19.0 59Perennial Ryegrass Seed 22,911 5,876.2 875.5 190.8 22Proso Millet Seed 1,676 214.8 44.9 - 0Tall Fescue Seed 1,888 3<strong>12</strong>.3 86.1 31.7 37Hemp Grain 2,753 498.3 81.8 101.2 <strong>12</strong>4Greenfeed 172,013 <strong>12</strong>,138.5 2,529.2 2,147.0 85Open Pollinated Corn 89 9.1 1.9 6.0 316Overwinter Bee Mortality - 3,057.6 238.4 - 0Estimate of Incomplete Claims - - - 4,275.3 -Subtotal 6,679,417 $1,560,839.8 $151,472.4 $164,605.7 109Excess Moisture Insurance 4 2,948,445 162,329.0 17,355.1 162,329.0 935Total 9,627,862 $1,723,168.8 $168,827.5 $326,934.7 1941 Vegetables include carrots, cooking onions, rutabagas, parsnips and Vegetable Acreage Loss Insurance.2 Dry edible beans includes white pea, pinto, black, kidney, cranberry, small red and other dry edible beans.3 Tame hay includes alfalfa, alfalfa /grass mixtures, grasses and sweet clover.4 Excess Moisture Insurance (EMI) acreage and coverage shown in the table is only for land that could not be seeded due to excess moisture and on which claims were paid. Total EMI insured acreage andcoverage were 8,980,937 and $499,613,<strong>12</strong>8, respectively.16<strong>Manitoba</strong> <strong>Agricultural</strong> SeRVICes <strong>Corporation</strong>
Hail InsuranceA separate policy covering spot-loss hail damage isavailable to producers who participate in AgriInsurance.Producer premiums fund all Hail Insurance costs,including administrative expenses. Premium rates aredetermined based on AgriInsurance risk areas, rather thanby township as is done by private insurers. Coverage canbe selected at any time during the growing season, andis available in various dollar amounts depending on thecrop. Hail Insurance also provides coverage for loss due toaccidental fire.The Continuous Hail Insurance Option (CHIO) allowsproducers to automatically insure all eligible cropswithout an <strong>annual</strong> application. Producers are eligible foran increased premium discount (above the base 2%) ifthey maintain their CHIO coverage for more than twoyears. Now in its fifth year, CHIO continues to be very wellaccepted with 54% of all hail contract holders participating.Figure 3 – Hail Insurance Premiums and Indemnities($ millions)25201510502007/08 2008/09 2009/10 2010/11 <strong>2011</strong>/<strong>12</strong>PremiumsIndemnitiesMASC insured 3.5 million acres in <strong>2011</strong>/<strong>12</strong> for a totalcoverage (liability) of $493 million. Premiums prior todiscounts were $17.1 million, with indemnities of$4.8 million, resulting in a loss ratio (loss as a percentageof premium) of 28%. Figure 3 provides a summary of HailInsurance premiums and indemnities for the past fiveyears. In <strong>2011</strong>/<strong>12</strong>, MASC’s Hail Insurance represented 55%of <strong>Manitoba</strong>’s crop hail insurance market.After accounting for CHIO discounts and early paymentdiscounts totalling $0.9 million, interest revenue of$1.0 million, reinsurance premium of $1.1 million andadministrative expenses of $2.2 million, Hail Insurance hadnet income for the year of $9.1 million. As a result, the HailInsurance reserve increased from $57.9 million to$67.0 million.<strong>2011</strong>/<strong>12</strong> Annual Report 17
Table 2 - Five Year Insurance Statistics – <strong>2011</strong>/<strong>12</strong>2007/08 2008/09 2009/10 2010/11 <strong>2011</strong>/<strong>12</strong>AgriInsuranceNumber of producer contracts 9,893 9,737 9,402 9,174 8,929Insured acres (millions) 9.1 9.3 9.4 9.3 9.6Total coverage (liability) ($ millions) 1,323.9 1,789.8 1,746.6 1,757.8 1,723.2Producer premiums ($ millions) 58.9 76.6 70.9 71.2 71.2Total premiums ($ millions) 151.0 196.2 181.6 175.4 168.8Average coverage level selected (%) 75.4 75.9 76.1 76.4 77.3Number of claims paid 8,177 6,001 8,6<strong>12</strong> 11,346 14,131Indemnities paid ($ millions) 72.8 60.2 148.1 210.5 326.9Income (loss) for the year ($ millions) 62.1 111.8 2.6 (64.0) (196.3)Funds retained, end of year ($ millions) 221.3 333.1 335.7 271.7 75.4Indemnities to total premium ratio (%) 48 31 82 <strong>12</strong>0 194Indemnities to coverage ratio (%) 5.5 3.4 8.5 <strong>12</strong>.0 19.0Hail InsuranceNumber of producer contracts 4,468 4,757 4,504 4,320 3,937Insured acres (millions) 4.1 4.6 4.5 4.3 3.5Total coverage (liability) ($ millions) 476.8 640.5 630.3 595.9 493.1Premiums, prior to discounts ($ millions) 14.8 22.8 23.0 21.0 17.1Number of claims paid 2,448 1,919 1,440 1,553 775Indemnities paid ($ millions) 14.4 9.9 8.2 10.5 4.8Income (loss) for the year ($ millions) (2.1) 9.2 10.4 6.5 9.1Funds retained, end of year ($ millions) 31.7 40.9 51.3 57.9 67.0Indemnities to premium ratio (%) 97 43 36 50 28Indemnities to coverage ratio (%) 3.0 1.5 1.3 1.8 1.0Note: The above statistics are based on the insurance crop year and, as such, may not correspond exactly to the <strong>2011</strong>/<strong>12</strong> financial statements.18<strong>Manitoba</strong> <strong>Agricultural</strong> SeRVICes <strong>Corporation</strong>
LendingMASC’s lending programs give <strong>Manitoba</strong>’s agricultural producers and rural businesses reasonable access to credit. MASCprovides direct loans and guarantees loans from private sector financial institutions, thereby assisting in the creation andexpansion of operations in rural <strong>Manitoba</strong>.The Bridging Generations Initiative supports young farmers under the age of 40 by assisting in the inter-generationaltransfer of assets through flexible financing options, Young Farmer Rebates and Management Training Credits.Despite the general trend toward fewer young farmers, MASC’s involvement with this target group has increased for thethird consecutive year. In <strong>2011</strong>/<strong>12</strong>, MASC issued 435 loans to producers under the age of 40, an increase of 49% over2010/11 and 61% over 2009/10. In dollar amounts, the total of $63.5 million in direct loans to young farmers representsa 56% increase compared to the previous year and a 93% increase relative to 2009/10. Loans to young farmersaccounted for 81% of MASC’s direct lending business.The Young Farmer Rebate (YFR) reduces the cost of borrowing in the critical start-up phase of an operation. YFRprovides an <strong>annual</strong> rebate of 2% on the first $150,000 of principal, and is available for the first five years of a loan,resulting in a lifetime maximum rebate of $15,000. In <strong>2011</strong>/<strong>12</strong>, YFR totalled $1.5 million.Flexible financing options give young farmers a choice between 90% financing or five years of interest-only payments,allowing them the flexibility of reducing their initial down payment or easing their operation’s cash flow pressureduring its start-up phase. In <strong>2011</strong>/<strong>12</strong>, MASC approved 118 loans for $14.5 million under the 90% financing option.Given that interest rates are currently at historical lows, the interest-only option is not attracting much attention at thistime.Young farmers can earn a Management Training Credit (MTC) of 1% of the principal amount of an eligible DirectLoan (to a maximum of $2,500) in each of the first five years of the loan. In <strong>2011</strong>/<strong>12</strong>, young farmers earned MTCstotalling $188,000.LoansMASC provides short, intermediate and long-term financing with reasonable interest rates to eligible <strong>Manitoba</strong> agriculturalproducers and rural businesses. Clients are not penalized for prepayment, and have the flexibility of either locking in aninterest rate for the full amortization period (up to 25 years) or selecting renewable interest rates for one to five years. Asshown in Table 3, as of March 31, 20<strong>12</strong>, MASC had 4,394 outstanding loans with current balances totalling $347.1 million.Direct Loans are available for such purposes as purchasing land and buildings, constructing or renovating farm productionbuildings, purchasing breeding livestock, constructing or renovating farm homes, purchasing supply management quota, andconsolidating and refinancing debts.<strong>2011</strong>/<strong>12</strong> Annual Report 19
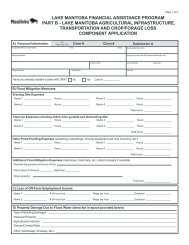
Also included in this category are Alternate Energy Loans, Environmental Enhancement Loans, Onsite WastewaterManagement Loans and Manure Management Loans. Environmental Enhancement Loans provide financial assistance toproducers who improve the environmental sustainability of their operations and management practices. Alternate EnergyLoans are available to finance the construction, equipment, and other approved capital costs associated with alternate energyprojects such as ethanol, bio-diesel and wind energy production. Onsite Wastewater Management Systems Loans facilitatesewage ejectors being replaced with more environmentally friendly disposal fields. New in <strong>2011</strong>, Manure ManagementLoans, together with MAFRI’s Manure Management Financial Assistance Program, provide eligible hog producers with thefinancing necessary to comply with environmental regulations.In <strong>2011</strong>/<strong>12</strong>, MASC approved 539 new loans for a total of $77.6 million. The number of new loans increased by 48%, with loanamounts increasing by 55%. MASC’s Direct Loans have been progressively increasing in size over time, averaging $144,000in <strong>2011</strong>/<strong>12</strong>. As of March 31, 20<strong>12</strong>, MASC’s total Direct Loan portfolio was $248.3 million (3,008 loans). As shown in Figure 4,the Direct Loans issued in <strong>2011</strong>/<strong>12</strong> were used predominantly for purchasing land and buildings (58%), refinancing (19%) andconsolidating debt (<strong>12</strong>%).Figure 4 – Direct Loan PurposesDirect Loan Purposes <strong>2011</strong>/<strong>12</strong>Historical Direct Loan Purposes 1959-2010Land/Building Purchases (58%)Refinancing (19%)Debt Consolidation (<strong>12</strong>%)Livestock Purchases (6%)Land/Building Improvements (3%)Other (2%)Land/Building Purchases (65%)Debt Consolidation (22%)Refinancing (1%)Livestock Purchases (5%)Land/Building Improvements (5%)Other (2%)Stocker Loans provide producers with short-term financing to purchase feeder cattle and calves, or as a cash advance on theirown retained feeders. MASC issued 221 Stocker Loans in <strong>2011</strong>/<strong>12</strong> (down 7% from the prior year). At $23.3 million, the totalvalue of Stocker Loans was up 11%, while the number of head financed was down 19% at 35,375.Comprehensive Refinancing Loans assist existing MASC clients who are in financial difficulty. The interest rate for the firstfive years of these loans is set at one-half a percentage point below MASC’s prevailing five-year rate at the time the loan istaken out. In <strong>2011</strong>/<strong>12</strong>, the number of refinancing loans decreased <strong>12</strong>%, with 92 loans approved, though the dollar amountincreased 2% for a total of $6.8 million. These loans primarily assisted producers experiencing prolonged excess moisturerelated problems and extended periods of poor cattle returns. As of March 31, 20<strong>12</strong>, the Comprehensive Refinancing Loanportfolio consisted of 499 loans for $29.9 million.Enterprise Development Loans were introduced in 2008/09 to provide financial support for the <strong>Manitoba</strong> Government’sinitiative of developing and diversifying the rural economy. As of March 31, 20<strong>12</strong>, the Enterprise Development Loan portfoliohad two loans for $3.9 million.Property ManagementAs a result of debt settlement negotiations and foreclosure proceedings, MASC periodically acquires title to property. During<strong>2011</strong>/<strong>12</strong>, MASC acquired no land and sold 1,244 acres, reducing the inventory to 3,363 acres as of March 31, 20<strong>12</strong>. Of theseacres, 3,208 acres are long-term leases under the Land Lease Option Program and 155 acres are on a short-term lease.20<strong>Manitoba</strong> <strong>Agricultural</strong> SeRVICes <strong>Corporation</strong>
Table 3 – Loan SummaryApprovals2010/11Approvals<strong>2011</strong>/<strong>12</strong>Outstandingas of March 31, 20<strong>12</strong>Number Millions Number Millions Number MillionsDirect Loans 1 366 $50.1 539 $77.6 3,008 $248.3Stocker Loans 237 20.9 221 23.3 198 19.5Comprehensive Refinancing Loans 104 6.7 92 6.8 499 29.9Enterprise Development Loans - - - - 2 3.9<strong>Manitoba</strong> Hog Assistance Loans 2 - - - - 96 30.5BSE Recovery Loans 2 - - - - 548 14.5Enhanced Flood Proofing Assistance Loans 2 - - - - 28 0.3Producer Recovery Loans 2 - - - - 15 0.2Total 707 $77.7 852 $107.7 4,394 $347.11 Includes Environmental Enhancement, Alternate Energy and Onsite Wastewater Management Systems loans.2 Prior programming for which outstanding loans are still being administered.Loan GuaranteesMASC guarantees various types of loans made by privatesector lending institutions. In partnership with creditunions, caisse populaires and certain chartered banks,MASC helps provide rural <strong>Manitoba</strong>ns with accessto credit with reasonable interest rates and terms thatotherwise would likely not exist. This partnership providesagricultural producers and rural entrepreneurs withopportunities to develop and expand their operations. Inaddition, MASC’s loan guarantees encourage financing inareas that the private sector generally considers to be higherrisk. As shown in Table 4, as of March 31, 20<strong>12</strong>, MASC had510 outstanding guarantees amounting to $82.0 million,which facilitated loans by participating lenders totalling$295.3 million.Diversification Loan Guarantees assist producers andagricultural enterprises in diversifying their operationsand/or adding value to agricultural commodities. MASCprovides a 25% guarantee of the principal amount of theloan made by a participating lender. In <strong>2011</strong>/<strong>12</strong>, MASCapproved 17 guarantees (63% of the 2010/11 total) for loanstotalling $18.7 million. As of March 31, 20<strong>12</strong>, MASC had182 active guarantees with related loan amounts of$224.0 million.<strong>Manitoba</strong> Livestock Associations Loan Guaranteesprovide producers who are members of livestockassociations with cost savings created through morefavourable financing terms and reduced costs due to highercattle transaction volumes. MASC guarantees 25% of theprincipal amount of a loan made to a livestock associationby a participating lender. Individual livestock associationsare limited to a maximum guarantee of $1.25 million,which results in a maximum loan of $5 million. As ofMarch 31, 20<strong>12</strong>, there were nine associations (down by onefrom 2010/11), with 99 active association members and anapproved maximum total loan amount of $19.4 million.Operating Credit Guarantees for Agriculture assistproducers in obtaining lines of credit with reasonable termsfrom lenders participating in the program. MASC’s 25%guarantee of an approved line of credit makes financingavailable, which otherwise likely would not be offeredby the private lending institution. As of March 31, 20<strong>12</strong>,MASC had 131 active guarantees with a total maximumloan amount of $38.5 million.Operating Credit Guarantees for Rural Small Businesswere introduced in 2009 to assist small rural non-agriculturalbusinesses in obtaining lines of credit with reasonableterms from participating lenders. MASC guarantees 25%of the maximum authorized loan amount. The guaranteedlines of credit may be used to purchase inventory, financereceivables and cover general operating expenses. Theprogram guarantees loans up to a maximum of $200,000. Asof March 31, 20<strong>12</strong>, there were five active guarantees with atotal maximum loan amount of $0.7 million.<strong>2011</strong>/<strong>12</strong> Annual Report 21
Rural Entrepreneur Assistance (REA) provides aguarantee of up to 80% of the principal loan amount madeby a participating lender to small rural non-agriculturalbusinesses. REA guarantees loans up to a maximum of$200,000. In <strong>2011</strong>/<strong>12</strong>, REA approved 37 guarantees onloans totalling $4.3 million. As of March 31, 20<strong>12</strong>, the REAportfolio had 183 active guarantees (down 6%) with relatedoutstanding loans of $<strong>12</strong>.7 million (down 1%). InApril <strong>2011</strong>, MASC assumed full responsibility for thecontingent liability associated with existing and futureREA loan guarantees.Table 4 – Loan Guarantee SummaryLoan Approvals2010/11Loan Approvals<strong>2011</strong>/<strong>12</strong>Related Outstanding Loansby Lending Institutions as ofMarch 31, 20<strong>12</strong>OutstandingGuarantees as ofMarch 31, 20<strong>12</strong>Number Millions Number Millions Number Millions MillionsDiversification Loan Guarantees 1 27 $25.0 17 $18.7 182 $224.0 2 $56.0<strong>Manitoba</strong> Livestock Associations Loan10 22.1 9 19.4 9 19.4 2 4.9GuaranteesOperating Credit Guarantees for160 43.1 <strong>12</strong>6 36.1 131 38.5 2 9.6AgricultureOperating Credit Guarantees for Rural2 0.2 6 0.9 5 0.7 2 0.2Small BusinessRural Entrepreneur Assistance 47 4.5 37 4.3 183 <strong>12</strong>.7 3 11.3Total 246 $94.9 195 $79.4 510 $295.3 $82.01 Outstanding loans from the original Diversification Loan Guarantee Program and the existing Enhanced Diversification Loan Guarantee Program are included.2 Amounts reflect the original loan amounts that were guaranteed under the program as of March 31, 20<strong>12</strong>.3 Related outstanding loan amounts represent the loan balances as of March 31, 20<strong>12</strong> for participating lending institutions associated with the guarantees administered by MASC.Table 5 – <strong>Agricultural</strong> Lending Activity by Sector – as of March 31, 20<strong>12</strong>Primary EnterpriseDirectLending%<strong>Manitoba</strong> LivestockAssociations LoanGuarantees%OperatingCredit Guarantees forAgriculture%Diversification LoanGuarantees*%Grains/Oilseeds 50.6 - 53.5 - 43.2Potatoes 0.2 - 16.2 3.0 1.0Other Crops 1.9 - 3.7 0.5 1.7Cattle 32.0 100.0 7.9 0.2 27.9Hogs 10.0 - 13.4 44.0 14.6Poultry 0.8 - 1.4 8.4 1.9Dairy 2.2 - 1.0 42.0 7.5Other 2.3 - 2.9 1.9 2.2Share of All Programs (%) 82.9 1.2 2.3 13.6 100.0* Includes the previous Diversification Loan Guarantee Program as well as the existing Enhanced Diversification Loan Guarantee Program.Notes:1. The table does not include Enterprise Development Loans, Enhanced Flood Proofing Assistance Loans, Operating Credit Guarantees for Rural Small Business and Rural Entrepreneur Assistance.2. In the case of guarantee programs, this table includes only MASC’s guaranteed amounts (i.e. the contingent liability), rather than the loan activity generated by the guarantees.TOTAL%22<strong>Manitoba</strong> <strong>Agricultural</strong> SeRVICes <strong>Corporation</strong>
Figure 5 – Five Year Lending Statistics – Year EndTotals ($ Millions)8007006005004003002001000654.2 671.9 663.9 668.5 642.4336.2 329.7 321.5 329.3 295.3318.0 342.2 342.4 339.2 347.<strong>12</strong>007/08 2008/09 2009/10 2010/11 <strong>2011</strong>/<strong>12</strong>Direct LoansLoans with MASC GuaranteesOther InitiativesMASC has extensive experience in designing, administering and delivering support programs forrural <strong>Manitoba</strong>ns on behalf of the governments of <strong>Manitoba</strong> and Canada. In <strong>2011</strong>/<strong>12</strong>, MASC assistedin the delivery of an unprecedented number and magnitude of emergency assistance programs, inresponse to flooding and excess moisture conditions.Wildlife Damage CompensationProvided a producer has taken reasonable steps to mitigatedamage, the Wildlife Damage Compensation Programreduces financial losses caused by livestock predators,big game and migratory waterfowl. Starting in <strong>2011</strong>/<strong>12</strong>,compensation was increased from 80% to 90% of lostproduction. This change in level of compensation needs tobe considered when comparing program results forTable 6 – Wildlife Damage Compensation Program<strong>2011</strong>/<strong>12</strong> with previous years. Administration and programpayments up to the 80% level are funded by Canada(60%) and <strong>Manitoba</strong> (40%), with the remaining 10%of compensation being funded entirely by <strong>Manitoba</strong>.In <strong>2011</strong>/<strong>12</strong>, Wildlife Damage Compensation Programpayments and related administration totalled $2.4 million,down slightly from the previous year. Table 6 provides abreakdown by type of loss.Cause of Damage Number of Claims Compensation(000)Administration(000)Total(000)2010/11 <strong>2011</strong>/<strong>12</strong> 2010/11 <strong>2011</strong>/<strong>12</strong> 2010/11 <strong>2011</strong>/<strong>12</strong> 2010/11 <strong>2011</strong>/<strong>12</strong>Big Game 665 409 $1,159.3 $882.2 $202.3 $<strong>12</strong>3.8 $1,361.6 $1,006.0Waterfowl 229 117 6<strong>12</strong>.4 286.2 56.0 25.7 668.4 311.9Livestock Predation 1,869 1,881 616.9 874.1 198.3 204.7 815.2 1,078.8Total 2,763 2,407 $2,388.6 $2,042.5 $456.6 $354.2 $2,845.2 $2,396.7<strong>2011</strong>/<strong>12</strong> Annual Report 23
Farmland School Tax RebateSince 2005, MASC has been responsible for administratingthe <strong>Manitoba</strong> Government’s Farmland School Tax RebateProgram. For <strong>2011</strong>, the rebate was increased to 80% (upfrom 75% in 2010) of the school tax paid on farmland.Farmland owners have three years to apply for the rebate.As of March 31, 20<strong>12</strong>, MASC had disbursed rebatesrelating to the <strong>2011</strong> tax year to 30,034 applicants for a totalof $31.6 million, with incurred administrative expenses of$387,000 (1.2% of the rebate amount). Details are providedin Table 7.Table 7 – Farmland School Tax Rebates(as of March 31, 20<strong>12</strong>)Program Year Rebate Level ApplicationsPaidRebate Paid(Millions)2007 65% 36,515 $27.82008 70% 36,258 $30.42009 75% 35,066 $32.92010 75% 33,422 $32.0<strong>2011</strong>* 80% 30,034 $31.6*Represents less than a full year of activity.Young Farmer Crop Plan CreditA one-time Young Farmer Crop Plan Credit of $300 onAgriInsurance premium is available to new AgriInsuranceentrants (under the age of 40). To qualify, a young farmermust complete a cropping plan that is acceptable to theirMAFRI Farm Production Advisor. In <strong>2011</strong>/<strong>12</strong>, 67 youngfarmers qualified for credits totalling $18,500. Programcosts are paid by the <strong>Manitoba</strong> Government.Land Lease Option ProgramFrom 1974 to 1977, the former <strong>Manitoba</strong> <strong>Agricultural</strong>Credit <strong>Corporation</strong> had a program whereby farmland waspurchased from willing sellers and leased to qualifyingproducers. As of March 31, 20<strong>12</strong>, 10 long-term leasescovering 3,208 acres remain in place.Inspection <strong>Services</strong>In support of <strong>Manitoba</strong>’s agricultural sector, MASCprovides inspection services at a reasonable cost. In<strong>2011</strong>/<strong>12</strong>, MASC: conducted stored grain audits for cashadvances issued by the Canadian Wheat Board; providedcrop adjusting services in situations where windmillconstruction or maintenance activities resulted in cropdamage; certified that the products sold at the St. NorbertFarmers market had been produced locally; assessedthird-party crop loss appraisals for private sector propertyinsurers; and conducted livestock inspections for the<strong>Manitoba</strong> Livestock Cash Advance Program. Total revenueof $68,200 was generated by these services in <strong>2011</strong>/<strong>12</strong>.24<strong>Manitoba</strong> <strong>Agricultural</strong> SeRVICes <strong>Corporation</strong>
Flood <strong>2011</strong> – Building andRecovery Action PlanAnnounced in May <strong>2011</strong>, the Building and RecoveryAction Plan (BRAP) programs were developed to helpfamilies, producers and businesses cope with the <strong>2011</strong>flood, strengthen communities affected by flooding,and build for future flood mitigation. The <strong>Manitoba</strong>Government has fully funded these programs, with costsharing for some components to be received from theGovernment of Canada under the Disaster FinancialAssistance Arrangements (DFAA). The BRAP componentsthat MASC, in conjunction with MAFRI, has and in somecases continues to be involved in delivering, include:Lake <strong>Manitoba</strong> Financial AssistanceProgramPart A – Lake <strong>Manitoba</strong> Pasture Flooding Assistance –provided financial assistance to help <strong>Manitoba</strong> livestockproducers manage their feed requirements due to the lossof pasture in the designated Lake <strong>Manitoba</strong> Flood Zone.Part A allowed producers to rent new pasture and purchasefeed for animals displaced from flooded land. As ofMarch 31, 20<strong>12</strong>, a total of $2.7 million had been paidto 265 producers under Part A.Part B – Lake <strong>Manitoba</strong> <strong>Agricultural</strong> Infrastructure,Transportation and Crop/Forage Loss – assistedagricultural crop and livestock producers in managing andrecovering from the impacts of the <strong>2011</strong> flooding in theLake <strong>Manitoba</strong> Flood Zone. Part B provided assistance forflood mitigation measures, lost crop production, damage toagricultural infrastructure, and extra costs for transportinglivestock and feed. Producers were also compensatedfor debris cleanup, damage to fences, corrals and cropinventory. As of March 31, 20<strong>12</strong>, over $19.9 million hadbeen paid to 872 producers under Part B.Part C – Lake <strong>Manitoba</strong> Business, Principal and Non-Principal Residence – provided compensation for thecost of uninsurable property damage and flood protectionmeasures taken as a direct result of the elevated waterlevels in the Lake <strong>Manitoba</strong> Flood Zone. Componentsof Part C provided compensation to: principal residenceowners for mitigation measures, structures, infrastructure,landscape, contents, and temporary accommodation costsin cases of evacuation; principal residents of First Nationsfor compensation for loss of contents; non-principalresidence owners for mitigation measures, building andinfrastructure losses; and business owners for floodmitigation measures, building and infrastructure losses,inventory losses and income loss. As of March 31, 20<strong>12</strong>,nearly $19.9 million had been provided to individuals andbusinesses under Part C.Part D – Lake <strong>Manitoba</strong> Flood Protection for PrincipalResidences, Non-Principal Residences and Businesses –provided financial assistance for flood protection measuresundertaken individually or cooperatively for the purposeof protecting principal residences, non-principal residencesand business structures in the Lake <strong>Manitoba</strong> Flood Zone.Primarily intended to compensate for the construction ofrock barriers and dikes to protect structures from flooddamage, funding was also available to hire professionalengineers for the design of permanent flood protectionmeasures. Part D also covered the first $20,000 on projectseligible for the Individual Flood Protection Initiative andfor the Financial Assistance for Cottage Owners Program,administered by <strong>Manitoba</strong> Water Stewardship (a divisionof <strong>Manitoba</strong> Infrastructure and Transportation). Asof March 31, 20<strong>12</strong>, 141 individuals and businesses hadreceived approximately $1.8 million for such measures.Hoop and Holler CompensationProgram – provided compensation to residents andbusinesses (including farms) within the designated areafor property damage, income loss, and flood protectionmeasures taken as a direct result of the controlled releaseof water from the Assiniboine River near Hoop and HollerBend, or from the overflow of water diverted into thePortage Diversion. As of March 31, 20<strong>12</strong>, this program hadcompensated 631 applicants for $6.2 million of losses.Dauphin River Flood AssistanceProgram – provided compensation for income lossesto commercial fishers in the Dauphin River area who wereunable to access the fishery and fish processing facilitiesdue to record high water levels resulting from maximumoutflows from Lake <strong>Manitoba</strong>. As of March 31, 20<strong>12</strong>, thisprogram had provided 65 applicants with a total of$1.8 million in compensation.<strong>2011</strong>/<strong>12</strong> Annual Report 25
Lake Dauphin Emergency FloodProtection Program – provided financialassistance for emergency structural flood protectionmeasures undertaken for the purpose of protectingprincipal residences and non-principal residences in theLake Dauphin Flood Zone. As of March 31, 20<strong>12</strong>, 54program applicants had received compensation totalling$0.3 million.Shoal Lakes <strong>Agricultural</strong> FloodingAssistance Program – provided financial supportfor agricultural production losses caused by chronicflooding in the Shoal Lakes Complex in the Interlake areaof <strong>Manitoba</strong>. As of March 31, 20<strong>12</strong>, this program hadprovided <strong>12</strong>4 applicants with $3.8 million in compensation.This amount does not include the buy-out of floodedproperties, which is directly handled by MAFRI.<strong>2011</strong> <strong>Manitoba</strong> AgriRecoveryProgramAnnounced in June <strong>2011</strong>, the <strong>2011</strong> <strong>Manitoba</strong> AgriRecoveryProgram provided financial assistance to crop, forage andlivestock producers affected by extreme excess moistureand flooding in <strong>2011</strong>. Certain parts of the first threeprograms listed were cost shared by Canada and <strong>Manitoba</strong>through the Canada-<strong>Manitoba</strong> AgriRecovery Program.The remaining three programs were funded entirely by<strong>Manitoba</strong>.<strong>Manitoba</strong> Excess Moisture AssistanceProgram – assisted crop producers affected by extremeexcess moisture and flooding in <strong>2011</strong>. Producers receivedassistance of $30 per acre for land that was too wet toseed by June 20, <strong>2011</strong>, as well as for land that was seededand subsequently destroyed by excess moisture. As ofMarch 31, 20<strong>12</strong>, this program had paid compensationto 10,078 producers for $107.6 million. This amountrepresents 3.1 million acres of land that was too wet to seedand an additional 0.5 million acres of seeded crop that wasdestroyed by excess moisture.<strong>2011</strong>. Program payments were made based on the needto transport feed to livestock or livestock to feed overdistances greater than what is normally experienced. Asof March 31, 20<strong>12</strong>, <strong>12</strong>2 producers had been paid a total of$0.4 million under this program.<strong>Manitoba</strong> Forage Shortfall AssistanceProgram – assisted livestock producers who incurredextraordinary costs to maintain the feed requirementfor their livestock herds as a result of the forage shortagecaused by flooding or excess moisture conditions in <strong>2011</strong>.Program assistance was based on covering shortfalls thatwould have occurred over the <strong>2011</strong>/<strong>12</strong> pasture and winterfeeding periods. As of March 31, 20<strong>12</strong>, 436 livestockproducers had been paid compensation totalling$7.4 million.<strong>Manitoba</strong> Forage Restoration AssistanceProgram – assisted forage producers to restoreestablished tame forage and forage seed damaged by excessmoisture in <strong>2011</strong>. Producers were eligible for compensationof $50 per acre to help re-establish forage and forageseed crops. Producers are required to destroy and reseedthe forage crop prior to compensation being paid.Consequently, as of March 31, 20<strong>12</strong>, no program paymentshad been made.<strong>Manitoba</strong> Greenfeed AssistanceProgram – assisted producers to increase livestockfeed production by seeding and harvesting greenfeed.As of March 31, 20<strong>12</strong>, 1,147 producers had receivedcompensation totalling $2.8 million.<strong>Manitoba</strong> Infrastructure and IndividualAssessment Program – assisted crop andlivestock producers in recovering from flood losses relatedto mitigation, and losses to agricultural property andinventory that were not eligible for Disaster FinancialAssistance or for the Flood <strong>2011</strong> – Building and RecoveryAction Plan. As of March 31, 20<strong>12</strong>, 21 producers hadreceived compensation totalling $0.8 million.<strong>Manitoba</strong> Transportation AssistanceProgram – assisted livestock producers who incurredextraordinary transportation costs as a result of forageshortages caused by extreme moisture conditions in26<strong>Manitoba</strong> <strong>Agricultural</strong> <strong>Services</strong> <strong>Corporation</strong>
Financial Statements<strong>2011</strong>/<strong>12</strong> Annual Report 27
Responsibility for Financial StatementsThe management of the <strong>Manitoba</strong> <strong>Agricultural</strong> <strong>Services</strong> <strong>Corporation</strong> is responsible for the integrity, objectivity andreliability of the financial statements, accompanying notes and other financial information in the <strong>annual</strong> <strong>report</strong>.Management maintains internal control systems to ensure that transactions are accurately recorded in accordance withestablished policies and procedures. In addition, certain best estimates and judgements have been made based on acareful assessment of the available information.The financial statements and accompanying notes are examined by the Auditor General for <strong>Manitoba</strong>, whose opinion isincluded here. The Auditor General has access to MASC’s Board of Directors, with or without management present, todiscuss the results of their audit and the quality of MASC’s financial <strong>report</strong>ing.Original signed byOriginal signed byNeil HamiltonPresident & Chief Executive OfficerJim LewisVice President, Finance & AdministrationJuly 31, 20<strong>12</strong>28<strong>Manitoba</strong> <strong>Agricultural</strong> <strong>Services</strong> <strong>Corporation</strong> – <strong>2011</strong>/<strong>12</strong> Annual Report
MANITOBA AGRICULTURAL SERVICES CORPORATION – <strong>2011</strong>/<strong>12</strong> ANNUAL REPORT 29
Original signed by30MANITOBA AGRICULTURAL SERVICES CORPORATION – <strong>2011</strong>/<strong>12</strong> ANNUAL REPORT
Statement of Financial PositionAs at March 31, 20<strong>12</strong>(in thousands of dollars)FINANCIAL ASSETSNote March 31, 20<strong>12</strong> March 31, <strong>2011</strong> April 1, 2010(Restated - Note 4) (Restated - Note 4)Cash $ 5,223 $ 2,291 $ 1,177Accounts receivable 8 1,916 2,131 3,931Receivables from the Province of <strong>Manitoba</strong> 9 107,277 9,684 <strong>12</strong>,835Receivables from the Government of Canada 10 5,659 6,938 6,625Investments 11 191,475 350,227 394,051Loans receivable <strong>12</strong> 318,247 310,448 310,777Total Financial Assets $ 629,797 $ 681,719 $ 729,396LIABILITIESAccounts payable and accrued liabilities 13 $ 35,866 $ 14,609 $ 7,620Claims payable 14 <strong>12</strong>4,650 21,164 16,893Loans from the Province of <strong>Manitoba</strong> 15 345,109 334,748 339,372Provisions for losses on guaranteed loans 16 15,829 15,206 15,324Future employee benefits 17 8,775 8,698 8,239Total Liabilities $ 530,229 $ 394,425 $ 387,448Net Financial Assets $ 99,568 $ 287,294 $ 341,948NON-FINANCIAL ASSETSInventories held for use 2 $ 480 $ 588 $ 501Prepaid expenses 2 <strong>12</strong>5 118 101Tangible capital assets 19 198 232 267Total Non-Financial Assets $ 803 $ 938 $ 869Accumulated surplus $ 100,371 $ 288,232 $ 342,817Loan guarantees and contingencies 16Commitments 18The accompanying notes and schedules are an integral part of these financial statements.Approved by the Board:Original signed byJohn S. PlohmanChair, Board of DirectorsOriginal signed byHarry SotasVice Chair, Board of Directors<strong>Manitoba</strong> <strong>Agricultural</strong> <strong>Services</strong> <strong>Corporation</strong> – <strong>2011</strong>/<strong>12</strong> Annual Report 31
Statement of OperationsFor the Year Ended March 31, 20<strong>12</strong>(in thousands of dollars)20<strong>12</strong> <strong>2011</strong>Budget actual actualREVENUEPremiums from insured producers $ 105,471 $ 87,275 $ 91,448Interest from loans 19,810 19,523 19,751Contribution from the Province of <strong>Manitoba</strong> 98,459 315,895 108,080Contribution from the Government of Canada 84,939 132,351 103,628Investment income 4,050 3,701 3,470Other income 189 340 1443<strong>12</strong>,918 559,085 326,521EXPENSELending Programs 25,710 25,703 22,153AgriInsurance Program 228,487 377,953 252,976Hail Insurance Program 20,810 8,097 14,508Wildlife Damage Compensation Program 3,224 2,397 2,845Farmland School Tax Rebate Program 35,515 36,935 33,373Other Programs 80 295,861 55,251313,826 746,946 381,106Deficit for the year $ (908) (187,861) (54,585)Accumulated surplus, beginning of year 288,232 342,817Accumulated surplus, end of year $ 100,371 $ 288,232The accompanying notes and schedules are an integral part of these financial statements.32<strong>Manitoba</strong> <strong>Agricultural</strong> <strong>Services</strong> <strong>Corporation</strong> – <strong>2011</strong>/<strong>12</strong> Annual Report
Statement of Change in Net Financial AssetsFor the Year Ended March 31, 20<strong>12</strong>(in thousands of dollars)20<strong>12</strong> <strong>2011</strong>actualActualNet loss $ (187,861) $ (54,585)Tangible capital assetsAcquisition of tangible capital assets (41) (54)Amortization of tangible capital assets 75 8934 35Other non-financial assetsDisposal (acquisition) of inventory held for use 108 (87)Increase in prepaid expenses (7) (17)101 (104)Decrease in net financial assets (187,726) (54,654)Net financial assets, beginning of year 287,294 341,948Net financial assets, end of year $ 99,568 $ 287,294The accompanying notes and schedules are an integral part of these financial statements<strong>Manitoba</strong> <strong>Agricultural</strong> <strong>Services</strong> <strong>Corporation</strong> – <strong>2011</strong>/<strong>12</strong> Annual Report 33
Statement of Cash FlowsFor the Year Ended March 31, 20<strong>12</strong>(in thousands of dollars)20<strong>12</strong> <strong>2011</strong>Cash provided by (used for):OperatingDeficit for the year $ (187,861) $ (54,585)Amortization of tangible capital assets 75 89Changes in:(187,786) (54,496)Receivables (96,099) 4,638Loans receivable 639 (2,370)Accounts payable and accrued liabilities 21,257 6,989Claims payable 103,486 4,271Provisions for losses on guaranteed loans 623 (118)Future employee benefits 77 459Prepaid expenses (7) (17)Inventories held for use 108 (87)Cash used for operating activities (157,702) (40,731)CapitalAcquisition of tangible capital assets (41) (54)Cash used for capital activities (41) (54)InvestingInvestments redeemed 153,070 32,158Loans disbursed (95,898) (77,009)Loan principal received 87,460 79,708Cash provided by investing activities 144,632 34,857FinancingDebt repayments to the Province of <strong>Manitoba</strong> (73,639) (68,824)Loans from the Province of <strong>Manitoba</strong> 84,000 64,200Cash provided by (used for) financing activities 10,361 (4,624)Net decrease in cash and cash equivalents (2,750) (10,552)Cash and cash equivalents, beginning of year 76,603 87,155Cash and cash equivalents, end of year $ 73,853 $ 76,603Cash and cash equivalents are comprised of the following:Investments $ 191,475 $ 350,227Investments with terms greater than 90 days (<strong>12</strong>2,845) (275,915)Investments with terms of 90 days or less 68,630 74,3<strong>12</strong>Cash 5,223 2,291$ 73,853 $ 76,603Supplemental Cash Flow InformationInterest paid $ 15,857 $ 16,619Interest received $ 23,620 $ 22,843The accompanying notes and schedules are an integral part of these financial statements.34<strong>Manitoba</strong> <strong>Agricultural</strong> SeRVICes <strong>Corporation</strong> – <strong>2011</strong>/<strong>12</strong> Annual Report
Notes to Financial Statementsas at March 31, 20<strong>12</strong> (tabular amounts in thousands of dollars)1. NATURE OF ORGANIZATIONThe <strong>Manitoba</strong> <strong>Agricultural</strong> Credit <strong>Corporation</strong> (MACC) was established under The <strong>Agricultural</strong> Credit <strong>Corporation</strong>Act. The <strong>Manitoba</strong> Crop Insurance <strong>Corporation</strong> (MCIC) was established under The Crop Insurance Act. As a result ofthe proclamation of The <strong>Manitoba</strong> <strong>Agricultural</strong> <strong>Services</strong> <strong>Corporation</strong> Act, C.C.S.M. c.A25 on September 1, 2005, MACCand MCIC were amalgamated to form a provincial Crown corporation called the <strong>Manitoba</strong> <strong>Agricultural</strong> <strong>Services</strong><strong>Corporation</strong> (MASC) and the legislation establishing the former corporations was repealed.MASC provides lending, insurance and other programs and services. Its core programs include direct loans toagriculture producers, loan guarantees, AgriInsurance and Hail Insurance. MASC also delivers the Wildlife DamageCompensation Program, Farmland School Tax Rebate Program and other programs and services.2. SIGNIFICANT ACCOUNTING POLICIES AND REPORTING PRACTICESMASC’s financial statements are presented in accordance with Canadian Public Sector Accounting (PSA) standards.MASC adopted PSA standards with a transition date of April 1, 2010. More details on this transition are provided in Note 4.MASC elected the early adoption of PS3450 Financial Instruments and PS3041 Portfolio Investments. No adjustmentto financial assets and liabilities was required.(A)(B)InvestmentsFunds in excess of operational needs are invested with the Province of <strong>Manitoba</strong>, in accordance with Section 52(1)of The <strong>Manitoba</strong> <strong>Agricultural</strong> <strong>Services</strong> <strong>Corporation</strong> Act. Investments are carried at cost or amortized cost.Investments are normally held to maturity, but if early redemption is required and results in a gain or loss, thegain or loss is realized on disposal.Loans ReceivableLoans receivable are recorded at cost or amortized cost less any amount for provisions for credit losses.Provisions for impaired loans are made when collection is in doubt. Interest is accrued on loans receivableuntil the date of write-off. The provision represents management’s best estimate of probable losses. Wherecircumstances indicated doubt as to the ultimate collectability of principal or interest, specific provisionsare established for individual accounts. These accounts are valued at the lower of their recorded value or theestimated net realizable value of the security held for the accounts. In addition to the provision for loss on loansidentified on an individual loan basis, MASC establishes a general provision representing management’s bestestimate of additional probable losses based on other factors including the composition and credit quality of theportfolio and changes in economic and business conditions. Actual loan accounts that have been written off arecharged to the appropriate provision once the available security has been realized and all other collection effortshave been exhausted.Periodically the Province of <strong>Manitoba</strong> will approve special assistance loans with concessionary interest rates.These loans are discounted using the present value method when they involve significant concessionary elements.The discounted amount is expensed at the time the loans are disbursed and is amortized to revenue over the lifeof the concessionary terms.<strong>Manitoba</strong> <strong>Agricultural</strong> SeRVICes <strong>Corporation</strong> – <strong>2011</strong>/<strong>12</strong> Annual Report 35
(C)Claims PayableClaims payable is comprised of claims approved but not yet disbursed and a provision for claims in process.The provision represents management’s best estimate of probable claims against the programs and is determinedthrough a review of each program. For most programs, the provision is established by reviewing outstandingclaims and either providing individual claim estimates or establishing an average loss and multiplying thisamount by the number of claims outstanding.The provision for the Lake <strong>Manitoba</strong> Financial Assistance Program – Part C Lake <strong>Manitoba</strong> Business, Principaland Non-Principal Residence Component has the largest provision and was established by reviewing the separatecomponents, which are: flood mitigation, property damage to principal and non-principal residences; propertydamage and income loss for businesses; and the temporary accommodation costs for evacuated residents. Thelargest portion of the provision for Part C is for property damage to principal and non-principal residences. Thisprovision was established using: actual costs for claims that had been finalized by June 30, 20<strong>12</strong>; estimates ofrepair costs where the appraisal had been completed, but the claim had not yet been processed; and the resultsof a phone survey that requested the property owner to estimate the damage to their property as a percentage ofthe total value of the residence. The loss percentages from the phone survey were then multiplied by the buildingproperty tax assessment values inflated to account for the average amount that market values exceed the propertytax assessments. For the balance of properties where there was limited information on the amount of damage, theaverage loss for the above calculated properties was applied. In addition, a contingency was included for otherunknown damages, appeals, etc. If the property damage for principal and non-principal residences is incorrect bya factor of 10%, the resulting change in the provision would be $5.6 million.(D) Loans from the Province of <strong>Manitoba</strong>Loans from the Province of <strong>Manitoba</strong> are carried at cost.(E)Provision for Losses on Guaranteed LoansThe provision for losses on loan guarantees is determined <strong>annual</strong>ly through a review of each guarantee program.The provision represents management’s best estimate of probable claims against the loan guarantees. Suchprovision is intended to cover principal, accrued and unpaid interest and any additional amounts that arerecoverable by the financial institution that issued the loan.Current year provisions for guaranteed loan losses are charged as expenses to the provision for guaranteed loanlosses. Actual loan guarantee claims that have been paid are charged to the appropriate provision.(F)Future Employee BenefitsThe employees of MASC belong to The Civil Service Superannuation Pension Plan, which is a multi-employerjoint trustee plan. This plan is a defined benefit plan, providing a pension on retirement based on the member’sage at retirement, length of service and highest earnings averaged over five years. Inflation adjustments arecontingent upon available funding. The joint trustee board of the plan determines the required plan contributions<strong>annual</strong>ly.Pension costs included in these statements are comprised of: the cost of employer contributions for the currentyear of service of employees, employer costs for past service costs relating to a portion of current and retiredemployees, plan amendments and accrued benefits.MASC employees are entitled to vacation and severance pay in accordance with the terms of the collectiveagreements and corporate policy. The severance pay liability is recorded based on an actuarial valuation andvacation pay is recorded based on management’s best estimate.As a first time adopter as per PS2<strong>12</strong>5, MASC has elected to recognize all cumulative actuarial gains and losses asat the date of transition to Canadian PSA standards directly into accumulated surplus and amortizing subsequentgains and losses over EARSL.36<strong>Manitoba</strong> <strong>Agricultural</strong> SeRVICes <strong>Corporation</strong> – <strong>2011</strong>/<strong>12</strong> Annual Report
(G) Inventories Held for UseReal estate that was acquired for the purpose of providing long-term leases to producers through the Land LeaseOption Program is recorded at cost. Occasionally, real estate is acquired through foreclosure and voluntary transferof title in the settlement of loans and is recorded at the appraised value of the real estate at acquisition date.(H) Prepaid ExpensesPrepaid expenses are payments for goods or services, which will provide economic benefit in future periods. Theprepaid amount is recognized as an expense in the year the goods or services are consumed.(I)Tangible Capital AssetsMASC’s tangible capital assets are recorded at historical cost and amortized on a straight-line basis over theirestimated useful life, as follows:leasehold improvementsFurniture and equipmentComputer hardware and softwareMajor software developmentremaining term of lease10 years4 years8 years(J)Revenue RecognitionRevenues are recognized in the period in which the transactions or events occurred that gave rise to the revenues.All revenues are recorded on an accrual basis, except when the accruals cannot be determined with a reasonabledegree of certainty or when their estimation is impractical.Transfers (revenues from non-exchange transactions) are recognized as revenue when: the transfer is authorized,all eligible criteria are met, and a reasonable estimate of the amount can be made.(K)Premiums and Government ContributionsMASC recognizes as revenue all premiums earned on insurance policies in force during the year.The Canada-<strong>Manitoba</strong> AgriInsurance Agreement, which is consolidated in Annex B of Growing Forward: AFederal Provincial Territorial Framework Agreement on Agriculture, Agri-Food and Agri-Based Products Policy,provides for the cost sharing of AgriInsurance premiums. Premiums for most of the crop loss programs and basicExcess Moisture Insurance are shared between insured producers (40%), the Government of Canada (36%) andthe Province of <strong>Manitoba</strong> (24%).The exception is the Excess Moisture Insurance Zero Deductible Option, for which premiums are paid entirely byparticipating producers.(L)Administrative ExpensesIdentifiable administrative expenses for all of the programs administered by MASC are charged directly to thespecific program. Where the direct charging of administrative expenses to specific programs is not possible, theseexpenses are allocated to each program on a basis approved by MASC’s Board of Directors.The Canada-<strong>Manitoba</strong> AgriInsurance Agreement referred to in Section (K) of this note, stipulates that associatedadministrative expenses, net of any administrative revenues, will be shared by the Government of Canada (60%)and the Province of <strong>Manitoba</strong> (40%).(M) Financial InstrumentsMASC’s financial instruments include cash, receivables, investments, loans receivable, accounts payable andaccrued liabilities, claims payable, loans from the Province of <strong>Manitoba</strong> and provisions for losses on guaranteedloans.All financial instruments are held at cost or amortized cost. The effective interest method is used to recognizeinterest income or expense. Transaction costs related to all financial instruments are expensed as incurred.<strong>Manitoba</strong> <strong>Agricultural</strong> SeRVICes <strong>Corporation</strong> – <strong>2011</strong>/<strong>12</strong> Annual Report 37
(N) Measurement UncertaintyThe preparation of financial statements that conform with Canadian PSA standards requires management tomake estimates and assumptions that affect the <strong>report</strong>ed amounts of assets and liabilities and the disclosure ofcontingent assets and liabilities, all at the date of the financial statements; as well as the <strong>report</strong>ed amounts ofrevenues and expenses during the period. Items requiring the use of significant estimates include: provisions forlosses on accounts receivable, loans receivables, loan guarantees, liabilities for claims and program payments,future employee benefits and accrued administration liabilities.3. FINANCIAL STRUCTURE(A)(B)FundingThe Board of Directors approved MASC’s <strong>2011</strong>/<strong>12</strong> budget in April <strong>2011</strong>. Provincial funding for the approvedbudget of $98,410,000 was authorized by the Legislative Assembly. Other Programs, with the exception of theInspection <strong>Services</strong> component, do not contain the budgeted amounts.AgriInsurance and Hail Insurance Fund Balance RestrictionsThe AgriInsurance and Hail Insurance funds are restricted as set out in Sections 58 and 61 of The <strong>Manitoba</strong><strong>Agricultural</strong> <strong>Services</strong> <strong>Corporation</strong> Act. The only items to be paid out of these funds are: indemnities payable underthe contracts of insurance; premiums or other amounts payable for reinsurance; interest on any money borrowedfor the purpose of the funds; and expenses relating to the administration of the funds (for Hail Insurance only).4. FIRST TIME ADOPTION OF PUBLIC SECTOR ACCOUNTING STANDARDSIn previous fiscal years, MASC’s financial statements were presented in accordance with Canadian generally acceptedaccounting principles for profit oriented enterprises. The Public Sector Accounting Board has approved the accountingframework choices for other government organizations. Effective April 1, <strong>2011</strong>, MASC adopted Canadian Public SectorAccounting (PSA) standards.These new standards are required to be applied retroactively to the transition date of April 1, 2010; however MASC iselecting to adopt certain exemptions under PS2<strong>12</strong>5 as follows:- PS3250.061 requires actuarial gains and losses for future employee pension and severance benefits to be amortizedover a reasonable future period. MASC is electing to adopt PS2<strong>12</strong>5.10 and recognize all cumulative actuarial gainsand losses as the date of transition directly in the accumulated surplus/deficit.- PS3250.044 requires accrued benefit obligations for future employee pension and severance benefits to bedetermined by applying a discount rate with reference to its plan’s asset earnings or with reference to its cost ofborrowing. MASC is electing to adopt PS2<strong>12</strong>5.09 and delay the application of this section until the date of the nextactuarial valuation which will be within three years of the transition date.The adoption of these standards resulted in changes to the format of the financial statements. There was no impacton the accumulated surplus or net income <strong>report</strong>ed for the March 31, <strong>2011</strong> comparative period. The impacts of thesechanges on the format of the financial statements are as follows:38<strong>Manitoba</strong> <strong>Agricultural</strong> SeRVICes <strong>Corporation</strong> – <strong>2011</strong>/<strong>12</strong> Annual Report
a) Accounts receivable march 31, <strong>2011</strong> april 1, 2010Accounts receivable as per previous financial statements $ 19,565 $ 23,755Less: amounts reclassified from accounts receivable to receivables from the Province of <strong>Manitoba</strong> (9,684) (<strong>12</strong>,835)Less: amounts reclassified from accounts receivable to receivables from the Government of Canada (6,938) (6,625)Less: accrued investment interest reclassified to investments (8<strong>12</strong>) (364)$ 2,131 $ 3,931b) Receivables from the Province of <strong>Manitoba</strong> march 31, <strong>2011</strong> april 1, 2010Receivables from the Province of <strong>Manitoba</strong> as per previous financial statements $ - $ -Add: amounts reclassified from accounts receivable to receivables from the Province of <strong>Manitoba</strong> 9,684 <strong>12</strong>,835$ 9,684 $ <strong>12</strong>,835c) Receivables from the Government of Canada march 31, <strong>2011</strong> april 1, 2010Receivables from the Government of Canada as per previous financial statements $ - $ -Add: amounts reclassified from accounts receivable to receivables from the Government of Canada 6,938 6,625$ 6,938 $ 6,625d) Investments march 31, <strong>2011</strong> april 1, 2010Investments as per previous financial statements $ 349,415 $ 393,687Plus: accrued interest reclassified from accounts receivable to investments 8<strong>12</strong> 364$ 350,227 $ 394,051e) Reinsurance premiums payable march 31, <strong>2011</strong> april 1, 2010Reinsurance premiums payable as per previous financial statements $ 2,360 $ 2,549Less: amounts reclassified from reinsurance premiums payable to accounts payable and accrued liabilities (2,360) (2,549)$ - $ -f) Accounts payable and accrued liabilities march 31, <strong>2011</strong> april 1, 2010Accounts payable and accrued liabilities as per previous financial statements $ 20,715 $ 13,043Add: amounts reclassified from reinsurance premiums payable to accounts payable and accrued liabilities 2,360 2,549Less: amounts reclassified from accounts payable and accrued liabilities to future employee benefits (8,698) (8,239)Add: amounts reclassified from deferred revenue to accounts payable and accrued liabilities 232 267$ 14,609 $ 7,620g) Future employee benefits march 31, <strong>2011</strong> april 1, 2010Future employee benefits as per previous financial statements $ - $ -Plus: amounts reclassified from accounts payable to future employee benefits 8,698 8,239$ 8,698 $ 8,239h) Deferred revenue march 31, <strong>2011</strong> april 1, 2010Deferred revenue as per previous financial statements $ 232 $ 267Less: amounts reclassified from deferred revenue to accounts payable and accrued liabilities (232) (267)$ - $ -<strong>Manitoba</strong> <strong>Agricultural</strong> SeRVICes <strong>Corporation</strong> – <strong>2011</strong>/<strong>12</strong> Annual Report 39
5. WILDLIFE DAMAGE COMPENSATION PROGRAMMASC administers the Wildlife Damage Compensation Program, which pays producers for 90% (80% for <strong>2011</strong>) ofdamage to agricultural crops and related products caused by waterfowl or wildlife (big game animals), as well as for theinjury or death of domestic livestock caused by natural predators. The first 80% of compensation and all administrativeexpenses are shared by the Government of Canada (60%) and the Province of <strong>Manitoba</strong> (40%). The remaining 10% ofcompensation for 20<strong>12</strong> is paid by the Province of <strong>Manitoba</strong>.6. FARMLAND SCHOOL TAX REBATE PROGRAMIn April 2005, MASC became responsible for administering the Farmland School Tax Rebate Program. The purposeof the program is to assist <strong>Manitoba</strong> farmland owners by providing a rebate on the school tax paid on farmland.The rebate of 80% for the <strong>2011</strong> property tax year increased from a rebate of 75% for the 2010 tax year. The programprovides a three-year time frame for claiming rebates. Recorded rebate payments for the <strong>2011</strong> tax year of $36,548,000is comprised of $35,611,000 for the <strong>2011</strong> tax rebates and $937,000 for rebates relating to 2009 and 2010. Included in the<strong>2011</strong> tax rebates is a provision of $3,982,000 for rebates that had not been applied for as of March 31, 20<strong>12</strong>. A provisionof $1,860,000 remains for prior year rebates that remain unclaimed. The Province of <strong>Manitoba</strong> pays for the full cost ofthe Farmland School Tax Rebate Program.7. OTHER PROGRAMS(A)(B)(C)Inspection <strong>Services</strong>In support of <strong>Manitoba</strong>’s agricultural sector, MASC provides inspection services at a reasonable cost (i.e. on abreakeven basis). These services include: grain audits for cash advances issued by the Canadian Wheat Board,production loss assessments for windmill construction and maintenance, certificates of local production forvendors at the St. Norbert Farmers Market, third-party loss appraisals for private sector property insurers, andon-farm livestock inspections for the <strong>Manitoba</strong> Livestock Cash Advance Program. Such services totalled $68,000(<strong>2011</strong> - $44,000).Canada-<strong>Manitoba</strong> Feed and Transportation Assistance ProgramIn December 2010, MASC became responsible for the administration the Canada-<strong>Manitoba</strong> Feed andTransportation Assistance Program. The purpose of the program was to provide assistance to <strong>Manitoba</strong>producers who experienced a shortage of overwinter feed caused by extreme moisture in 2010. Funding as anAgriRecovery initiative was provided 60% by the Government of Canada and 40% by the Province of <strong>Manitoba</strong>.Compensation payments and administrative expenses were $9,767,000 and $444,000, respectively, for a total costof $10,211,000 ($208,000 in 20<strong>12</strong> and $10,003,000 in <strong>2011</strong>).Flood <strong>2011</strong> - Building and Recovery Action PlanIn May <strong>2011</strong>, MASC became responsible for the administration of the following flood assistance programsannounced under the Flood <strong>2011</strong> - Building and Recovery Action Plan. All funding for these programs wasprovided to MASC by the Province of <strong>Manitoba</strong>.a) Lake <strong>Manitoba</strong> Financial Assistance ProgramPart A - Lake <strong>Manitoba</strong> Pasture Flooding Assistance: This program assisted <strong>Manitoba</strong> livestock producersin managing their feed requirements needs due to the loss of pasture in the designated Lake <strong>Manitoba</strong> FloodZone.Part B - Lake <strong>Manitoba</strong> <strong>Agricultural</strong> Infrastructure, Transportation and Crop/Forage Loss: This programassisted agricultural producers with flood mitigation measures, lost crop production, damage to agriculturalinfrastructure and extra costs for feeding and transport of livestock in the Lake <strong>Manitoba</strong> Flood Zone.Part C - Lake <strong>Manitoba</strong> Business, Principal and Non-Principal Residence: This program compensatedresidents and businesses for the cost of uninsurable property damage and flood protection measures taken asa direct result of the elevated water levels in the Lake <strong>Manitoba</strong> Flood Zone.40<strong>Manitoba</strong> <strong>Agricultural</strong> SeRVICes <strong>Corporation</strong> – <strong>2011</strong>/<strong>12</strong> Annual Report
Part D - Lake <strong>Manitoba</strong> Flood Protection for Principal Residences, Non-Principal Residences andBusinesses: This program provided financial assistance for flood protection measures undertakenindividually or cooperatively for the purpose of protecting principal residences, non-principal residences andbusiness structures in the Lake <strong>Manitoba</strong> Flood Zone.b) Hoop and Holler Compensation ProgramThis program provided compensation to families, businesses and agricultural producers in the controlledrelease area of water from the Assiniboine River near the Hoop and Holler Bend on Highway 331 or overflowof water diverted from the Assiniboine River into the Portage Diversion. Compensation covered the cost ofproperty damage, income loss and flood protection measures.c) Dauphin River Flood Assistance ProgramThis program provided compensation to commercial fishers in the Dauphin River area for income lossesresulting from the inability to access their fishery and fish processing facilities.d) Lake Dauphin Emergency Flood Protection ProgramThis program provided financial assistance for emergency structural flood protection measures to protectprincipal residences and non-principal residences in the Lake Dauphin flood zone.e) Shoal Lakes <strong>Agricultural</strong> Flood Assistance ProgramThis program provided financial support to agricultural producers affected by chronic flooding in the ShoalLakes complex in the Interlake area of <strong>Manitoba</strong>. This program consisted of assistance for lost incomedue to flooded hay and pasture land in 2010 and <strong>2011</strong>, transportation assistance for movement of feedand/or animals, voluntary buy-out option for producers with flooded property and transition assistancefor producers that participate in the voluntary buy-out program. MASC did not administer the buy-outcomponent of this program.The table below outlines the total costs for each program as of March 31, 20<strong>12</strong>.Compensationactual payments to Provision for TotalProgram march 31, 20<strong>12</strong> payments compensation Administration* TotalLake <strong>Manitoba</strong> Financial Assistance ProgramPart A $ 2,653 $ 100 $ 2,753Part B 19,898 17,700 37,598Part C 19,876 64,000 83,876Part D 1,802 850 2,652$ 44,229 $ 82,650 $ <strong>12</strong>6,879 $ 10,057 $ 136,936Hoop and Holler Compensation Program 6,214 2,900 9,114 364 9,478Dauphin River Flood Assistance Program 1,847 <strong>12</strong>6 1,973 1 1,974Lake Dauphin Emergency Flood Protection Program 280 31 311 38 349Shoal Lakes <strong>Agricultural</strong> Flood Assistance Program 3,836 1,500 5,336 7 5,343$ 56,406 $ 87,207 $ 143,613 $ 10,467 $ 154,080*Includes provision for administration of claims in process and appeal commission expenses and is net of any interest revenue.(D) <strong>2011</strong> <strong>Manitoba</strong> AgriRecovery ProgramsIn June <strong>2011</strong>, MASC became responsible for the administration of the following assistance programs. Thepurpose of these programs was to provide financial assistance for the restoration, maintenance and therehabilitation of farms that have been impacted by excess moisture and flooding in <strong>2011</strong>.a) <strong>2011</strong> <strong>Manitoba</strong> Excess Moisture Assistance ProgramThis program provided financial assistance to farmers who could not seed a crop by June 20, <strong>2011</strong> or whohad an <strong>annual</strong> or newly seeded crop destroyed by flooding or excess moisture prior to September 15, <strong>2011</strong>.Producers received $30 per unseeded or drowned out crop acre. This program was partially funded by theGovernment of Canada under the Canada-<strong>Manitoba</strong> <strong>Agricultural</strong> Recovery Program. The Government ofCanada provided funding for 60% of the compensation payments (net of a deemed 5% deductible) and 60%<strong>Manitoba</strong> <strong>Agricultural</strong> SeRVICes <strong>Corporation</strong> – <strong>2011</strong>/<strong>12</strong> Annual Report 41
of the program‘s administrative expenses incurred from August 4, <strong>2011</strong> to March 31, 20<strong>12</strong>. The remainingprogram cost was paid by the Province of <strong>Manitoba</strong>. The total program cost of $108,745,000 was funded bythe Government of Canada ($61,897,400) and the Province of <strong>Manitoba</strong> ($46,847,600).b) <strong>2011</strong> <strong>Manitoba</strong> Transportation Assistance ProgramThis program provided livestock producers with financial assistance to deal with the extraordinary costsof transporting feed and animals due to the flooding and excess moisture conditions in <strong>2011</strong>. The programcovered breeding and market animals and provided for transportation costs for pasture and overwinterfeed shortages incurred from May 15, <strong>2011</strong> to March 31, 20<strong>12</strong>. This program was partially funded by theGovernment of Canada under the Canada-<strong>Manitoba</strong> <strong>Agricultural</strong> Recovery Program. The Government ofCanada provided 60% of the funding for the cost of transporting feed to breeding animals or transportingbreeding animals to feed relating only to producers’ pasture shortages. The Government of Canada paid 60%of the related administrative expenses. The remaining program cost was paid by the Province of <strong>Manitoba</strong>.The total program cost of $2,397,000 was funded the Government of Canada ($140,000) and the Province of<strong>Manitoba</strong> ($2,257,000).c) <strong>2011</strong> <strong>Manitoba</strong> Forage Shortfall Assistance ProgramThis program provided livestock producers with financial assistance to deal with extraordinary pasture andoverwinter feeding costs due to shortfalls in their forage production caused by flooding or excess moistureconditions in <strong>2011</strong>. The programs covered pasture and overwinter feed shortages. This program was partiallyfunded by the Government of Canada under the Canada-<strong>Manitoba</strong> <strong>Agricultural</strong> Recovery Program. TheGovernment of Canada provided 60% of the funding for feeding costs of breeding animals relating to pastureshortages and 60% of the related administrative expenses. The remaining cost was provided by the Province of<strong>Manitoba</strong>. The total program cost of $16,161,000 was funded the Government of Canada ($3,901,000) and theProvince of <strong>Manitoba</strong> ($<strong>12</strong>,260,000).d) <strong>2011</strong> <strong>Manitoba</strong> Forage Restoration Assistance ProgramThis program provided forage producers financial assistance to restore established tame forage and forageseed crops that have been damaged by excess moisture in <strong>2011</strong>. Producers were eligible for $50 for each acrethat is destroyed and reseeded to forage. This program was funded entirely by the Province of <strong>Manitoba</strong>($5,053,000).e) <strong>2011</strong> <strong>Manitoba</strong> Greenfeed Assistance ProgramThis program provided financial assistance to assist producers with seeding greenfeed acres by July 22, <strong>2011</strong>on fields that were left unseeded due to excess moisture. Producers were eligible for $15 per acre based on thenumber of acres of greenfeed in excess of their normal greenfeed acreage. This program was funded entirelyby the Province of <strong>Manitoba</strong> ($3,084,000).f) <strong>2011</strong> <strong>Manitoba</strong> Infrastructure and Individual Assessment ProgramThis program provided financial assistance to agricultural crop and livestock producers to recover fromflood losses related to mitigation and damage to agricultural property and inventory that are not eligible forassistance under Disaster Financial Assistance or the Flood <strong>2011</strong> - Building and Recovery Action Plan. Thisprogram was funded entirely by the Province of <strong>Manitoba</strong> ($5,946,000).The table below outlines the cost expended for each program as of March 31, 20<strong>12</strong>.Compensationactual payments to Provision for TotalProgram march 31, 20<strong>12</strong> payments compensation Administration* Total<strong>2011</strong> <strong>Manitoba</strong> Excess Moisture Assistance Program $ 107,572 $ 710 $ 108,282 $ 463 $ 108,745<strong>2011</strong> <strong>Manitoba</strong> Transportation Assistance Program 390 1,910 2,300 97 2,397<strong>2011</strong> <strong>Manitoba</strong> Forage Shortfall Assistance Program 7,361 8,400 15,761 400 16,161<strong>2011</strong> <strong>Manitoba</strong> Forage Restoration Assistance Program - 4,745 4,745 308 5,053<strong>2011</strong> <strong>Manitoba</strong> Greenfeed Assistance Program 2,836 67 2,903 181 3,084<strong>2011</strong> <strong>Manitoba</strong> Infrastructure and Individual Assessment Program 796 4,810 5,606 340 5,946$ 118,955 $ 20,642 $ 139,597 $ 1,789 $ 141,386*Includes provision for administration of claims in process and appeal committee expenses and is net of any interest revenue.42<strong>Manitoba</strong> <strong>Agricultural</strong> SeRVICes <strong>Corporation</strong> – <strong>2011</strong>/<strong>12</strong> Annual Report
8. ACCOUNTS RECEIVABLEAmounts from insured persons20<strong>12</strong> <strong>2011</strong>AgriInsurance Program $ 2,164 $ 2,677Hail Insurance Program 293 625Other 828 3023,285 3,604Less provision for credit losses (1,369) (1,473)$ 1,916 $ 2,131The provisions for credit losses of $1,369,000 (<strong>2011</strong> - $1,473,000) is for estimated losses on premiums, lease receivablesand overpayments, and is subject to measurement uncertainty. The provision estimate is formula based on an assessmentof the ability to collect the outstanding balance. A 100% provision is assessed on accounts in arrears over two years, withlower provisions for more recent years based on the programs’ actual collection experience over the last seven years.9. RECEIVABLES FROM THE PROVINCE OF MANITOBA20<strong>12</strong> <strong>2011</strong>AgriInsurance premiums $ 906 $ 1,886Administration 2,855 774Pension liability 6,439 6,406Severance liability 429 429Vacation pay liability 169 169Flood <strong>2011</strong> - Building and Recovery Action Plan (Note 7 (C)) 82,559 -<strong>2011</strong> <strong>Manitoba</strong> AgriRecovery programs (Note 7 (D)) 13,900 -Other programs 20 20$ 107,277 $ 9,684Pension liabilityThe Province of <strong>Manitoba</strong> has accepted responsibility for funding MASC’s pension liability (for pensionable serviceearned by employees of the former MACC prior to amalgamation on September 1, 2005) and related expense, whichincludes an interest component. MASC has therefore recorded a receivable from the Province of <strong>Manitoba</strong> equal to theestimated value of its actuarially determined pension liability of $6,439,000 as of March 31, 20<strong>12</strong> (<strong>2011</strong> - $6,406,000),and has recorded an increase under other contributions from the Province of <strong>Manitoba</strong> for <strong>2011</strong>/<strong>12</strong> equal to the relatedpension expense of $33,000 (<strong>2011</strong> - $432,000). The Province of <strong>Manitoba</strong> makes payments on the receivable when it isdetermined that the cash is required to discharge the related pension obligation.Severance pay liabilityThe amount recorded as a receivable from the Province of <strong>Manitoba</strong> for severance pay was initially based on the estimatedvalue of the corresponding actuarially determined liability for severance pay as of March 31, 1999. Subsequent to thatdate, the Province of <strong>Manitoba</strong> has included in its ongoing <strong>annual</strong> funding to MASC an amount equal to its share of thecurrent year’s expense for severance. As a result, the change in the severance liability each year is fully funded. The interestcomponent related to the receivable is reflected in the funding for severance pay expense. The receivable for severance paywill be paid by the Province of <strong>Manitoba</strong> when it is determined that the cash is required to discharge the related severancepay liabilities. As of March 31, 20<strong>12</strong>, the receivable for severance pay liability was $429,000 (<strong>2011</strong> - $429,000).<strong>Manitoba</strong> <strong>Agricultural</strong> SeRVICes <strong>Corporation</strong> – <strong>2011</strong>/<strong>12</strong> Annual Report 43
Vacation pay liabilityThe amount recorded as a receivable from the Province of <strong>Manitoba</strong> for vacation pay expenses was initially based on theestimated value of the corresponding liability as of March 31, 1999. Subsequent to that date, the Province of <strong>Manitoba</strong> hasincluded in its ongoing <strong>annual</strong> funding to MASC, an amount equal to its share of the current year’s expense for vacationpay entitlements. As of March 31, 20<strong>12</strong>, the receivable for vacation pay liability was $169,000 (<strong>2011</strong> - $169,000).10. RECEIVABLES FROM THE GOVERNMENT OF CANADA20<strong>12</strong> <strong>2011</strong>AgriInsurance Program $ 1,364 $ 4,157Wildlife Damage Compensation Program 10 389Other programs 4,285 2,392$ 5,659 $ 6,93811. INVESTMENTSMASC’s investments as of March 31, 20<strong>12</strong> consist of the following:20<strong>12</strong>average agriInsurance Hail Insurance Farmland School otherMaturity Terms interest Rate Program Program tax Rebate Program Programs Total90 days or less 0.893% $ 19,962 $ 29,000 $ 3,594 $ 15,590 $ 68,1461 year 1.074% 30,021 10,396 1,146 14,682 56,2452 years 1.738% 40,000 - - - 40,0003 years 1.413% - 13,000 - - 13,0005 years 3.033% - 13,600 - - 13,6001.311% 89,983 65,996 4,740 30,272 190,991Accrued Interest 209 238 3 34 484$ 90,192 $ 66,234 $ 4,743 $ 30,306 $ 191,475average agriInsurance Hail Insurance Farmland School otherMaturity Terms interest Rate Program Program tax Rebate Program Programs total90 days or less 0.919% $ 49,261 $ 16,046 $ 5,079 $ 3,114 $ 73,5001 year 1.045% 193,739 24,768 - 1,308 219,8152 years 1.738% 40,000 - - - 40,0003 years 2.225% - 5,000 - - 5,0005 years 3.513% - 11,100 - - 11,100<strong>2011</strong>1.193% 283,000 56,914 5,079 4,422 349,415Accrued Interest 605 195 5 7 8<strong>12</strong>$ 283,605 $ 57,109 $ 5,084 $ 4,429 $ 350,22744<strong>Manitoba</strong> <strong>Agricultural</strong> SeRVICes <strong>Corporation</strong> – <strong>2011</strong>/<strong>12</strong> Annual Report
<strong>12</strong>. LOANS RECEIVABLEMASC’s loans receivable as of March 31, 20<strong>12</strong> consist of the following:20<strong>12</strong> <strong>2011</strong>regular Special regular specialProgram Loans Assistance Loans* Total Program Loans assistance Loans* totalRecorded investment $ 291,273 $ 48,318 $ 339,591 $ 268,268 $ 63,159 $ 331,427Specific provision (4,017) (15,107) (19,<strong>12</strong>4) (5,782) (10,479) (16,261)General provision (2,879) (6,857) (9,736) (5,238) (7,062) (<strong>12</strong>,300)284,377 26,354 310,731 257,248 45,618 302,866Accrued interest 6,432 1,084 7,516 6,578 1,241 7,819Loan discounts - - - - (237) (237)Net carrying value $ 290,809 $ 27,438 $ 318,247 $ 263,826 $ 46,622 $ 310,448*Includes <strong>Manitoba</strong> Hog Assistance, BSE Recovery, Producer Recovery, Flood Proofing Assistance and Enterprise Development Loans.Impaired loans included in the preceding schedule:20<strong>12</strong> <strong>2011</strong>regular Special regular specialProgram Loans Assistance Loans* Total Program Loans assistance Loans* totalImpaired loan balance $ 20,510 $ 18,380 $ 38,890 $ 22,227 $ 14,865 $ 37,092Specific provision (4,017) (15,107) (19,<strong>12</strong>4) (5,782) (10,479) (16,261)$ 16,493 $ 3,273 $ 19,766 $ 16,445 $ 4,386 $ 20,831*Includes <strong>Manitoba</strong> Hog Assistance, BSE Recovery, Producer Recovery, Flood Proofing Assistance and Enterprise Development Loans.A loan becomes impaired as a result of deterioration in credit quality to the extent that MASC no longer has reasonableassurance of timely collection of the full amount of principal and interest. The table above provides the amount ofimpaired loans and the specific provision for credit losses on these loans as of March 31, 20<strong>12</strong>. A total of $2,241,000(<strong>2011</strong> - $1,889,000) of interest on impaired loans was included in revenue for the year ended March 31, 20<strong>12</strong>.Provisions for impaired loans:20<strong>12</strong> <strong>2011</strong>regular Special regular specialProgram Loans Assistance Loans* Total Program Loans assistance Loans* totalBeginning provision balance $ 11,020 $ 17,541 $ 28,561 $ <strong>12</strong>,280 $ 18,690 $ 30,970Write-offs, net of recoveries (1,220) (519) (1,739) (510) (438) (948)Provision (recovery) expense (2,904) 4,942 2,038 (750) (711) (1,461)Ending provision balance $ 6,896 $ 21,964 $ 28,860 $ 11,020 $ 17,541 $ 28,561*Includes <strong>Manitoba</strong> Hog Assistance, BSE Recovery, Producer Recovery, Flood Proofing Assistance and Enterprise Development Loans.Included in loans receivable is a specific provision of $19,<strong>12</strong>4,000 (<strong>2011</strong> - $16,261,000) and a general provision of$9,736,000 (<strong>2011</strong> - $<strong>12</strong>,300,000) that are subject to measurement uncertainty. The amount established for specific andgeneral provisions of $28,860,000 (see Note 2 (G)) could change substantially in the future, if factors considered bymanagement in establishing these estimates were to change significantly.Loans receivable are secured by tangible assets consisting predominantly of land followed by buildings, livestock andother assets. The estimated values of such tangible securities are $733,756,000 (<strong>2011</strong> - $ 734,757,000).<strong>Manitoba</strong> <strong>Agricultural</strong> SeRVICes <strong>Corporation</strong> – <strong>2011</strong>/<strong>12</strong> Annual Report 45
Remaining terms to maturities are as follows:20<strong>12</strong> <strong>2011</strong>regular Special regular specialProgram Loans Assistance Loans* Total Program Loans assistance Loans* totalLess than 5 years $ 41,880 $ 39,867 $ 81,747 $ 39,266 $ 20,249 $ 59,5155 years to up to 10 years 56,978 4,966 61,944 54,068 38,906 92,97410 years to up to 15 years 78,418 3,485 81,903 78,140 4,004 82,14415 years to up to 20 years 75,134 - 75,134 67,967 - 67,967More than 20 years 38,863 - 38,863 28,827 - 28,827Recorded investment $ 291,273 $ 48,318 $ 339,591 268,268 63,159 $ 331,427*Includes <strong>Manitoba</strong> Hog Assistance, BSE Recovery, Producer Recovery, Flood Proofing Assistance and Enterprise Development Loans.13. ACCOUNTS PAYABLE AND ACCRUED LIABILITIES20<strong>12</strong>hail Wildlife Damagelending agriInsurance insurance compensation otherPrograms Program Program Program Programs TotalAccounts payable - general $ 385 $ 5,191 $ - $ 383 $ 5,160 $ 11,119Salaries and benefits 39 335 - 4 3,<strong>12</strong>8 3,506Accrued vacation pay - 1,183 - - - 1,183Other 283 5,225 - - 14,550 20,058$ 707 $ 11,934 $ - $ 387 $ 22,838 $ 35,866<strong>2011</strong>hail Wildlife Damagelending agriInsurance insurance compensation otherPrograms Program Program Program Programs totalAccounts payable - general $ 502 $ 3,704 $ - $ 44 $ 334 $ 4,584Salaries and benefits 29 235 - - - 264Accrued vacation pay - 1,110 - - - 1,110Other 385 2,603 3 - 5,660 8,651$ 916 $ 7,652 $ 3 $ 44 $ 5,994 $ 14,60914. CLAIMS PAYABLE20<strong>12</strong> <strong>2011</strong>AgriInsurance Program $ 10,492 $ <strong>12</strong>,825Wildlife Damage Compensation Program 117 626Farmland School Tax Rebate Program 5,835 5,308Flood <strong>2011</strong> - Building and Recovery Action Plan (Note 7 (C))* 87,509 -<strong>Manitoba</strong> AgriRecovery Programs (Note 7 (D))* 20,697 -Other Programs - 2,405$ <strong>12</strong>4,650 $ 21,164*Includes claims approved but not paid and provisions for claims as outlined in the note references.46<strong>Manitoba</strong> <strong>Agricultural</strong> SeRVICes <strong>Corporation</strong> – <strong>2011</strong>/<strong>12</strong> Annual Report
15. LOANS FROM THE PROVINCE OF MANITOBAFollowing practices established by the Province of <strong>Manitoba</strong>, MASC must repay advances according to theamortization schedule or be subject to a prepayment penalty. The prepayment penalty is calculated as the net presentvalue of the future cash flows of the loan being prepaid minus the net present value of a loan with the same terms,except for the interest rate, which is equal to the rate for a semi-<strong>annual</strong> non-callable Province of <strong>Manitoba</strong> bond withthe same term to maturity. Advances are repayable in equal <strong>annual</strong> blended instalments of principal and interest, withinterest rates ranging from 1.425% to 7.625%.Maturities of principal over the following terms 20<strong>12</strong> <strong>2011</strong>1 year $ 75,851 $ 71,8992 years 40,819 48,1103 years 37,355 36,9404 years 33,847 33,2375 years 27,030 29,322More than 5 years 130,207 115,240$ 345,109 $ 334,74816. LOAN GUARANTEES AND CONTINGENCIES(A) Contingent liabilities and the corresponding provisions for MASC’s loan guarantee programs as ofMarch 31, 20<strong>12</strong> are shown below:20<strong>12</strong> <strong>2011</strong>Contingent Provision Net Contingent contingent Provision net Contingentliability for losses Liability liability for losses liabilityOperating Credit Guarantees for Agriculture $ 9,633 $ (963) $ 8,670 $ 10,613 $ (1,066) $ 9,547Operating Credit Guarantees for Rural Small Business 184 (19) 165 53 (5) 48<strong>Manitoba</strong> Livestock Associations Loan Guarantees 4,857 (971) 3,886 5,537 (1,108) 4,429Diversification Loan Guarantees 2,907 (436) 2,471 4,069 (610) 3,459Enhanced Diversification Loan Guarantees 53,099 (11,592) 41,507 58,831 (<strong>12</strong>,417) 46,414Rural Entrepreneur Assistance Program 11,262 (1,848) 9,414 - - -The change in the provision for guaranteed loan losses is as follows:$ 81,942 $ (15,829) $ 66,113 $ 79,103 $ (15,206) $ 63,89720<strong>12</strong> <strong>2011</strong>Beginning provision balance $ 15,206 $ 15,323Write-offs, net of recoveries (1,295) -Provision expense (recovery) 1,918 (117)Ending provision balance $ 15,829 $ 15,206The Operating Credit Guarantee for Agriculture Program was introduced in 2003, replacing the Guaranteed OperatingLoan Program. Participating lending institutions are provided a guarantee of 25% of the maximum authorized amountof each individual loan made under the program. The maximum allowable loan is $700,000 for individuals and$1,000,000 for partnerships, corporations and co-operatives.<strong>Manitoba</strong> <strong>Agricultural</strong> SeRVICes <strong>Corporation</strong> – <strong>2011</strong>/<strong>12</strong> Annual Report 47
The Operating Credit Guarantee for Rural Small Business Program was introduced in June 2009. Participating lendinginstitutions are provided a guarantee of 25% of the maximum authorized amount of each individual loan made underthe program. To be eligible for the program, <strong>annual</strong> sales have to be less than $2.0 million. The maximum allowableloan is $200,000.The <strong>Manitoba</strong> Livestock Associations Loan Guarantee Program was introduced in 1991. For each livestock association,MASC provides a 25% guarantee to the association’s lending institution, based on a maximum loan of $5,000,000 perassociation.The Diversification Loan Guarantee Program was introduced in 1995 to provide guarantees on loans made byparticipating lenders for diversification or farm value-added activities. Under this program, 25% of the lender’s totalassociated loan portfolio was guaranteed. The maximum allowable individual loan was $3.0 million.The Enhanced Diversification Loan Guarantee Program replaced the Diversification Loan Guarantee Program in 2001.Under the new program, guarantees are based on 25% of the original principal amount of each individual loan, with nomaximum loan amount.The Rural Entrepreneur Assistance (REA) Program provides a guarantee of up to 80% on loans made by participatinglenders to small rural non-agricultural businesses. REA guarantees loans up to a maximum of $200,000. Theadministration of this program was transferred to MASC from the Province of <strong>Manitoba</strong> in 2005 but the Provincemaintained the associated contingent liability until March 31, <strong>2011</strong>. As of April 1, <strong>2011</strong>, MASC assumed fullresponsibility for the REA Program including the contingent liability of $11,489,000 and the associated provision of$2,048,000. Upon the transfer to MASC, the provision was expensed to MASC’s provision for guaranteed loan losses.(B)Various legal actions for additional indemnity payments have been commenced by insured producers againstMASC. The outcome of these claims cannot be determined at this time.17. FUTURE EMPLOYEE BENEFITSSeverance LiabilityMASC’s employees are eligible for severance based on their years of service. Commencing March 31, 1999, MASCbegan recording the accumulated severance pay benefits. The amount of recorded severance pay obligation is based onactuarial calculations, which are carried out every three years.An actuarial valuation of the severance obligations as of March 31, <strong>2011</strong> was conducted by Ellement & Ellement. Thekey actuarial assumptions include an interest rate credited to obligations of return of 6.5% (2009 - 7.0%), severancerate of 0.72% of average salary of $59,978 for administration staff and 0.39% of average salary of $38,454 for adjustingstaff (2009 - 0.69% of average salary of $54,020 for administration staff and 0.43% of average salary of $36,294 foradjusting staff), and salary inflation rate increases of 2.75% (2009 - 3.25%). The accrued benefit cost method withsalary projection was used and the liabilities have been extrapolated to March 31, 20<strong>12</strong> using the formula providedby the actuary. The following table provides the calculation of the liability for severance benefits of $2,273,000 (<strong>2011</strong> -$2,226,000):20<strong>12</strong> <strong>2011</strong>Accrued severance liability – beginning of year $ 2,226 $ 2,228Experience loss (gain) - (165)Benefits accrued 84 87Interest on obligation 134 156Benefits paid (171) (80)Accrued severance liability – end of year $ 2,273 $ 2,22648<strong>Manitoba</strong> <strong>Agricultural</strong> SeRVICes <strong>Corporation</strong> – <strong>2011</strong>/<strong>12</strong> Annual Report
Pension LiabilityMASC’s employees are eligible for defined benefit pensions under The Civil Service Superannuation Act. MASCcontributes 50% of the pension disbursements made to retired employees of the former MACC for service up toSeptember 1, 2005. In addition, MASC has a pension liability for employees whose earnings are out of the scope of theCivil Service Superannuation Fund plan.Effective April 1, 1998, the former MCIC became a fully funded matching employer. Upon the formation of MASC, thecurrent pension obligations to the Civil Service Superannuation Board (CSSB) for former MCIC employees continuedto be matched by MASC.Prior to amalgamation, MACC did not match employees’ current service contributions, and instead contributed 50% ofthe pension disbursements made to retired employees. Starting September 1, 2005, the current pension contributionsfor former MACC employees have been matched. MASC accrues a provision for its liability for the pensionable servicethat was earned by former MACC employees prior to the amalgamation on September 1, 2005, which includes futurecost of living adjustments based on an actuarial valuation. The actuarial valuation was based on the projected methodprorated on services to be used. The Province of <strong>Manitoba</strong> provides funding for this liability (Note 9). Actuarial gains(losses) are amortized over the expected average remaining service life of the related employee group (20<strong>12</strong> - six years).As a matching employer, MASC discharges its pension liability on a current basis and, therefore, has no additionalpension obligation.Actuarial valuations are carried out every year to provide an estimate of the accrued liability for unfunded pensionbenefits. An actuarial valuation of the pension obligations as of December 31, 2010 was conducted by Ellement &Ellement. The key actuarial assumptions include a rate of return of 6.50% (2009 - 6.50%), inflation of 2.0% (2009 - 2.0%),salary inflation rate increases of 3.75% (2009 - 3.75%) and post-retirement indexing at two-thirds of the inflation rate.The projected benefit method prorated on services was used and the liabilities have been extrapolated toMarch 31, 20<strong>12</strong> using a formula provided by the actuary. The following table provides the calculation of theliability for pension benefits of $6,502,000 (<strong>2011</strong> - $6,472,000).20<strong>12</strong> <strong>2011</strong>Accrued pension liability – beginning of year $ 6,472 $ 6,011Experience (gain) loss (80) 288Benefits accrued 3 14Interest on obligation 395 420Benefits paid (288) (261)Accrued pension liability – end of year $ 6,502 $ 6,472Unamortized actuarial gains and losses (377) -Net liability 6,<strong>12</strong>5 6,47218. COMMITMENTS20<strong>12</strong> <strong>2011</strong>Approved, undisbursed loans $ 26,359 $ 14,408Estimated farm loan incentives 5,854 5,194Operating leases 158 119$ 32,371 $ 19,721<strong>Manitoba</strong> <strong>Agricultural</strong> SeRVICes <strong>Corporation</strong> – <strong>2011</strong>/<strong>12</strong> Annual Report 49
The estimated farm loan incentives are for the estimated future payments for the Young Farmer Rebate andManagement Training Credit programs. The Young Farmer Rebate is based on rebates of equal payments, which clientsearn in equal payments for the first five years of the loan, with the rebate being applied to the client’s loan balance. TheManagement Training Credit is credited to the loan once the eligible training has been completed.The operating lease commitments are for equipment and vehicles.19. TANGIBLE CAPITAL ASSETS20<strong>12</strong>Computerleasehold Furniture major Software hardwareimprovements and Equipment development and Software TotalCostBeginning of year $ 344 $ 419 $ 2,907 $ 426 $ 4,096Additions - 16 - 25 41Disposals and write-downs - (4) (2,907) (9) (2,920)344 431 - 442 1,217Accumulated amortizationBeginning of year 321 279 2,907 357 3,864Amortization expense 9 31 - 35 75Disposals and write-downs - (4) (2,907) (9) (2,920)330 306 - 383 1,019Net book value at March 31, 20<strong>12</strong> $ 14 $ <strong>12</strong>5 $ - $ 59 $ 198<strong>2011</strong>Computerleasehold Furniture major Software hardwareimprovements and Equipment development and Software totalCostBeginning of year $ 344 $ 399 $ 2,907 $ 439 $ 4,089Additions - 20 - 33 53Disposals and write-downs - - - (46) (46)344 419 2,907 426 4,096Accumulated amortizationBeginning of year 311 245 2,907 357 3,820Amortization expense 10 34 - 46 90Disposals and write-downs - - - (46) (46)321 279 2,907 357 3,864Net book value at March 31, <strong>2011</strong> $ 23 $ 140 $ - $ 69 $ 23250<strong>Manitoba</strong> <strong>Agricultural</strong> SeRVICes <strong>Corporation</strong> – <strong>2011</strong>/<strong>12</strong> Annual Report
20. FINANCIAL INSTRUMENTS AND FINANCIAL RISK MANAGEMENTFinancial instruments comprise the majority of MASC’s assets and liabilities. For its lending operations, MASCborrows from the Province of <strong>Manitoba</strong> at fixed interest rates and then provides fixed term loans to its clients at interestrates that generally earn a reasonable interest rate margin. For its insurance operations, MASC places the retainedfunds mainly in short-term investments, in order to have sufficient capital available to make insurance payments whenlosses exceed available funds in the current year (premium income plus interest revenue less reinsurance premiums).MASC’s risk management policies are designed to: identify and analyze risk, set appropriate risk limits and controls,and monitor the risks and adherence to limits by means of reliable and up-to-date information systems. The Board ofDirectors approves these policies and management is responsible for ensuring that the policies are properly carried out.The Board of Directors receives confirmation that the risks are being appropriately managed through regular <strong>report</strong>ing,third-party compliance <strong>report</strong>ing and by reviews conducted by MASC’s internal auditors.MASC is exposed to credit, liquidity and market risks in respect of its use of financial instruments.Credit RiskCredit risk is the risk that one party to a financial instrument fails to discharge an obligation and causes financial loss tothe counter party. The financial instruments that potentially subject MASC to credit risk consist principally of accountsreceivable, loans receivable and guarantees on loans. MASC’s investments are held by the Province of <strong>Manitoba</strong>, whichguarantees the associated payments of principal and interest.MASC’s maximum possible exposure to credit risk is as follows:20<strong>12</strong> <strong>2011</strong>Investments $ 191,475 $ 350,227Accounts receivable 1,916 2,131Receivables from the Province of <strong>Manitoba</strong> 107,277 9,684Receivables from the Government of Canada 5,659 6,938Loans receivable 318,247 310,448Loan guarantees 81,942 79,103$ 706,516 $ 758,531Investments - MASC is not exposed to significant credit risk as its investments are held by the Province of <strong>Manitoba</strong>,with the Province of <strong>Manitoba</strong> guaranteeing the associated payments of principal and interest.Accounts Receivable - MASC’s accounts receivable consist largely of insurance premiums due from participatingproducers. The insurance programs offer credit for producer premiums, which are due and payable at the time ofbilling. Interest is charged on premiums that are not paid by October 31 of that crop year, with March 31 being thefinal payment deadline. MASC terminates insurance contracts of producers who do not make acceptable paymentarrangements prior to the upcoming crop year. The importance of insurance programs to the financial well being of anongoing farming operation serves to mitigate the credit risk associated with insurance premiums.Receivables from the Province of <strong>Manitoba</strong> and the Government of Canada - MASC is not exposed to significantcredit risk as payment in full is typically collected when due.Loans Receivable - Impairment provisions are provided for losses that have been incurred as of the balance sheet date.Significant changes in the economic well being of <strong>Manitoba</strong>’s agricultural industry or deterioration in specific sectorsof the industry, which represent a concentration within MASC’s overall loan portfolio, may result in losses that differfrom those provided for at the balance sheet date. Management of credit risk is an integral part of MASC’s activities,with careful monitoring and appropriate remedial actions.<strong>Manitoba</strong> <strong>Agricultural</strong> SeRVICes <strong>Corporation</strong> – <strong>2011</strong>/<strong>12</strong> Annual Report 51
The Board of Directors is responsible for approving and monitoring MASC’s tolerance of credit exposures, whichit does through review and approval of the lending and guarantee program guidelines and setting limits on creditexposures to individual clients. MASC has comprehensive policy and procedures manuals in place for all lendingprograms.In general, MASC emphasizes responsible lending, which is comprised of a combination of adequate loan security anda client’s ability to pay. MASC is also mandated to deliver higher risk special assistance loan programs on behalf of theGovernment of <strong>Manitoba</strong>, which fall outside the normal limits set out in regular loan policies. These special assistanceloans have provisions for credit losses that are established by the Provincial Treasury Board. In addition, an increasedlevel of monitoring is carried out in an effort to mitigate losses. Special assistance loans make up 14% of the MASC’soverall lending portfolio.Summarized below are loans that are past due but not impaired.20<strong>12</strong> <strong>2011</strong>regular special regular specialProgram Loans Assistance Loans* Total Program Loans assistance Loans* totalLess than 1 year in arrears $ 3,620 $ 602 $ 4,222 $ 3,527 $ 1,044 $ 4,5711 to 2 years in arrears 1,092 697 1,789 2,918 701 3,619Over 2 years in arrears 17 - 17 24 53 77$ 4,729 $ 1,299 $ 6,028 $ 6,469 $ 1,798 $ 8,267*Includes <strong>Manitoba</strong> Hog Assistance, BSE Recovery, Producer Recovery, Flood Proofing Assistance and Enterprise Development Loans.Loans that are past due but not impaired are generally loans for which it is thought that the client has sufficient cashflow to meet their payment obligations and the loan is adequately secured. The majority of MASC’s term loans havesemi-<strong>annual</strong> payments and therefore a loan that is in the “Less than 1 year” category is generally only one payment inarrears. Two payments in arrears puts the loan in the “1 to 2 years” category. In addition, Stocker Loans, which provideshort-term financing for the purchase or retention of feeder cattle, are due at the end of the term, which is generallyone year. Any delay in the sale of the cattle at the end of the term may put the loan in arrears; however, these loans arenormally paid in full once the associated cattle are sold.MASC’s lending exposure to the various agricultural sectors, as provided in Note <strong>12</strong>, is summarized as follows:Loans Receivable by Economic Sector20<strong>12</strong> <strong>2011</strong>regular special regular specialProgram Loans Assistance Loans* Total Program Loans assistance Loans* totalGrains and oilseeds $ 169,943 $ 4,003 $ 173,946 $ 153,458 6,692 $ 160,150Potatoes 748 - 748 716 76 792Other crops 6,363 65 6,428 6,784 76 6,860Cattle 98,253 11,420 109,673 94,744 18,341 113,085Hogs 4,673 29,643 34,316 5,680 34,180 39,860Poultry 2,860 - 2,860 1,696 4 1,700Dairy 7,378 93 7,471 5,311 137 5,448Other 7,487 4,178 11,665 6,457 4,894 11,351Provisions and concessions (6,896) (21,964) (28,860) (11,020) (17,778) (28,798)$ 290,809 $ 27,438 $ 318,247 263,826 46,622 $ 310,448*Includes <strong>Manitoba</strong> Hog Assistance, BSE Recovery, Producer Recovery, Flood Proofing Assistance and Enterprise Development Loans.52<strong>Manitoba</strong> <strong>Agricultural</strong> SeRVICes <strong>Corporation</strong> – <strong>2011</strong>/<strong>12</strong> Annual Report
The Province of <strong>Manitoba</strong> provides funding for the full amount of loans that are written off; therefore, the loansreceivable risk to MASC is minimal.Loans Guarantees - MASC provides loan guarantees to financial institutions, which encourage the provision of creditthat the financial institutions consider to be higher risk. Each guarantee request is reviewed to assess its viability and toensure a fit within the established program parameters. Loan guarantees are approved based on a delegated approvalauthority. MASC’s loan guarantee activity involves five separate programs: Operating Credit Guarantees for RuralSmall Business and Rural Entrepreneur Assistance (REA), which are directed at non-agricultural businesses; <strong>Manitoba</strong>Livestock Associations Loan Guarantees, which are directed at the cattle industry; and Operating Credit Guaranteesfor Agriculture and Diversification Loan Guarantees, which are generally available to <strong>Manitoba</strong>’s agricultural industry.MASC’s loan guarantee exposure by agricultural sector is summarized below:Diversification Loanoperating Creditguaranteesguarantees20<strong>12</strong> <strong>2011</strong> 20<strong>12</strong> <strong>2011</strong>Grains and oilseeds - - 54% 56%Potatoes 3% 5% 16% <strong>12</strong>%Other crops 1% - 4% -Cattle - - 8% <strong>12</strong>%Hogs 44% 43% 13% 11%Poultry 8% 8% 1% 1%Dairy 42% 33% 1% 1%Other 2% 11% 3% 7%100% 100% 100% 100%The Province of <strong>Manitoba</strong> provides funding for all claims on loan guarantees resulting in minimal associated risk toMASC.Interest Rate RiskInterest rate risk is the risk that the fair value or future cash flows of a financial instrument will fluctuate due to changesin market interest rates. The interest rate exposure relates to investments, loans receivable, and advances from theProvince of <strong>Manitoba</strong>.Investments - MASC’s investment portfolio is mainly in short-term interest bearing investments. These investmentsare normally held to maturity so changes in interest rates do not affect the value of the investments. All of MASC’sinvestments are placed through <strong>Manitoba</strong> Finance.Loans Receivable/Loans from the Province of <strong>Manitoba</strong> - MASC borrows funds for lending operations from theProvince of <strong>Manitoba</strong> at fixed rates and normally lends those funds to clients at 1.5 percentage points above theassociated borrowing rate. All loans from the Province of <strong>Manitoba</strong> have fixed interest rates for the full term of theadvance and MASC only offers fixed interest rate loans to its clients. Due to this corresponding arrangement, MASCdoes not incur significant interest rate risk. However, some interest rate risk is imparted due to MASC’s lending policyof allowing prepayment of loans without penalty, given that MASC does not have the offsetting ability to prepay theassociated advances from the Province of <strong>Manitoba</strong> without penalty. MASC mitigates this risk by closely matchingthe cash flow from client loan payments, including estimated <strong>annual</strong> prepayments, to the cash flow required to repayadvances from the Province of <strong>Manitoba</strong>.<strong>Manitoba</strong> <strong>Agricultural</strong> SeRVICes <strong>Corporation</strong> – <strong>2011</strong>/<strong>12</strong> Annual Report 53
20<strong>12</strong>Scheduled Repaymentsnot InterestWithin 1 Year 1 to 5 Years 6 to 10 years over 10 Years rate Sensitive* TotalLoans receivable $ 49,907 111,813 82,630 95,241 (21,344) $ 318,247Yield 5.69% 5.80% 5.86% 5.90% 5.83%Due to the Province of <strong>Manitoba</strong> $ 75,851 139,051 86,006 44,201 - $ 345,109Yield 4.38% 4.58% 4.50% 4.<strong>12</strong>% 4.46%*Includes provisions for impaired loans and accrued interest.$ (25,944) (27,238) (3,376) 51,040 (21,344) $ (26,862)<strong>2011</strong>Scheduled Repaymentsnot InterestWithin 1 Year 1 to 5 Years 6 to 10 years over 10 Years rate Sensitive* totalLoans receivable $ 43,731 116,303 86,602 84,791 (20,979) $ 310,448Yield 5.81% 5.87% 5.93% 5.96% 5.89%Due to the Province of <strong>Manitoba</strong> $ 71,899 147,609 85,286 29,954 - $ 334,748Yield 4.70% 4.90% 4.99% 4.97% 4.89%*Includes provisions for impaired loans and accrued interest.$ (28,168) (31,306) 1,316 54,837 (20,979) $ (24,300)Liquidity RiskLiquidity risk relates to MASC’s ability to access sufficient funds to meet its financial commitments.Advances from the Province of <strong>Manitoba</strong> have a direct correlation to the loans receivable as the funds borrowed aredirectly lent to MASC clients. Funding is provided by the Province of <strong>Manitoba</strong> for the full amount of loans that arewritten off. Subsequently, MASC has minimal liquidity risk on its lending portfolio in respect of advances from theProvince of <strong>Manitoba</strong>.MASC’s primary liquidity risk relates to its liability for insurance claims. MASC does not have material liabilitiesthat can be called unexpectedly at the demand of a lender or client, and has no material commitments for capitalexpenditures, or need for same, in the normal course of business.Insurance claims payments are funded firstly out of current revenue, which normally exceeds cash requirements. Inaddition, insurance program funds are retained and placed in short-term investments, making such funds available topay claims in excess of current revenue. Private sector reinsurance is in place for AgriInsurance and Hail Insurance,providing significant protection against catastrophic losses. If all of the above are exhausted, the AgriInsuranceProgram has a reinsurance agreement with the Government of Canada and the Province of <strong>Manitoba</strong>, which providesfor unlimited additional funding for claim payments (Note 23). MASC also has the ability to borrow funds from theProvince of <strong>Manitoba</strong> for AgriInsurance and Hail Insurance, if required.54<strong>Manitoba</strong> <strong>Agricultural</strong> SeRVICes <strong>Corporation</strong> – <strong>2011</strong>/<strong>12</strong> Annual Report
21. ACTUARIAL REVIEWAn actuarial certification of MASC’s AgriInsurance Program was completed by Tillinghast - Towers Perrin, consultingactuaries, in March 2008. The actuarial review concluded that: the methodologies used to establish the probableyields for insured crops do not exceed productive capabilities; the premium rate methodologies are actuariallysound and therefore sufficient to meet expected claim costs over time; and that the program meets the financial selfsustainingcriteria as defined by the Government of Canada. Any program changes require actuarial review prior toimplementation.22. RELATED PARTY TRANSACTIONSMASC is related in terms of common ownership to all Province of <strong>Manitoba</strong> departments, agencies and Crowncorporations. MASC enters into transactions with these entities in the normal course of business. These transactionsare recorded at the exchange amount.Information is provided throughout these statements to disclose significant related party transactions MASC enteredinto, except for the following:20<strong>12</strong> <strong>2011</strong>Interest earned – Province of <strong>Manitoba</strong> $ 3,594 $ 3,265Interest paid on loans from the Province of <strong>Manitoba</strong> $ 15,857 $ 16,61923. REINSURANCE FUNDSAgriInsuranceIn accordance with the terms of the reinsurance agreement between the Government of Canada and the Province of<strong>Manitoba</strong>, the two levels of government maintain separate reinsurance accounts. MASC pays reinsurance premiumsto the Crop Reinsurance Fund of Canada for <strong>Manitoba</strong> and to the Crop Reinsurance Fund of <strong>Manitoba</strong>, based on theamount of premiums collected and the cumulative financial balance of the AgriInsurance Program.When indemnities paid to insured producers exceed the funds retained by MASC, after accounting for private sectorreinsurance recoveries, transfers are made from the reinsurance funds to MASC. Interest is not credited or charged tothe respective reinsurance funds by the Government of Canada or the Province of <strong>Manitoba</strong>. Surpluses in the CropReinsurance Fund of Canada for <strong>Manitoba</strong> and the Crop Reinsurance Fund of <strong>Manitoba</strong> are held by the Governmentof Canada and the Province of <strong>Manitoba</strong>, respectively. Federal-provincial reinsurance is essentially an agreement onhow to share any deficits in the AgriInsurance Program.Crop Reinsurance Fundof Canada for <strong>Manitoba</strong>crop Reinsurance Fundof <strong>Manitoba</strong>20<strong>12</strong> <strong>2011</strong> 20<strong>12</strong> <strong>2011</strong>Opening surplus (deficit) $ 4,939 $ 4,057 $ 26,958 $ 26,076Current year premium contributions (net)* 844 882 844 882Net book value $ 5,783 $ 4,939 $ 27,802 $ 26,958*Current year reinsurance premium contributions are shown net of an allowance for uncollectible accounts, which is a recovery of $5,000 (<strong>2011</strong> - $11,000 recovery).<strong>Manitoba</strong> <strong>Agricultural</strong> SeRVICes <strong>Corporation</strong> – <strong>2011</strong>/<strong>12</strong> Annual Report 55
In addition to the financial protection provided by federal-provincial reinsurance as noted above, MASC entered intoa one-year agreement with private sector reinsurers for <strong>2011</strong>/<strong>12</strong>. The agreement involves 28 reinsuring companiesassuming 100% of losses (including a deemed loss adjustment expense) from 15.0% to 27.5% of AgriInsuranceliability (coverage). Reinsurance premiums were $38,380,000 (<strong>2011</strong> - $28,716,000). There was a $9,000 private sectorreinsurance claim reversal reimbursement (<strong>2011</strong> - $14,000 claim reversal reimbursement) for outstanding prior yearclaims.Hail InsuranceFor <strong>2011</strong>/<strong>12</strong>, MASC entered into a one-year agreement with private sector reinsurers for the Hail InsuranceProgram. The agreement involves 15 reinsuring companies assuming 90% of hail insurance losses (including actualloss adjustment expenses) from 4.25% to 7.00% of hail insurance liability (coverage). Reinsurance premiums were$1,047,000 (<strong>2011</strong> - $1,273,000) with no reinsurance recoveries (<strong>2011</strong> - nil).24. COMPARATIVE FIGURESThe <strong>2011</strong> figures have been reclassified where necessary to conform to 20<strong>12</strong> presentation as outlined in Note 4.25. SUBSEQUENT EVENTSIn May 20<strong>12</strong>, the Government of Canada and the Province of <strong>Manitoba</strong> entered into the <strong>2011</strong> Canada-<strong>Manitoba</strong>Forage Shortfall and Restoration Assistance Initiative. This agreement provided for increased Government of Canadafunding for three of the <strong>2011</strong> <strong>Manitoba</strong> AgriRecovery Programs described in Note 7 (D). Increased federal funding wasprovided for the <strong>2011</strong> <strong>Manitoba</strong> Transportation Assistance Program and the <strong>2011</strong> <strong>Manitoba</strong> Forage Shortfall AssistanceProgram, as well as new federal funding for a portion of the <strong>2011</strong> <strong>Manitoba</strong> Forage Restoration Assistance Program.The additional federal contribution to these programs is estimated to be $6.2 million. No amounts have been accruedas of March 31, 20<strong>12</strong>, therefore funding for this program will be reflected in the March 31, 2013 financial statements.56<strong>Manitoba</strong> <strong>Agricultural</strong> SeRVICes <strong>Corporation</strong> – <strong>2011</strong>/<strong>12</strong> Annual Report
Schedule 1:Schedule of ADMINISTRATIVE ExpensesFor the year ended March 31, 20<strong>12</strong>(in thousands of dollars)20<strong>12</strong> <strong>2011</strong>Adjustors’ wages, benefits and expenses $ 7,690 $ 5,302Advertising 394 340Amortization expense 75 89Appeal Tribunal 2,965 33Audit fees and legal 302 228Directors’ remuneration and expense <strong>12</strong>2 <strong>12</strong>3Furniture and equipment 54 65Information technology 410 454Office rental and utilities 1,2<strong>12</strong> 1,089Other administrative expenses 2,019 783Other administrative recoveries (575) (514)Postage 206 195Printing and office supplies 359 207Salaries and employee benefits 14,544 11,687Telephone 305 214Travel and vehicle expenses 579 433Total administrative expenses $ 30,661 $ 20,728Administrative expenses allocation:Lending Programs 4,230 5,106AgriInsurance Program 10,940 11,054Hail Insurance Program 2,230 2,716Wildlife Damage Compensation Program 354 456Farmland School Tax Rebate Program 387 332Other Programs <strong>12</strong>,520 1,064Total administrative expenses $ 30,661 $ 20,728<strong>Manitoba</strong> <strong>Agricultural</strong> SeRVICes <strong>Corporation</strong> – <strong>2011</strong>/<strong>12</strong> Annual Report 57
Schedule 2:Schedule Of OPERATIONS And Accumulated SurplusFor the year ended March 31, 20<strong>12</strong>(in thousands of dollars)RevenueInsurance Premiumslending Programs AgriInsurance Program Hail Insurance Program20<strong>12</strong> <strong>2011</strong> 20<strong>12</strong> <strong>2011</strong> 20<strong>12</strong> <strong>2011</strong>Insured producers $ - $ - $ 71,060 $ 71,180 $ 16,215 $ 20,268Province of <strong>Manitoba</strong> - - 38,914 41,680 - -Government of Canada - - 58,375 62,521 - -- - 168,349 175,381 16,215 20,268Interest from loans 19,523 19,751 - - - -Other contributions - Province of <strong>Manitoba</strong> 5,188 5,071 4,274 4,441 - -Other contributions - Government of Canada - - 6,633 6,631 - -Investment income 79 113 2,366 2,528 993 768Other income 229 114 43 (14) - -Expense25,019 25,049 181,665 188,967 17,208 21,036Insurance indemnities and compensation payments - - 326,902 211,975 4,838 10,523Reinsurance premiums (Note 23) - - 40,064 30,470 1,047 1,273Interest on borrowed funds 15,857 16,619 - - - -Provision (recoveries) for credit losses 2,038 (1,461) 28 (542) (18) (4)Provision for guaranteed loan losses (Note 16) 1,918 117 - - - -Young farmer incentives 1,660 1,772 19 19 - -Farmland school tax rebates (Note 6) - - - - - -Other program payments (Note 7) - - - - - -Administrative expenses (Schedule 1) 4,230 5,106 10,940 11,054 2,230 2,716Total expenses 25,703 22,153 377,953 252,976 8,097 14,508Surplus (deficit) for the year (684) 2,896 (196,288) (64,009) 9,111 6,528Accumulated surplus (deficit), beginning of year (41,311) (44,207) 271,676 335,685 57,867 51,339Surplus (deficit), end of year $ (41,995) $ (41,311) $ 75,388 $ 271,676 $ 66,978 $ 57,86758<strong>Manitoba</strong> <strong>Agricultural</strong> SeRVICes <strong>Corporation</strong> – <strong>2011</strong>/<strong>12</strong> Annual Report
Wildlife DamageFarmland School Taxcompensation Program Rebate Program other Programs Total Total20<strong>12</strong> <strong>2011</strong> 20<strong>12</strong> <strong>2011</strong> 20<strong>12</strong> <strong>2011</strong> 20<strong>12</strong> <strong>2011</strong>$ - $ - $ - $ - $ - $ - $ 87,275 $ 91,448- - - - - - 38,914 41,680- - - - - - 58,375 62,521- - - - - - 184,564 195,649- - - - - - 19,523 19,7511,097 1,138 36,905 33,354 229,517 22,396 276,981 66,4001,300 1,707 - - 66,043 32,769 73,976 41,107- - 30 19 233 42 3,701 3,470- - - - 68 44 340 1442,397 2,845 36,935 33,373 295,861 55,251 559,085 326,52<strong>12</strong>,043 2,389 - - - - 333,783 224,887- - - - - - 41,111 31,743- - - - - - 15,857 16,619- - - 4 - - 2,048 (2,003)- - - - - - 1,918 117- - - - - - 1,679 1,791- - 36,548 33,037 - - 36,548 33,037- - - - 283,341 54,187 283,341 54,187354 456 387 332 <strong>12</strong>,520 1,064 30,661 20,7282,397 2,845 36,935 33,373 295,861 55,251 746,946 381,106- - - - - - (187,861) (54,585)- - - - - - 288,232 342,817$ - $ - $ - $ - $ - $ - $ 100,371 $ 288,232<strong>Manitoba</strong> <strong>Agricultural</strong> SeRVICes <strong>Corporation</strong> – <strong>2011</strong>/<strong>12</strong> Annual Report 59
LENDING CORPORATE OFFICEUnit 100-1525 First St SBrandon MB R7A 7A1INSURANCE CORPORATE OFFICE400-50-24th St NWPortage la Prairie MB R1N 3V960<strong>Manitoba</strong> <strong>Agricultural</strong> <strong>Services</strong> <strong>Corporation</strong> – <strong>2011</strong>/<strong>12</strong> Annual Report