Table 1: Summary of <strong>2011</strong>/<strong>12</strong> AgriInsuranceCrop Acres Insured Coverage (000) Total Premium (000) Indemnities (000) Loss Ratio (%)Red Spring Wheat 1,690,520 $346,446.7 $27,940.2 $30,037.4 108Durum Wheat 273 45.8 4.0 33.8 845Extra Strong Wheat 1,164 252.8 30.0 1.9 6Prairie Spring Wheat 2,037 381.9 51.6 79.5 154Hard White Wheat 14,772 2,976.4 215.7 3<strong>12</strong>.5 145Feed Wheat 26,709 3,617.5 452.2 477.1 106Winter Wheat 181,386 36,090.8 3,6<strong>12</strong>.4 3,364.2 93Barley 230,046 37,010.7 3,417.8 <strong>12</strong>,190.0 357Oats 398,496 78,831.0 7,776.9 15,483.8 199Mixed Grain 996 90.0 13.6 29.6 218Fall Rye 38,695 4,921.8 569.7 1,090.9 192Triticale 27 2.9 0.5 0.5 100Canola 2,528,284 659,287.5 56,270.9 70,948.6 <strong>12</strong>6Rapeseed 11,695 3,216.8 259.5 629.8 243Flax 83,482 18,250.3 2,068.9 5,073.8 245Mustard 1,137 146.2 30.9 110.1 356Oil Sunflowers 14,616 3,093.1 414.0 413.3 100Non Oil Sunflowers 19,207 6,094.9 1,081.7 589.7 55Buckwheat 2,639 294.7 73.5 78.5 107Grain Corn 170,487 47,439.9 9,422.8 1,685.7 18Silage Corn 32,309 9,237.6 679.4 1,151.3 170Potatoes 57,401 106,245.7 5,843.7 2,268.7 39Vegetables 1 1,535 4,4<strong>12</strong>.7 205.6 258.3 <strong>12</strong>6Field Peas 18,996 3,030.0 320.9 772.5 241Lentils 881 158.2 38.7 31.9 82Fababeans 1,986 330.1 66.2 135.2 204Dry Edible Beans 2 47,379 16,5<strong>12</strong>.5 2,540.8 519.6 21Soybeans 545,873 114,780.2 19,7<strong>12</strong>.7 7,222.9 37Tame Hay 3 263,066 23,<strong>12</strong>0.8 2,393.3 1,069.6 45Pasture - 1,781.2 205.8 49.0 24Pasture Days Pilot Program - 1,599.6 35.2 <strong>12</strong>1.0 344Native Hay 19,629 641.7 207.2 370.8 179Forage Establishment 37,876 2,037.6 363.0 185.3 51Strawberry Establishment - 23.6 1.4 - 0Saskatoon Establishment - 9.8 0.5 0.7 140Pedigreed Timothy Seed 11,277 1,257.7 238.1 44.0 19Alfalfa Seed <strong>12</strong>,302 2,956.0 733.6 271.1 37Canaryseed 9,762 1,896.8 289.5 732.1 253Annual Ryegrass Seed 1,147 209.5 32.2 19.0 59Perennial Ryegrass Seed 22,911 5,876.2 875.5 190.8 22Proso Millet Seed 1,676 214.8 44.9 - 0Tall Fescue Seed 1,888 3<strong>12</strong>.3 86.1 31.7 37Hemp Grain 2,753 498.3 81.8 101.2 <strong>12</strong>4Greenfeed 172,013 <strong>12</strong>,138.5 2,529.2 2,147.0 85Open Pollinated Corn 89 9.1 1.9 6.0 316Overwinter Bee Mortality - 3,057.6 238.4 - 0Estimate of Incomplete Claims - - - 4,275.3 -Subtotal 6,679,417 $1,560,839.8 $151,472.4 $164,605.7 109Excess Moisture Insurance 4 2,948,445 162,329.0 17,355.1 162,329.0 935Total 9,627,862 $1,723,168.8 $168,827.5 $326,934.7 1941 Vegetables include carrots, cooking onions, rutabagas, parsnips and Vegetable Acreage Loss Insurance.2 Dry edible beans includes white pea, pinto, black, kidney, cranberry, small red and other dry edible beans.3 Tame hay includes alfalfa, alfalfa /grass mixtures, grasses and sweet clover.4 Excess Moisture Insurance (EMI) acreage and coverage shown in the table is only for land that could not be seeded due to excess moisture and on which claims were paid. Total EMI insured acreage andcoverage were 8,980,937 and $499,613,<strong>12</strong>8, respectively.16<strong>Manitoba</strong> <strong>Agricultural</strong> SeRVICes <strong>Corporation</strong>
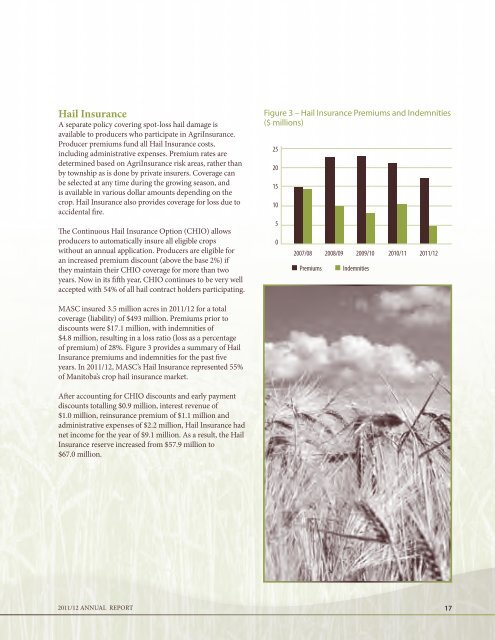
Hail InsuranceA separate policy covering spot-loss hail damage isavailable to producers who participate in AgriInsurance.Producer premiums fund all Hail Insurance costs,including administrative expenses. Premium rates aredetermined based on AgriInsurance risk areas, rather thanby township as is done by private insurers. Coverage canbe selected at any time during the growing season, andis available in various dollar amounts depending on thecrop. Hail Insurance also provides coverage for loss due toaccidental fire.The Continuous Hail Insurance Option (CHIO) allowsproducers to automatically insure all eligible cropswithout an <strong>annual</strong> application. Producers are eligible foran increased premium discount (above the base 2%) ifthey maintain their CHIO coverage for more than twoyears. Now in its fifth year, CHIO continues to be very wellaccepted with 54% of all hail contract holders participating.Figure 3 – Hail Insurance Premiums and Indemnities($ millions)25201510502007/08 2008/09 2009/10 2010/11 <strong>2011</strong>/<strong>12</strong>PremiumsIndemnitiesMASC insured 3.5 million acres in <strong>2011</strong>/<strong>12</strong> for a totalcoverage (liability) of $493 million. Premiums prior todiscounts were $17.1 million, with indemnities of$4.8 million, resulting in a loss ratio (loss as a percentageof premium) of 28%. Figure 3 provides a summary of HailInsurance premiums and indemnities for the past fiveyears. In <strong>2011</strong>/<strong>12</strong>, MASC’s Hail Insurance represented 55%of <strong>Manitoba</strong>’s crop hail insurance market.After accounting for CHIO discounts and early paymentdiscounts totalling $0.9 million, interest revenue of$1.0 million, reinsurance premium of $1.1 million andadministrative expenses of $2.2 million, Hail Insurance hadnet income for the year of $9.1 million. As a result, the HailInsurance reserve increased from $57.9 million to$67.0 million.<strong>2011</strong>/<strong>12</strong> Annual Report 17