

1pavWAH
1pavWAH
1pavWAH

Create successful ePaper yourself
Turn your PDF publications into a flip-book with our unique Google optimized e-Paper software.
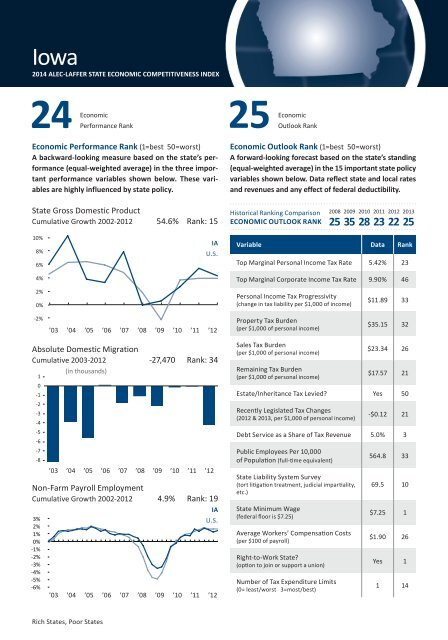
Iowa2014 ALEC-LAFFER STATE ECONOMIC COMPETITIVENESS INDEX24EconomicEconomicPerformance Rank25 OutlookRankEconomic Performance Rank (1=best 50=worst)A backward-looking measure based on the state’s performance(equal-weighted average) in the three importantperformance variables shown below. These variablesare highly influenced by state policy.Economic Outlook Rank (1=best 50=worst)A forward-looking forecast based on the state’s standing(equal-weighted average) in the 15 important state policyvariables shown below. Data reflect state and local ratesand revenues and any effect of federal deductibility.State Gross Domestic ProductCumulative Growth 2002-201212%54.6% Rank: 15Historical Ranking ComparisonECONOMIC OUTLOOK RANK2008 2009 2010 2011 2012 201325 35 28 23 22 2510%8%6%4%2%0%IAU.S.Variable Data RankTop Marginal Personal Income Tax Rate 5.42% 23Top Marginal Corporate Income Tax Rate 9.90% 46Personal Income Tax Progressivity(change in tax liability per $1,000 of income)$11.89 33-2%-4%Absolute Domestic MigrationCumulative 2003-2012(in thousands)10-1-2-3-4-5-6-7-8-9’03 ’04 ’05 ’06 ’07 ’08 ’09 ’10 ’11 ’12Non-Farm Payroll EmploymentCumulative Growth 2002-20123%2%1%0%-1%-2%-3%-4%-5%-6%’03 ’04 ’05 ’06 ’07 ’08 ’09 ’10 ’11 ’12-27,470 Rank: 344.9% Rank: 19IAU.S.’03 ’04 ’05 ’06 ’07 ’08 ’09 ’10 ’11 ’12Property Tax Burden(per $1,000 of personal income)Sales Tax Burden(per $1,000 of personal income)Remaining Tax Burden(per $1,000 of personal income)$35.15 32$23.34 26$17.57 21Estate/Inheritance Tax Levied? Yes 50Recently Legislated Tax Changes(2012 & 2013, per $1,000 of personal income)-$0.12 21Debt Service as a Share of Tax Revenue 5.0% 3Public Employees Per 10,000of Population (full-time equivalent)State Liability System Survey(tort litigation treatment, judicial impartiality,etc.)State Minimum Wage(federal floor is $7.25)Average Workers’ Compensation Costs(per $100 of payroll)Right-to-Work State?(option to join or support a union)Number of Tax Expenditure Limits(0= least/worst 3=most/best)564.8 3369.5 10$7.25 1$1.90 26Yes 11 14Rich States, Poor States