

1pavWAH
1pavWAH
1pavWAH

You also want an ePaper? Increase the reach of your titles
YUMPU automatically turns print PDFs into web optimized ePapers that Google loves.
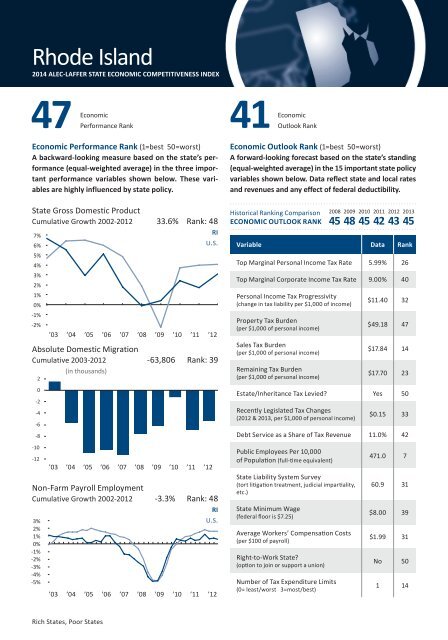
Rhode Island2014 ALEC-LAFFER STATE ECONOMIC COMPETITIVENESS INDEX47EconomicEconomicPerformance Rank41 OutlookRankEconomic Performance Rank (1=best 50=worst)A backward-looking measure based on the state’s performance(equal-weighted average) in the three importantperformance variables shown below. These variablesare highly influenced by state policy.State Gross Domestic ProductCumulative Growth 2002-20128%7%6%5%4%3%2%1%0%-1%-2%-3%Absolute Domestic MigrationCumulative 2003-20124(in thousands)20-2-4-6-8-10-12Non-Farm Payroll EmploymentCumulative Growth 2002-20123%2%1%0%-1%-2%-3%-4%-5%-6%33.6% Rank: 48RIU.S.’03 ’04 ’05 ’06 ’07 ’08 ’09 ’10 ’11 ’12-63,806 Rank: 39’03 ’04 ’05 ’06 ’07 ’08 ’09 ’10 ’11 ’12-3.3% Rank: 48RIU.S.’03 ’04 ’05 ’06 ’07 ’08 ’09 ’10 ’11 ’12Economic Outlook Rank (1=best 50=worst)A forward-looking forecast based on the state’s standing(equal-weighted average) in the 15 important state policyvariables shown below. Data reflect state and local ratesand revenues and any effect of federal deductibility.Historical Ranking ComparisonECONOMIC OUTLOOK RANK2008 2009 2010 2011 2012 201345 48 45 42 43 45Variable Data RankTop Marginal Personal Income Tax Rate 5.99% 26Top Marginal Corporate Income Tax Rate 9.00% 40Personal Income Tax Progressivity(change in tax liability per $1,000 of income)Property Tax Burden(per $1,000 of personal income)Sales Tax Burden(per $1,000 of personal income)Remaining Tax Burden(per $1,000 of personal income)$11.40 32$49.18 47$17.84 14$17.70 23Estate/Inheritance Tax Levied? Yes 50Recently Legislated Tax Changes(2012 & 2013, per $1,000 of personal income)$0.15 33Debt Service as a Share of Tax Revenue 11.0% 42Public Employees Per 10,000of Population (full-time equivalent)State Liability System Survey(tort litigation treatment, judicial impartiality,etc.)State Minimum Wage(federal floor is $7.25)Average Workers’ Compensation Costs(per $100 of payroll)Right-to-Work State?(option to join or support a union)Number of Tax Expenditure Limits(0= least/worst 3=most/best)471.0 760.9 31$8.00 39$1.99 31No 501 14Rich States, Poor States