Six Neighborhoods - City of Indianapolis and Marion County
Six Neighborhoods - City of Indianapolis and Marion County
Six Neighborhoods - City of Indianapolis and Marion County
- No tags were found...

Create successful ePaper yourself
Turn your PDF publications into a flip-book with our unique Google optimized e-Paper software.
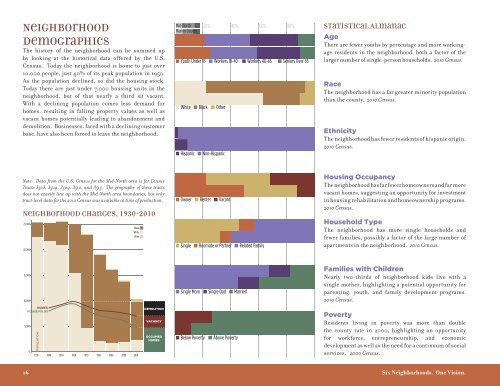
NeighborhoodDemographicsThe history <strong>of</strong> the neighborhood can be summed upby looking at the historical data <strong>of</strong>fered by the U.S.Census. Today the neighborhood is home to just over10,000 people, just 40% <strong>of</strong> its peak population in 1950.As the population declined, so did the housing stock.Today there are just under 7,000 housing units in theneighborhood, but <strong>of</strong> that nearly a third sit vacant.With a declining population comes less dem<strong>and</strong> forhomes, resulting in falling property values as well asvacant homes potentially leading to ab<strong>and</strong>onment <strong>and</strong>demolition. Businesses, faced with a declining customerbase, have also been forced to leave the neighborhood.Mid-North<strong>Marion</strong> <strong>County</strong>20% 40% 60% 80%Youth Under 18 Workers 18-40 Workers 40-65 Seniors Over 65White Black OtherHispanicNon-HispanicStatistical AlmanacAgeThere are fewer youths by percentage <strong>and</strong> more workingageresidents in the neighborhood, both a factor <strong>of</strong> thelarger number <strong>of</strong> single-person households. 2010 Census.RaceThe neighborhood has a far greater minority populationthan the county. 2010 Census.EthnicityThe neighborhood has fewer residents <strong>of</strong> hispanic origin.2010 Census.Note: Data from the U.S. Census for the Mid-North area is for CensusTracts 3503, 3504, 3509, 3510, <strong>and</strong> 3515. The geography <strong>of</strong> these tractsdoes not exactly line up with the Mid-North area boundaries, but onlytract-level data for the 2010 Census was available at time <strong>of</strong> production.Neighborhood Changes, 1930-201025,00020,000BlackWhiteOtherOwner Renter VacantSingle Roomate or Partner Related FamilyHousing OccupancyThe neighborhood has far fewer homeowners <strong>and</strong> far morevacant homes, suggesting an opportunity for investmentin housing rehabilitation <strong>and</strong> homeownership programs.2010 Census.Household TypeThe neighborhood has more single households <strong>and</strong>fewer families, possibly a factor <strong>of</strong> the large number <strong>of</strong>apartments in the neighborhood. 2010 Census.15,00010,000BLACK FLIGHTSingle Mom Single Dad MarriedFamilies with ChildrenNearly tw0-thirds <strong>of</strong> neighborhood kids live with asingle mother, highlighting a potential opportunity forparenting, youth, <strong>and</strong> family development programs.2010 Census.HOMESHOUSEHOLDS5,0000POPULATION1930 1940 1950 1960 1970 1980 1990 2000 2010DEMOLITIONVACANCYOCCUPIEDHOMESBelow PovertyAbove PovertyPovertyResidents living in poverty was more than doublethe county rate in 2000, highlighting an opportunityfor workforce, entrepreneurship, <strong>and</strong> economicdevelopment as well as the need for a continuum <strong>of</strong> socialservices. 2000 Census.16<strong>Six</strong> <strong>Neighborhoods</strong>. One Vision.