Experimental Study of Hot Deformability Of 1.2690 Tool Steel ... - RMZ
Experimental Study of Hot Deformability Of 1.2690 Tool Steel ... - RMZ
Experimental Study of Hot Deformability Of 1.2690 Tool Steel ... - RMZ

Create successful ePaper yourself
Turn your PDF publications into a flip-book with our unique Google optimized e-Paper software.
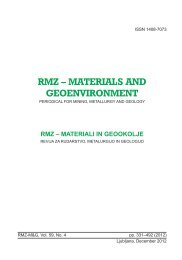
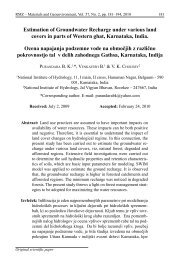
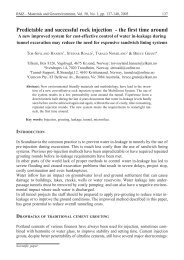
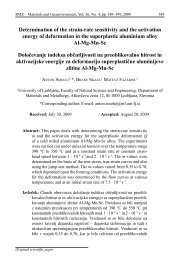
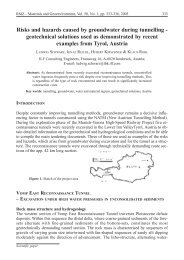
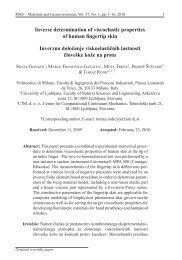
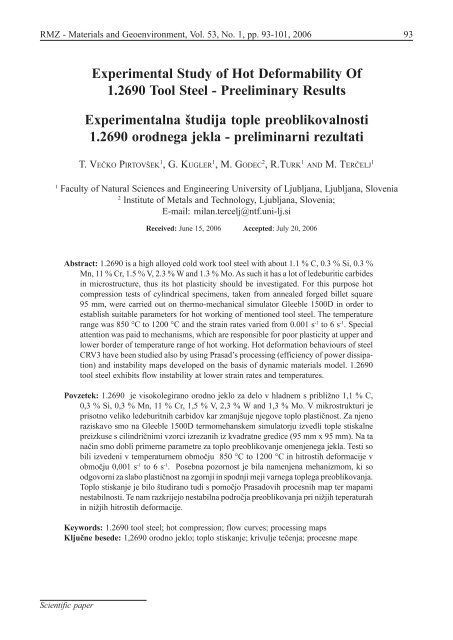
96 VEÈKO PIRTOVŠEK, T. ET AL.a) b)Figure 2: Stress-strain curves in the range <strong>of</strong> 850 °C to 1170 °C: (a) strain rate 0.01 s-1, (b)strain rate 1.0 s -1Figure 3: Dependence <strong>of</strong> the peak <strong>of</strong> flow stress on temperature for different strain rates(0.001 s -1 - 6 s -1 )plotted against the temperature for differentstrain rates in Figure 3. With decreasing<strong>of</strong> temperature in the temperature range1170 - 1000 °C and with increasing <strong>of</strong> strainrate the peaks <strong>of</strong> flow stress also increasealmost proportionally. This behaviourchanges at temperature 1000 °C; namely theincrease <strong>of</strong> peak <strong>of</strong> flow stress <strong>of</strong> strain rates0.001 s -1 - 0.1 s -1 is much higher in comparisonto strain rates 1 s -1 - 6 s -1 . Thus at 900 °Cthe peak value <strong>of</strong> strain rate <strong>of</strong> 0.1 s-1 exceedsthe peak value <strong>of</strong> strain rate 1 s-1 and at850 °C also the peak value <strong>of</strong> 6 s -1 .Influence <strong>of</strong> test parameters onmacro cracksThe sample deformed at 1200 °C andpresented on Figure 4a is completelydestroyed, while the sample deformed at1180 °C shows a lot <strong>of</strong> macroscopic surfacecracks occurring parallel to the direction <strong>of</strong>compression axis (Figure 4b). The samplesdeformed at temperatures 1160 °C, 1100 °C,1050 °C, 1000 °C, 950 °C, 900 °C and850 °C do not exhibit any cracks (Figure 4c),except a sample deformed at 850 °C and<strong>RMZ</strong>-M&G 2006, 53
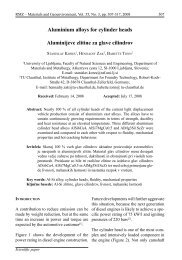
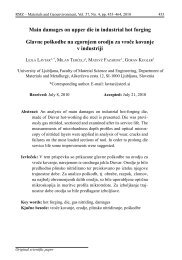
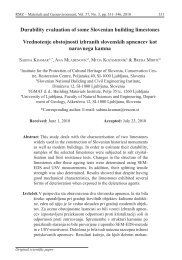
<strong>Experimental</strong> <strong>Study</strong> <strong>Of</strong> <strong>Hot</strong> <strong>Deformability</strong> <strong>Of</strong> <strong>1.2690</strong> <strong>Tool</strong> <strong>Steel</strong> - Preeliminary Results 97Figure 4: Macrograph <strong>of</strong> deformed samples (a) 1200 °C, strain rate 6 s -1 , (b) 1180 °C, strainrate 6 s -1 , (c) 1160 °C, strain rate 6 s -1 , (d) 850 °C, strain rate 0.01 s -1strain rate 0.01 s -1 (Figure 4d). This sampleexhibits typical surface cracks occurringparallel to the direction <strong>of</strong> the main stress.Influence <strong>of</strong> test parameters onmicrostructureThe microstructure <strong>of</strong> deformed and waterquenched samples is austenitic with differentcontents <strong>of</strong> martensite and carbides. Figure 5represents microstructures <strong>of</strong> some samplesdeformed at strain rates 6 s -1 and 0.01 s -1 . Ondeformation temperatures between 1160 °Cand 1200 °C the ledeburitic carbides dissolveto a great extent (Figures 5a-b). During thedeformation at temperature 1160 °C, aprecipitation <strong>of</strong> a thin layer <strong>of</strong> carbides alonggrain boundaries occurs (Figures 5b-c), andat higher temperatures, a new eutectic appears(Figure 5a). Melting on grain boundariescauses the weakening <strong>of</strong> grain boundaries andcracking <strong>of</strong> steel. At lower deformationtemperatures to about 1100 °C and at strainrate 6 s -1 , the microstructure is recrystallised,composed <strong>of</strong> equiaxial grains (Figure 5d). Atdeformation temperature 1050 °C, the crystalgrains are also equiaxial, but they are arrangedwithin the earlier deformed austenitic crystalgrains (Figure 5e). The majority <strong>of</strong> carbidesis arranged along the earlier deformed austeniticcrystal grains. For deformation temperatures1000 °C and lower, deformed initialaustenitic crystal grains and carbide precipitationalong them are typical (Figure 5f).The grain boundaries were not revealed byetching very well. At the strain rate 0.01 s -1 ,recrystallisation is running completely attemperature 1150 °C only (Figure 5g), whileat temperature 1050 °C deformed initialaustenitic crystal grains with some equiaxialcrystal grains within predominate (Figure 5h).During the cooling from the austenitizationtemperature and under 1000 °C the precipitation<strong>of</strong> secondary carbides alongaustenite grain boundaries takes place. Withdecreasing temperature the mentionedprecipitation process accelerates that causesan intensive weakening <strong>of</strong> primary grainboundaries. At temperature 1000 °C the<strong>RMZ</strong>-M&G 2006, 53
98 VEÈKO PIRTOVŠEK, T. ET AL.Figure 5: Microstructures <strong>of</strong> deformed samples: (a) 1200 °C, 6 s -1 , (b) 1160 °C, 6 s -1 , (c)1160 °C, 6 s -1 , (d) 1100 °C, 6 s -1 , (e) 1050 °C, 6 s -1 , (f) 850 °C, 6 s -1 , (g) 1150 °C, 0.01 s -1 , (h)1050 °C, 0.01 s -1 , (i) 950 °C, 0.01 s -1 , (j, k, l) 850 °C, 0.01 s -1precipitation <strong>of</strong> secondary carbides startsalong the deformed initial austenitic crystalgrains, which are getting clearer along withthe deformation temperature lowering(Figure 5i); at temperature 850 °C, it causesan intensive weakening <strong>of</strong> crystal boundariesresulting in intercrystalline cracks(Figures 5j-l).PROCESSING MAPProcessing map is developed on the basis <strong>of</strong>a dynamic material model (DMM) which hasbeen developed and widely used by the group<strong>of</strong> Y. V. R. K. PRASAD [6, 7] . The processing map<strong>of</strong> material can be described as an explicitrepresentation <strong>of</strong> its response to the imposedprocess parameters. It is a superimposition<strong>of</strong> the efficiency <strong>of</strong> power dissipation andan instability map.<strong>RMZ</strong>-M&G 2006, 53
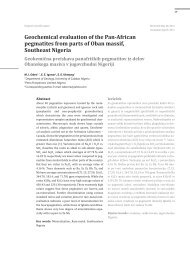
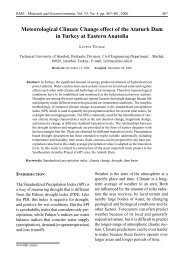
<strong>Experimental</strong> <strong>Study</strong> <strong>Of</strong> <strong>Hot</strong> <strong>Deformability</strong> <strong>Of</strong> <strong>1.2690</strong> <strong>Tool</strong> <strong>Steel</strong> - Preeliminary Results 99Efficiency <strong>of</strong> power dissipationThe workpiece under hot deformationconditions <strong>of</strong> this model works as an essentialenergy dissipater. The constituent equationdescribes the manner in which energy (P) isconverted at any instant into two forms,thermal energy (G) making temperatureincrease and microstructural change causedby transform <strong>of</strong> metallurgical dynamics (J),which are not recoverable. In general, most<strong>of</strong> the dissipation is due to a temperature riseand only a small amount <strong>of</strong> energy dissipatesthrough microstructural changes. The powerpartitioning between G and J is controlledby the constitutive flow behavior <strong>of</strong> thematerial and is decided by the strain ratesensitivity (m) <strong>of</strong> flow stress as shown in theEquation(1)For an ideal dissipator it can be shown thatboth quantities J and G are equal in theiramount, which means that m = 1 andJ = J maxwhereas the efficiency <strong>of</strong> powerdissipation η is given by:(2)The variation <strong>of</strong> η with temperature andrepresents the relative value <strong>of</strong> energydissipation occurring through microstructuralchanges. Microstructural changes can bestable, which includes a dynamic recoveryand dynamic recrystallization, and instablewhich includes wedge cracking, voidformation at hard particles, dynamic strainageing and macrostructural cracking. As newsurfaces will form during instable changes,more energy is required, while stable changesalways take place by grain boundarymigration.Flow instabilityThe instability map is defined by a stabilitycriterion for a dynamic material, where thedifferential quotient <strong>of</strong> its dissipativefunction has to satisfy an inequalitycondition, given by Equation 10, to allow astable flow.> 0 (3)Figures 6a-b represents processing andinstability contour map for temperature rangefrom 850 °C to 1160 °C and strain rates0.001 s -1 to 6 s -1 at strains 0.2 and 0.6. Themaps are relatively similar at various strains,but at all strains the instable zone withappears in the temperature range between850 °C and 970 °C at strain rates about0.1 s -1 - 0.01 s -1 . This also proves theFigure 4d and Figures 5k-l (brittle crackingon grain boundary due to precipitation <strong>of</strong>secondary phases). At lower strains theinstable zone moves towards lower strainrates and temperatures and at higher strainstowards higher strain rates and highertemperatures.<strong>RMZ</strong>-M&G 2006, 53
100 VEÈKO PIRTOVŠEK, T. ET AL.a) b)Figure 6: Superimposition <strong>of</strong> power dissipation map and instability map for temperaturerange from 850 °C to 1160 °C, strain rates 0.001 s -1 to 6.0 s -1 and at strains 0.2 (a) and 0.6 (b).DISCUSSIONThe optimal deformation conditions for steel<strong>1.2690</strong> are at temperatures between 1000 °Cand 1150 °C at strain rates 1.0 - 6.0 s -1 .Deformation at higher temperatures maycause incipient melting at grain boundariesand a dramatical drop <strong>of</strong> hot ductility. Theresult <strong>of</strong> deformation at temperaturesbetween 1160 and 1100 °C is a recrystallizedmicrostructure. At lower deformationtemperatures, recrystallization is notcompleted.During the cooling from the austenitizationtemperature and under 1000 °C the precipitation<strong>of</strong> secondary carbides along austenitegrain boundaries takes place. Especially thisprocess took place at lower strain rates thatresulted in higher peaks stress <strong>of</strong> flow curves.Lower strain rates and lower deformationtemperatures result in an accelerated precipitation<strong>of</strong> secondary carbides on grain boundariesand consequently, in increased flowcurves. Thus at lower temperature and strainrates higher flow stresses than those at higherstrain rates were obtained.The precipitation <strong>of</strong> secondary carbidescauses also a weakness <strong>of</strong> grain boundariesand cracking along them. Processing mapsware made for temperature range from 850°C to 1160 °C and for strain rates between0.001 s -1 and 6.0 s -1 . The high temperatureregion with appearance <strong>of</strong> incipient meltingat grain boundaries was not included in aprocessing and instability maps. Processingmaps at strains 0.2, 0.4 and 0.6 show thesome result as the investigation <strong>of</strong> microstructures<strong>of</strong> deformed samples. The instablezone appears at strain rates 0.1 s -1 - 0.01 s -1and deformation temperatures between 850and 970 °C, where an intensive precipitation<strong>of</strong> secondary carbides at grain boundariesoccurs.<strong>RMZ</strong>-M&G 2006, 53
<strong>Experimental</strong> <strong>Study</strong> <strong>Of</strong> <strong>Hot</strong> <strong>Deformability</strong> <strong>Of</strong> <strong>1.2690</strong> <strong>Tool</strong> <strong>Steel</strong> - Preeliminary Results 101CONCLUSIONThe optimum deformation conditions forsteel <strong>1.2690</strong> are at temperatures between1000 °C and 1150 °C at strain rates 1.0 - 6.0 s -1 .Deformation at higher temperatures maycause incipient melting at grain boundariesand a dramatical drop <strong>of</strong> hot ductility. Duringdeformation at temperatures below 1000 °Cand lower strain rate an intensive precipitation<strong>of</strong> secondary carbides at grainboundaries occurs and causes a strong workhardening and weakness <strong>of</strong> grain boundaries.The formerly mentioned secondaryprecipitation also results in a higher flowstress at lower strain rates in comparison t<strong>of</strong>low stress at higher strain rates. Theexperimental results also confirm thepredictions <strong>of</strong> processing maps about theposition <strong>of</strong> the instable zone.REFERENCES[1]C. A. C. IMBERT, G. J. MCQUEEN, <strong>Hot</strong> Ductility <strong>of</strong>tool <strong>Steel</strong>s, Canadian Metallurgical Quarterly,40/2 (2001) 235 – 244.[2]GAO SHAN, LIU XIANGHUA, WANG GUODONG, <strong>Study</strong>on <strong>Hot</strong> Deformation Cracks <strong>of</strong> <strong>Steel</strong> D2 UsingProcessing Map, J. Iron & <strong>Steel</strong> Res., Int., 4/2(1997) 44 - 49.[3]C. RODENBURG, M. KRZYZANOWSKI, J. H. BEYNON, W.M. RAINFORTH, <strong>Hot</strong> workability <strong>of</strong> spray-formedAISI M3:2 high-speed steel, Materials Scienceand Engineering A, 386 (2004) 420 - 427.[4]C. IMBERT, N. D. RYAN, H. J. MCQUEEN, <strong>Hot</strong> Workability<strong>of</strong> Three Grades <strong>of</strong> <strong>Tool</strong> <strong>Steel</strong>, MetallurgicalTransactions A, 15A (1984) 1855 - 1864.[5]Catalogue <strong>of</strong> <strong>Steel</strong> Properties <strong>of</strong> Metal Ravne Company.[6]Y. V. R. K. PRASAD, S. SASIDHARA, <strong>Hot</strong> WorkingGuide, Compendium <strong>of</strong> Processing Maps, ASM- International, pp. 1 - 24, OH, USA, 1997.[7]S. V. S. NARAYANA MURTY, B. NAGESWARA RAO, B. P.KASHYAP, Instability criteria for hot deformation<strong>of</strong> materials, International Materials Reviews,45/1(2000) 15 - 26.<strong>RMZ</strong>-M&G 2006, 53