STATISTCS EXAM 4 Review Chapters 7.3 â 7.4, 8.1, 9 - 10 1a. A ...
STATISTCS EXAM 4 Review Chapters 7.3 â 7.4, 8.1, 9 - 10 1a. A ...
STATISTCS EXAM 4 Review Chapters 7.3 â 7.4, 8.1, 9 - 10 1a. A ...

Create successful ePaper yourself
Turn your PDF publications into a flip-book with our unique Google optimized e-Paper software.
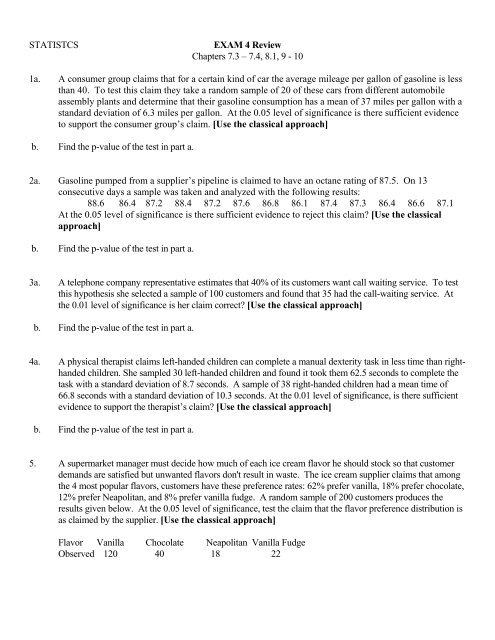
<strong>STATISTCS</strong><strong>EXAM</strong> 4 <strong>Review</strong><strong>Chapters</strong> <strong>7.3</strong> – <strong>7.4</strong>, <strong>8.1</strong>, 9 - <strong>10</strong><strong>1a</strong>. A consumer group claims that for a certain kind of car the average mileage per gallon of gasoline is lessthan 40. To test this claim they take a random sample of 20 of these cars from different automobileassembly plants and determine that their gasoline consumption has a mean of 37 miles per gallon with astandard deviation of 6.3 miles per gallon. At the 0.05 level of significance is there sufficient evidenceto support the consumer group’s claim. [Use the classical approach]b. Find the p-value of the test in part a.2a. Gasoline pumped from a supplier’s pipeline is claimed to have an octane rating of 87.5. On 13consecutive days a sample was taken and analyzed with the following results:88.6 86.4 87.2 88.4 87.2 87.6 86.8 86.1 8<strong>7.4</strong> 8<strong>7.3</strong> 86.4 86.6 87.1At the 0.05 level of significance is there sufficient evidence to reject this claim? [Use the classicalapproach]b. Find the p-value of the test in part a.3a. A telephone company representative estimates that 40% of its customers want call waiting service. To testthis hypothesis she selected a sample of <strong>10</strong>0 customers and found that 35 had the call-waiting service. Atthe 0.01 level of significance is her claim correct? [Use the classical approach]b. Find the p-value of the test in part a.4a. A physical therapist claims left-handed children can complete a manual dexterity task in less time than righthandedchildren. She sampled 30 left-handed children and found it took them 62.5 seconds to complete thetask with a standard deviation of 8.7 seconds. A sample of 38 right-handed children had a mean time of66.8 seconds with a standard deviation of <strong>10</strong>.3 seconds. At the 0.01 level of significance, is there sufficientevidence to support the therapist’s claim? [Use the classical approach]b. Find the p-value of the test in part a.5. A supermarket manager must decide how much of each ice cream flavor he should stock so that customerdemands are satisfied but unwanted flavors don't result in waste. The ice cream supplier claims that amongthe 4 most popular flavors, customers have these preference rates: 62% prefer vanilla, 18% prefer chocolate,12% prefer Neapolitan, and 8% prefer vanilla fudge. A random sample of 200 customers produces theresults given below. At the 0.05 level of significance, test the claim that the flavor preference distribution isas claimed by the supplier. [Use the classical approach]Flavor Vanilla Chocolate Neapolitan Vanilla FudgeObserved 120 40 18 22
6. Below are grades on the first test in a College Algebra class (x) and the student's final average in the course(y).X 82 82 40 94 88 78 92 76 64 66 80 76 28 64 54 42Y 84 74 30 92 88 58 91 70 57 70 86 77 24 62 68 40a. Construct a scatter diagram for these data.b. Calculate the coefficient of correlation.c. What percentage of variation in final average can be attributed to its relationship with first test grade?d. Find the equation of the least squares line.e. What is the expected final average if the grade on the first test is 75?ANSWERS<strong>1a</strong>. T.S.= -2.13, Reject H o b. p-value = 0.02332a. T.S.= -1.64, Fail to reject H o b. p-value = 0.12613a. T.S.= -1.02, Fail to reject H o b. 0.30784a. T.S. = -1.87, Fail to reject H o b. 0.03075. T.S.= 4.323, Fail to reject H o6b. r = 0.9332 c. 87.08%d. ŷ = 1.006x – 2.617 e. 72.8