Gostat: find statistically overrepresented Gene ... - Bioinformatics
Gostat: find statistically overrepresented Gene ... - Bioinformatics
Gostat: find statistically overrepresented Gene ... - Bioinformatics

Create successful ePaper yourself
Turn your PDF publications into a flip-book with our unique Google optimized e-Paper software.
BIOINFORMATICS APPLICATIONS NOTE<br />
Vol. 20 no. 9 2004, pages 1464–1465<br />
DOI: 10.1093/bioinformatics/bth088<br />
GOstat: <strong>find</strong> <strong>statistically</strong> <strong>overrepresented</strong> <strong>Gene</strong><br />
Ontologies within a group of genes<br />
Tim Beißbarth ∗ and Terence P. Speed<br />
ABSTRACT<br />
Summary: Modern experimental techniques, as for example<br />
DNA microarrays, as a result usually produce a long list of<br />
genes, which are potentially interesting in the analyzed process.<br />
In order to gain biological understanding from this type<br />
of data, it is necessary to analyze the functional annotations<br />
of all genes in this list. The <strong>Gene</strong>-Ontology (GO) database<br />
provides a useful tool to annotate and analyze the functions of<br />
a large number of genes. Here, we introduce a tool that utilizes<br />
this information to obtain an understanding of which annotations<br />
are typical for the analyzed list of genes. This program<br />
automatically obtains the GO annotations from a database and<br />
generates statistics of which annotations are <strong>overrepresented</strong><br />
in the analyzed list of genes. This results in a list of GO terms<br />
sorted by their specificity.<br />
Availability: Our program GOstat is accessible via the Internet<br />
at http://gostat.wehi.edu.au<br />
Contact: beissbarth@wehi.edu.au<br />
Ontologies are a widely used concept to create a controlled<br />
vocabulary to communicate and annotate knowledge. The<br />
<strong>Gene</strong> Ontology Consortium defines GO as an international<br />
standard to annotate genes (Ashburner et al., 2000). GO has<br />
a hierarchical structure starting with top-levels ontologies for<br />
molecular functions, biological processes and cellular components.<br />
The GO database consists of two essential parts, the<br />
current ontologies, which define the vocabulary and structure,<br />
and the current annotations, which create a link between the<br />
known genes and the associated GOs that define their function.<br />
Currently, many groups are working on the development<br />
of the ontologies and annotations for different organisms.<br />
All the information can be downloaded from the web-site<br />
http://www.geneontology.org<br />
Here, we would like to make use of the annotations<br />
and structure of the GOs in order to understand the biological<br />
processes present in a large dataset of genes. The<br />
usefulness of keyword hierarchies in interpreting large<br />
datasets has been demonstrated previously (Masys et al.,<br />
∗ To whom correspondence should be addressed.<br />
Walter and Eliza Hall Institute of medical Research, 1G Royal Parade, Parkville, Vic 3050,<br />
Australia<br />
Received on July 14, 2004; revised on December 1, 2003; accepted on December 4, 2003<br />
Advance Access publication February 12, 2004<br />
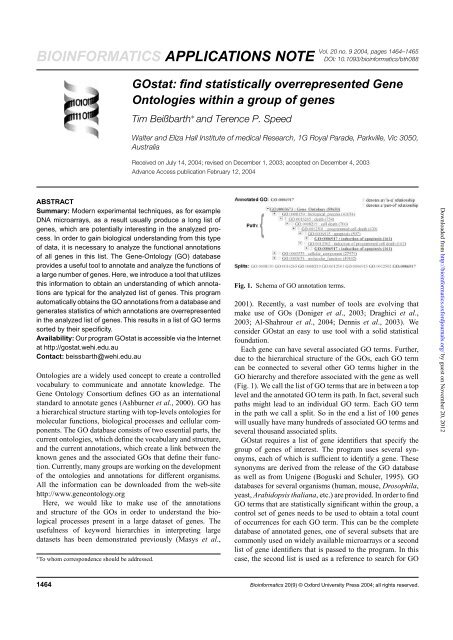
Fig. 1. Schema of GO annotation terms.<br />
2001). Recently, a vast number of tools are evolving that<br />
make use of GOs (Doniger et al., 2003; Draghici et al.,<br />
2003; Al-Shahrour et al., 2004; Dennis et al., 2003). We<br />
consider GOstat an easy to use tool with a solid statistical<br />
foundation.<br />
Each gene can have several associated GO terms. Further,<br />
due to the hierarchical structure of the GOs, each GO term<br />
can be connected to several other GO terms higher in the<br />
GO hierarchy and therefore associated with the gene as well<br />
(Fig. 1). We call the list of GO terms that are in between a top<br />
level and the annotated GO term its path. In fact, several such<br />
paths might lead to an individual GO term. Each GO term<br />
in the path we call a split. So in the end a list of 100 genes<br />
will usually have many hundreds of associated GO terms and<br />
several thousand associated splits.<br />
GOstat requires a list of gene identifiers that specify the<br />
group of genes of interest. The program uses several synonyms,<br />
each of which is sufficient to identify a gene. These<br />
synonyms are derived from the release of the GO database<br />
as well as from Unigene (Boguski and Schuler, 1995). GO<br />
databases for several organisms (human, mouse, Drosophila,<br />
yeast, Arabidopsis thaliana, etc.) are provided. In order to <strong>find</strong><br />
GO terms that are <strong>statistically</strong> significant within the group, a<br />
control set of genes needs to be used to obtain a total count<br />
of occurrences for each GO term. This can be the complete<br />
database of annotated genes, one of several subsets that are<br />
commonly used on widely available microarrays or a second<br />
list of gene identifiers that is passed to the program. In this<br />
case, the second list is used as a reference to search for GO<br />
1464 <strong>Bioinformatics</strong> 20(9) © Oxford University Press 2004; all rights reserved.<br />
Downloaded from<br />
http://bioinformatics.oxfordjournals.org/ by guest on November 20, 2012
Fig. 2. GOstat Output.<br />
terms, which are significantly more represented in the first list<br />
compared with the second.<br />
For all of the genes analyzed, GOstat will determine the<br />
annotated GO terms and all splits. The program will then<br />
count the number of appearances of each GO term for the<br />
genes in the group as well as in the reference group. For each<br />
GO term, a p-value is calculated representing the probability<br />
that the observed numbers of counts could have resulted<br />
from randomly distributing this GO term between the tested<br />
group and the reference group. A χ 2 test is used in order to<br />
approximate this p-value. If the expected value for any count<br />
is below 5, the χ 2 approximation is inaccurate. Therefore, we<br />
use Fisher’s Exact Test in these cases. The resulting list of<br />
p-values is sorted. The GO terms that are most specific for<br />
the analyzed list of genes will have the lowest p-values.<br />
As the number of GO terms for which we test significance<br />
is large, the computed p-values have to be corrected<br />
in order to control the rate of errors we expect with multiple<br />
testing (Shaffer, 1995; Dudoit et al., 2002). Two methods for<br />
correcting the p-value are offered in GOstat. The Holm correction<br />
controls the familywise error rate, e.g. selecting genes<br />
with a p-value below 0.1 we expect a 10% chance that any<br />
of the selected GO terms are not specific. The Benjamini and<br />
Hochberg correction controls the false discovery rate, e.g.<br />
selecting genes with a p-value below 0.1, we expect that 10%<br />
of the selected GO terms are not specific.<br />
However, there are dependences between various GO terms<br />
in the resulting list. Frequently, genes share more or less the<br />
same set of annotations, as several GO terms are indicative<br />
of the same process. Also, GO terms that are within one path<br />
have strongly correlated results. In order to make the resulting<br />
list of GO terms more interpretable, GOstat has the option<br />
to cluster the GO terms. In this process, GO terms that are<br />
annotated in the same set of genes or where one set of genes<br />
is a subset of the other are grouped.<br />
GOstat will result in a list of p-values that state how specific<br />
certain GO terms are for a given list of genes (Fig. 2).<br />
The output is sorted by the p-value and can be limited by<br />
GOstat<br />
various cutoff values. It is possible to display the over or<br />
underrepresented terms only. p-values of GO terms that are<br />
<strong>overrepresented</strong> in the dataset are typeset in green, p-values<br />
of underrepresented GO terms are colored red. GO terms<br />
that are annotated in more or less the same subsets of genes<br />
can be grouped together. GOstat will also output the complete<br />
list of the associations for the supplied genes to the<br />
annotated GO terms. The GO IDs in the output are linked<br />
to AmiGO, a visualization tool for the hierarchy in the GO<br />
database (http://www.godatabase.org). It is possible to format<br />
the output in HTML or as a tabular text.<br />
GOstat provides a useful tool in order to <strong>find</strong> biological<br />
processes or annotations characteristic of a group of genes.<br />
This is greatly helpful in analyzing lists of genes resulting from<br />
high-throughput screening experiments, such as microarrays,<br />
for their biological meaning.<br />
ACKNOWLEDGEMENTS<br />
Thanks to Joelle Michaud, Lavinia Hyde, Gordon Smyth<br />
and Hamish Scott for helpful suggestions and testing of<br />
the program. This work was funded by the Deutsche<br />
Forschungsgemeinschaft.<br />
REFERENCES<br />
Al-Shahrour,F., Diaz-Uriarte,R. and Dopazo,J. (2004) FatiGO: a web<br />
tool for <strong>find</strong>ing significant associations of <strong>Gene</strong> Ontology terms<br />
with groups of genes. <strong>Bioinformatics</strong>, 20, 578–580.<br />
Ashburner,M., Ball,C., Blake,J., Botstein,D., Butler,H., Cherry,J.,<br />
Davis,A., Dolinski,K., Dwight,S., Eppig,J. (2000) <strong>Gene</strong> ontology:<br />
tool for the unification of biology. The <strong>Gene</strong> Ontology<br />
Consortium. Nat. <strong>Gene</strong>t., 25, 25–29.<br />
Boguski,M. and Schuler,G. (1995) Establishing a human transcript<br />
map. Nat. <strong>Gene</strong>t., 10, 369–371.<br />
Dennis,G.,Jr, Sherman,B., Hosack,D., Yang,J., Gao,W., Lane,H.<br />
and Lempicki,R. (2003) DAVID: Database for Annotation,<br />
Visualization, and Integrated Discovery. Genome Biol., 4, P3.<br />
Doniger,S., Salomonis,N., Dahlquist,K., Vranizan,K., Lawlor,S.<br />
and Conklin,B. (2003) MAPPFinder: using <strong>Gene</strong> Ontology<br />
and GenMAPP to create a global gene-expression profile from<br />
microarray data. Genome Biol., 4, R7.<br />
Draghici,S., Khatri,P., Bhavsar,P., Shah,A., Krawetz,S. and<br />
Tainsky,M. (2003) Onto-Tools, the toolkit of the modern biologist:<br />
Onto-Express, Onto-Compare, Onto-Design and Onto-Translate.<br />
Nucleic Acids Res., 31, 3775–3781.<br />
Dudoit,S., Shaffer,J. and Boldrick,J. (2002) Multiple hypothesis testing<br />
in microarray experiments. Technical Report 110, Division of<br />
Biostatistics, UC Berkeley.<br />
Masys,D., Welsh,J., Fink,J.L., Gribskov,M., Klacansky,I. and<br />
Corbeil,J. (2001) Use of keyword hierarchies to interpret gene<br />
expression patterns. <strong>Bioinformatics</strong>, 17, 319–326.<br />
Shaffer,J. (1995) Multiple hypothesis testing. Annu. Rev. Psychol.,<br />
46, 561–584.<br />
1465<br />
Downloaded from<br />
http://bioinformatics.oxfordjournals.org/ by guest on November 20, 2012