Use of control charts in the production of concrete - ConcretOnline
Use of control charts in the production of concrete - ConcretOnline
Use of control charts in the production of concrete - ConcretOnline

Create successful ePaper yourself
Turn your PDF publications into a flip-book with our unique Google optimized e-Paper software.
<strong>Use</strong> <strong>of</strong> <strong>control</strong> <strong>charts</strong> <strong>in</strong> <strong>the</strong> <strong>production</strong> <strong>of</strong> <strong>concrete</strong>byIan Gibb and Tom HarrisonOctober 2010
<strong>Use</strong> <strong>of</strong> <strong>control</strong> <strong>charts</strong> <strong>in</strong> <strong>the</strong> <strong>production</strong> <strong>of</strong> <strong>concrete</strong>© 2010 The authors and MPA/BRMCA - ERMCOThe text is published on <strong>the</strong> understand<strong>in</strong>g that <strong>the</strong> authors are solely responsible for <strong>the</strong>statements made and op<strong>in</strong>ions expressed <strong>in</strong> it and that its publication does not necessarily implythat such statements and/or op<strong>in</strong>ions are <strong>of</strong> reflect <strong>the</strong> views or op<strong>in</strong>ions <strong>of</strong> <strong>the</strong> publishers. Whileevery effort has been made to ensure that <strong>the</strong> statements made and <strong>the</strong> op<strong>in</strong>ions expressed <strong>in</strong> thisPublication provide a safe and accurate guide, non liability or responsibility can be accepted <strong>in</strong> thisrespect by <strong>the</strong> authors or publishers.
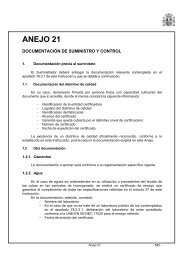
Table <strong>of</strong> ContentsSymbols1 Introduction2 Statistics for Concrete2.1 Normal distribution <strong>of</strong> strength2.2 Characteristic strength and target strength2.3 Standard deviation2.4 Sett<strong>in</strong>g <strong>the</strong> target strength3 Simple Data Charts4 Shewhart Charts4.1 Introduction4.2 Shewhart action criteria4.3 Control <strong>of</strong> standard deviation4.4 Example Shewhart chart4.5 Modified application <strong>of</strong> Shewhart <strong>control</strong> chart5 CUSUM5.1 Introduction5.2 Controll<strong>in</strong>g mean strength5.3 Controll<strong>in</strong>g standard deviation5.4 Controll<strong>in</strong>g correlation5.5 Design <strong>of</strong> V-mask5.6 Action follow<strong>in</strong>g change6 Multivariable and Multigrade Analysis6.1 Multivariable6.2 Multigrade7 Speed<strong>in</strong>g <strong>the</strong> Response <strong>of</strong> <strong>the</strong> System7.1 Early age test<strong>in</strong>g7.2 Family <strong>of</strong> mixes concept8 Guidance on Control Systems8.1 Abnormal results8.2 Handl<strong>in</strong>g mixes outside <strong>of</strong> <strong>the</strong> <strong>concrete</strong> family8.3 Handl<strong>in</strong>g mixes not <strong>control</strong>led by compressive strength requirements8.4 Test rates8.5 Action follow<strong>in</strong>g change9 EN 206-1 Conformity Rules for Compressive Strength9.1 Basic requirements for conformity <strong>of</strong> compressive strength9.2 Assessment period9.3 Conformity rules for compressive strength9.4 Achiev<strong>in</strong>g an AOQL <strong>of</strong> 5% with CUSUM9.5 Non-conformity10 Implement<strong>in</strong>g Control Systems <strong>in</strong> EN 206-111 CUSUM Example11.1 Reference mix and <strong>concrete</strong> family11.2 Ma<strong>in</strong> relationship11.3 Apply<strong>in</strong>g adjustments11.4 CUSUM calculation11.5 CUSUM action follow<strong>in</strong>g change11.6 Fur<strong>the</strong>r data and a change <strong>in</strong> standard deviation12 ReferencesPage 1 <strong>of</strong> 53
<strong>Use</strong> <strong>of</strong> <strong>control</strong> <strong>charts</strong> <strong>in</strong> <strong>the</strong> <strong>production</strong> <strong>of</strong> <strong>concrete</strong>SymbolsAOQAOQLf cif cmσkf ckL lnq nsUCLUWLLWLLCLC mraDIGdcx iAverage outgo<strong>in</strong>g qualityAverage outgo<strong>in</strong>g quality limitIndividual test result for compressive strength <strong>of</strong> <strong>concrete</strong>Mean compressive strength <strong>of</strong> <strong>concrete</strong>Estimate for <strong>the</strong> standard deviation <strong>of</strong> a populationStatistical constantSpecified characteristic compressive strengthLower limitNumber <strong>of</strong> samplesStatistical constant that depends upon n and <strong>the</strong> selected AOQLSample standard deviationUpper Control LimitUpper Warn<strong>in</strong>g LimitLower Warn<strong>in</strong>g LimitLower Control LimitConstant giv<strong>in</strong>g <strong>the</strong> cement content <strong>in</strong>crease required toproduce a 1N/mm 2 <strong>in</strong>crease <strong>in</strong> strengthDecision IntervalGradientChange <strong>in</strong> cement contentTest resultNOTE: Accord<strong>in</strong>g to EN 206-1, a test result may be <strong>the</strong> mean value <strong>of</strong> two ormore specimens taken from one sample and tested at one age.Mean value <strong>of</strong> ’n’ test resultsPage 2 <strong>of</strong> 53
<strong>Use</strong> <strong>of</strong> <strong>control</strong> <strong>charts</strong> <strong>in</strong> <strong>the</strong> <strong>production</strong> <strong>of</strong> <strong>concrete</strong>1 IntroductionIt is safe to assume that ever s<strong>in</strong>ce manufactur<strong>in</strong>g commenced, attempts havebeen made to <strong>control</strong> <strong>the</strong> process <strong>in</strong> order to improve quality and drive downcosts. The application <strong>of</strong> statistical techniques to manufactur<strong>in</strong>g was firstdeveloped by physicist Walter A. Shewhart <strong>of</strong> <strong>the</strong> Bell Telephone Laboratories<strong>in</strong> 1924. Shewhart cont<strong>in</strong>ue to develop <strong>the</strong> idea and <strong>in</strong> 1931 he published abook on statistical quality <strong>control</strong> [1].Shewhart recognised that with<strong>in</strong> a manufactur<strong>in</strong>g process <strong>the</strong>re were not onlynatural variations <strong>in</strong>herent <strong>in</strong> <strong>the</strong> process, which affected quality but <strong>the</strong>rewere also variations that could not be expla<strong>in</strong>ed. Shewhart recognised that itis possible to set limits on <strong>the</strong> natural variation <strong>of</strong> any process so thatfluctuations with<strong>in</strong> <strong>the</strong>se limits could be expla<strong>in</strong>ed by chance causes, but anyvariation outside <strong>of</strong> <strong>the</strong>se limits, special variations, would represent a change<strong>in</strong> <strong>the</strong> underly<strong>in</strong>g process.Shewhart’s concept <strong>of</strong> natural and special variations is clearly relevant to <strong>the</strong><strong>production</strong> <strong>of</strong> <strong>concrete</strong> at a ready-mixed plant or precast factory and <strong>the</strong>requirement to achieve a specified compressive strength. Natural variationsexist <strong>in</strong> <strong>the</strong> process due to variation <strong>in</strong> <strong>the</strong> raw materials (aggregate grad<strong>in</strong>g,chemical composition etc), batch<strong>in</strong>g accuracy, plant performance, sampl<strong>in</strong>gand test<strong>in</strong>g etc. Special causes <strong>of</strong> variation, outside <strong>of</strong> <strong>the</strong> natural variationscould be due to changed constituent materials be<strong>in</strong>g used, weigh-scales los<strong>in</strong>gaccuracy, a new batcher, problems with test<strong>in</strong>g equipment etc.Control <strong>charts</strong> have found widespread use <strong>in</strong> <strong>the</strong> <strong>concrete</strong> <strong>in</strong>dustry <strong>in</strong> bothready-mixed <strong>concrete</strong> and precast <strong>concrete</strong> sectors as a tool for quality<strong>control</strong>. Control <strong>charts</strong> can be applied to monitor a range <strong>of</strong> productcharacteristics (e.g. cube/cyl<strong>in</strong>der strength, consistence, w/c ratio),constituent materials (aggregate grad<strong>in</strong>g, cement strengths etc.) or <strong>production</strong>(batch<strong>in</strong>g accuracy).Their most common application <strong>of</strong> <strong>control</strong> <strong>charts</strong> is as a means <strong>of</strong> cont<strong>in</strong>uouslyassess<strong>in</strong>g compressive strength results <strong>in</strong> order to:- check whe<strong>the</strong>r target strengths are be<strong>in</strong>g achieved;- measure <strong>the</strong> variations from target (all products vary);- identify magnitude <strong>of</strong> any variation;- objectively def<strong>in</strong>e action required (e.g. change w/c ratio) to get <strong>the</strong>process back on target;- identify periods and <strong>concrete</strong>s where <strong>the</strong> strength was less thanspecified, so that <strong>in</strong>vestigations can be carried out and corrective actiontaken.The use <strong>of</strong> <strong>control</strong> <strong>charts</strong> should not be treated <strong>in</strong> isolation from <strong>the</strong> rest <strong>of</strong><strong>production</strong> <strong>control</strong>. For example rout<strong>in</strong>e check<strong>in</strong>g and ma<strong>in</strong>tenance <strong>of</strong> weighequipment will m<strong>in</strong>imise <strong>the</strong> risk <strong>of</strong> a weigh-scale failure. Control <strong>charts</strong>provide <strong>in</strong>formation about <strong>the</strong> process, but <strong>the</strong> <strong>in</strong>terpretation <strong>of</strong> <strong>the</strong><strong>in</strong>formation is not a mechanical process. All <strong>the</strong> <strong>in</strong>formation available to <strong>the</strong><strong>concrete</strong> producer should be used to <strong>in</strong>terpret <strong>the</strong> <strong>in</strong>formation and make<strong>in</strong>formed decisions. Did a change <strong>in</strong> quality occur when a new batch <strong>of</strong>constituent was first used? Is all <strong>the</strong> family show<strong>in</strong>g <strong>the</strong> same trend? Are o<strong>the</strong>rPage 3 <strong>of</strong> 53
<strong>Use</strong> <strong>of</strong> <strong>control</strong> <strong>charts</strong> <strong>in</strong> <strong>the</strong> <strong>production</strong> <strong>of</strong> <strong>concrete</strong>plants us<strong>in</strong>g similar materials show<strong>in</strong>g a similar trend? Such <strong>in</strong>formation leadsto <strong>the</strong> cause <strong>of</strong> <strong>the</strong> change <strong>in</strong> quality be<strong>in</strong>g identified and appropriate actionbe<strong>in</strong>g taken. For example a loss <strong>of</strong> accuracy <strong>in</strong> <strong>the</strong> weigh-scales should lead torepair, ma<strong>in</strong>tenance and re-calibration and not a change <strong>in</strong> mix proportions.Where a change <strong>in</strong> mix proportions is required, <strong>the</strong> use <strong>of</strong> <strong>control</strong> <strong>charts</strong> canlead to objectively def<strong>in</strong>ed changes <strong>in</strong> proportions.Effective <strong>control</strong> <strong>of</strong> <strong>concrete</strong> <strong>production</strong> is more easily achieved when <strong>the</strong>reare good relationships with <strong>the</strong> constituent material suppliers, particularly <strong>the</strong>suppliers <strong>of</strong> cementitious materials. Early warn<strong>in</strong>g <strong>of</strong> a change <strong>in</strong> performancefrom <strong>the</strong> constituent material supplier should be part <strong>of</strong> <strong>the</strong> supply agreement,e.g. that stock cl<strong>in</strong>ker is be<strong>in</strong>g used dur<strong>in</strong>g <strong>the</strong> ma<strong>in</strong>tenance period, and on <strong>the</strong>basis <strong>of</strong> this warn<strong>in</strong>g, <strong>the</strong> producer will decide <strong>the</strong> appropriate action.Some producers use changes <strong>in</strong> cement chemistry to predict changes <strong>in</strong><strong>concrete</strong> strength. Effective <strong>production</strong> <strong>control</strong> is about us<strong>in</strong>g all this<strong>in</strong>formation to produce <strong>concrete</strong> conform<strong>in</strong>g to its specification. Effective<strong>production</strong> <strong>control</strong>, which <strong>in</strong>cludes <strong>the</strong> use <strong>of</strong> <strong>control</strong> <strong>charts</strong>, significantlyreduces <strong>the</strong> risk <strong>of</strong> non-conformity benefit<strong>in</strong>g both users and producers <strong>of</strong><strong>concrete</strong>.There are drawbacks to <strong>the</strong> exist<strong>in</strong>g method <strong>of</strong> assessment <strong>of</strong> conformity <strong>of</strong>mean strength adopted <strong>in</strong> EN 206-1 <strong>in</strong>clud<strong>in</strong>g not follow<strong>in</strong>g <strong>the</strong> CEN Guidanceon <strong>the</strong> evaluation <strong>of</strong> conformity [2]. It is believed that <strong>control</strong> <strong>charts</strong> (alreadywidely used as a quality assurance tool <strong>in</strong> factory <strong>production</strong> <strong>control</strong>) wouldprovide an alternative and better means <strong>of</strong> ensur<strong>in</strong>g <strong>the</strong> characteristic strengthis achieved and it is a method that follows <strong>the</strong> CEN Guidance.This publication will review various <strong>control</strong> systems that are currently used <strong>in</strong><strong>the</strong> <strong>concrete</strong> <strong>in</strong>dustry and, by <strong>the</strong> use <strong>of</strong> examples, show how <strong>the</strong> pr<strong>in</strong>ciples areapplied to <strong>control</strong> <strong>the</strong> <strong>production</strong> <strong>of</strong> <strong>concrete</strong>.Page 4 <strong>of</strong> 53
<strong>Use</strong> <strong>of</strong> <strong>control</strong> <strong>charts</strong> <strong>in</strong> <strong>the</strong> <strong>production</strong> <strong>of</strong> <strong>concrete</strong>2 Statistics for Concrete2.1 Normal distribution <strong>of</strong> strengthCompressive strength test results tend to follow a normal distribution asillustrated <strong>in</strong> Figure 1. A normal distribution is def<strong>in</strong>ed by two parameters, <strong>the</strong>mean value <strong>of</strong> <strong>the</strong> distribution and <strong>the</strong> standard deviation (σ), which is <strong>the</strong>measure <strong>of</strong> <strong>the</strong> spread <strong>of</strong> results around <strong>the</strong> mean value. A low standarddeviation means that most strength results will be close to <strong>the</strong> mean value; ahigh standard deviation means that <strong>the</strong> strength <strong>of</strong> significant proportions <strong>of</strong><strong>the</strong> results will be well below (and above) <strong>the</strong> mean value. The area under <strong>the</strong>normal distribution between two values <strong>of</strong> ‘x’ represents <strong>the</strong> probability that aresult will fall with<strong>in</strong> this range <strong>of</strong> values. The term ‘tail’ is used to mean <strong>the</strong>area under <strong>the</strong> normal distribution between a value, e.g. a compressivestrength, and where <strong>the</strong> frequency is effectively zero. For strength it is <strong>the</strong>lower tail, i.e. low strength results, that is important but for o<strong>the</strong>r properties,e.g. consistence, both <strong>the</strong> lower and upper tails are important.Figure 1: Illustration <strong>of</strong> <strong>concrete</strong> strength distributionAt <strong>the</strong> extremes <strong>of</strong> <strong>the</strong> strength range for a given set <strong>of</strong> constituent materials,<strong>the</strong> assumption <strong>of</strong> a normally distributed set <strong>of</strong> data may not be valid. It is notpossible to have strengths less than zero and most <strong>concrete</strong>s have a ceil<strong>in</strong>gstrength beyond which <strong>the</strong>y cannot go. In <strong>the</strong>se situations <strong>the</strong> data set isskewed. However as low strengths are <strong>of</strong> concern to specifiers, an assumption<strong>of</strong> normally distributed data does not lead to problems <strong>in</strong> practice.2.2 Characteristic strength and target strengthEN 206-1[3] specifies <strong>the</strong> characteristic compressive strength <strong>of</strong> <strong>concrete</strong> <strong>in</strong>terms <strong>of</strong> a standard cyl<strong>in</strong>der test or a standard cube test carried out at 28 days.The characteristic strength is def<strong>in</strong>ed <strong>in</strong> EN 206-1 as <strong>the</strong> “value <strong>of</strong> strengthbelow which 5% <strong>of</strong> <strong>the</strong> population <strong>of</strong> all possible strength determ<strong>in</strong>ations <strong>of</strong> <strong>the</strong>volume <strong>of</strong> <strong>concrete</strong> under consideration, are expected to fall”. Put simply thismeans that if every s<strong>in</strong>gle batch was tested, 5% <strong>of</strong> <strong>the</strong> results would fall with<strong>in</strong><strong>the</strong> lower ‘tail’ <strong>of</strong> <strong>the</strong> normal distribution that starts 1.64σ below <strong>the</strong> actualPage 5 <strong>of</strong> 53
<strong>Use</strong> <strong>of</strong> <strong>control</strong> <strong>charts</strong> <strong>in</strong> <strong>the</strong> <strong>production</strong> <strong>of</strong> <strong>concrete</strong>mean strength. However <strong>the</strong> actual mean strength will not be known until <strong>the</strong><strong>concrete</strong> has been produced and tested and <strong>the</strong>refore <strong>the</strong> target mean strength(TMS) is usually set at some higher value to ensure <strong>the</strong> <strong>concrete</strong> achieves atleast <strong>the</strong> specified characteristic strength.The target mean strength is given <strong>in</strong> Equation 1.TMS = f ck + k x σ equation 1Where TMS = target mean strengthf ck = characteristic compressive strengthσ = estimate for standard deviation <strong>of</strong> populationk = statistical constantk x σ = <strong>the</strong> marg<strong>in</strong>The fixed po<strong>in</strong>t <strong>in</strong> <strong>the</strong> distribution is <strong>the</strong> specified characteristic strength andas <strong>the</strong> marg<strong>in</strong> <strong>in</strong>creases and/or <strong>the</strong> standard deviation <strong>in</strong>creases, <strong>the</strong> targetmean strength <strong>in</strong>creases, see Example 1.Example 1The target mean strength for a specified characteristic strength <strong>of</strong> C25/30 isgiven <strong>in</strong> Table 1. A standard deviation (σ) <strong>of</strong> 3 N/mm 2 is typical <strong>of</strong> a <strong>concrete</strong>with low variability and a value <strong>of</strong> 6 N/mm 2 represents high variability.Table 1: Target mean strength for specified characteristic strength <strong>of</strong>30N/mm 2 (cube)Marg<strong>in</strong>Area <strong>in</strong> lower tail(i.e. percentagebelow characteristicstrength)Target mean strength (cube),N/mm 2σ = 3 N/mm 2 σ = 6 N/mm 21.64σ 5% 35 401.96σ 2.5% 36 422.00σ 2.28% 36 422.33σ 1.0% 37 443.0σ 0.13% 39 48The numbers <strong>in</strong> this table have been rounded.A <strong>concrete</strong> strength below <strong>the</strong> characteristic strength is not a failure asstatistically 5% <strong>of</strong> <strong>the</strong> results are expected and accepted as to fall below thisvalue. However for structural safety reasons, a batch with a <strong>concrete</strong> strengthsignificantly below <strong>the</strong> characteristic strength is excluded, even though itforms part <strong>of</strong> <strong>the</strong> expected population. Consequently EN 206-1 specifies am<strong>in</strong>imum strength requirement for <strong>in</strong>dividual results (f ci ) <strong>of</strong> (f ck — 4). Any batchbelow this strength is a non-conform<strong>in</strong>g batch.The risk <strong>of</strong> non-conformity decreases as <strong>the</strong> marg<strong>in</strong> <strong>in</strong>creases. Statistics areused to quantify that risk. For a given marg<strong>in</strong> <strong>the</strong> probability <strong>of</strong> a test resultfall<strong>in</strong>g below <strong>the</strong> specified characteristic strength or fail<strong>in</strong>g <strong>the</strong> <strong>in</strong>dividualstrength criterion is given <strong>in</strong> Table 2. Table 2 shows that <strong>the</strong> probability <strong>of</strong>hav<strong>in</strong>g a result below <strong>the</strong> specified characteristic strength is <strong>in</strong>dependent <strong>of</strong><strong>the</strong> standard deviation (as <strong>the</strong> marg<strong>in</strong> is based on <strong>the</strong> standard deviation) but<strong>the</strong> risk <strong>of</strong> fail<strong>in</strong>g <strong>the</strong> criterion for <strong>in</strong>dividual batches <strong>in</strong>creases as <strong>the</strong> standarddeviation <strong>in</strong>creases.Page 6 <strong>of</strong> 53
<strong>Use</strong> <strong>of</strong> <strong>control</strong> <strong>charts</strong> <strong>in</strong> <strong>the</strong> <strong>production</strong> <strong>of</strong> <strong>concrete</strong>Table 2: Effect <strong>of</strong> marg<strong>in</strong> on proportion <strong>of</strong> <strong>concrete</strong> below characteristicstrength; and risk <strong>of</strong> fail<strong>in</strong>g <strong>the</strong> strength criterion for <strong>in</strong>dividual batchesMarg<strong>in</strong> Probability <strong>of</strong> a testresult be<strong>in</strong>g belowRisk <strong>of</strong> fail<strong>in</strong>g <strong>the</strong> strength criterionfor <strong>in</strong>dividual batches<strong>the</strong> characteristic σ = 3 N/mm 2 σ = 6 N/mm 2strength1.64σ 1 <strong>in</strong> 20 (5%) 0.1% 1%1.96σ 1 <strong>in</strong> 40 (2,5%) 0.05% 0.4%2.33σ 1 <strong>in</strong> 100 (1%) 0.01% 0.1%3.08σ 1 <strong>in</strong> 1000 (0,1%) 0.0005% 0.01%The def<strong>in</strong>ition <strong>of</strong> ‘characteristic strength’ <strong>in</strong> EN 206-1:2000 has itscomplications. For a structural eng<strong>in</strong>eer <strong>the</strong> phrase ‘<strong>the</strong> volume <strong>of</strong> <strong>concrete</strong>under consideration’ may be applied to all <strong>the</strong> <strong>concrete</strong> <strong>in</strong> <strong>the</strong>ir structure andto <strong>the</strong> <strong>concrete</strong> <strong>in</strong> a s<strong>in</strong>gle element <strong>of</strong> that structure even if this comprises as<strong>in</strong>gle batch. For conformity to EN 206-1, <strong>the</strong> ‘volume under consideration’ isall <strong>the</strong> <strong>concrete</strong> <strong>in</strong> an assessment period. Nei<strong>the</strong>r <strong>of</strong> <strong>the</strong>se <strong>in</strong>terpretations <strong>of</strong>this phrase is suitable for use <strong>in</strong> <strong>control</strong> systems as <strong>the</strong> process is cont<strong>in</strong>ual.Caspeele and Taerwe [5] have proposed that if <strong>the</strong> <strong>production</strong> achieves anaverage outgo<strong>in</strong>g quality limit a (AOQL) <strong>of</strong> 5%, <strong>the</strong> <strong>production</strong> can be acceptedas hav<strong>in</strong>g achieved <strong>the</strong> characteristic strength.2.3 Standard deviationThe standard deviation <strong>of</strong> a population will only be truly known if every batch<strong>of</strong> <strong>concrete</strong> is tested. However if 35 or more results are available, <strong>the</strong>estimated standard deviation is likely to be very close to <strong>the</strong> true standarddeviation. This is <strong>the</strong> reason why EN 206-1 requires 35 results to calculate <strong>the</strong><strong>in</strong>itial standard deviationWhen n ≥35, <strong>the</strong> standard deviation may be estimated us<strong>in</strong>g <strong>the</strong> equation:Standard deviation, σ =∑( − x)x i( n −1)Alternatively it can be determ<strong>in</strong>ed through a range <strong>of</strong> pairs approach whereMean range <strong>of</strong> successive pairs = 1.128 x standard deviation equation 2or,Standard deviation = 0.886 x mean range <strong>of</strong> successive pairs <strong>of</strong> resultsThe range is <strong>the</strong> numerical difference between successive results and <strong>the</strong>difference is always taken as a positive number, e.g. |2-3|=1. The range <strong>of</strong>pairs method <strong>of</strong> calculat<strong>in</strong>g <strong>the</strong> standard deviation is particularly suited forpopulations where <strong>the</strong>re are step changes <strong>in</strong> mean strength <strong>in</strong> <strong>the</strong> data set,e.g. <strong>concrete</strong>, as <strong>the</strong> effect <strong>of</strong> <strong>the</strong> step change will be limited to a s<strong>in</strong>gle pair<strong>of</strong> results. With <strong>concrete</strong> <strong>production</strong>, step changes <strong>in</strong> mean strength (usually2a From <strong>the</strong> operat<strong>in</strong>g-characteristic curve for <strong>the</strong> selected sampl<strong>in</strong>g plan, <strong>the</strong> average outgo<strong>in</strong>gquality (AOQ) curve is determ<strong>in</strong>ed by multiply<strong>in</strong>g each percentage <strong>of</strong> all possible results below<strong>the</strong> required characteristic strength <strong>in</strong> <strong>the</strong> <strong>production</strong> by <strong>the</strong> correspond<strong>in</strong>g acceptanceprobability.Page 7 <strong>of</strong> 53
<strong>Use</strong> <strong>of</strong> <strong>control</strong> <strong>charts</strong> <strong>in</strong> <strong>the</strong> <strong>production</strong> <strong>of</strong> <strong>concrete</strong>due to a change <strong>in</strong> a constituent) are more common than drifts <strong>in</strong> meanstrength.Example 2Table 3: Calculation <strong>of</strong> <strong>the</strong> standard deviation us<strong>in</strong>g mean rangeResultTransposedcubestrength,N/mm 2Range,N/mm 21 54.52 52.5 2.03 49.5 3.04 47.5 2.05 49.0 1.56 43.5 5.57 54.5 11.08 46.5 8.09 50.0 3.510 50.5 0.511 47.0 3.512 48.5 1.513 53.0 4.514 51.5 1.515 48.5 3.0Sum <strong>of</strong> ranges 51.0Mean <strong>of</strong> ranges 3.64Calculation <strong>of</strong> standard deviationEstimation <strong>of</strong> <strong>the</strong> standard deviation= 0.886 x 51/14= 0.886 x 3.64 = 3.0 N/mm 2 (rounded to <strong>the</strong>nearest 0.5 N/mm 2 )Example 3 (copied from reference [4])15 random data have been generated assum<strong>in</strong>g a mean strength <strong>of</strong> 37.0 N/mm 2and a standard deviation <strong>of</strong> 3.5 N/mm 2 . These have been repeated to give atotal <strong>of</strong> 30 data, see Figure 2a. The standard deviation <strong>of</strong> <strong>the</strong> 30 data given <strong>in</strong>Figure 2a is:3.6 N/mm 2 when determ<strong>in</strong>ed by <strong>the</strong> standard method;3.7 N/mm 2 when determ<strong>in</strong>ed from 0.886 x mean range.To illustrate <strong>the</strong> effect <strong>of</strong> a change <strong>in</strong> mean strength on <strong>the</strong> standarddeviation, an extreme reduction <strong>in</strong> mean strength <strong>of</strong> 5.0 N/mm 2 is <strong>in</strong>troducedat result 16 i.e. data 16 to 30 are all 5.0 N/mm 2 less than <strong>in</strong> Figure 2a. Thedispersion <strong>of</strong> <strong>the</strong> data around <strong>the</strong>se mean strengths is unchanged. Thestandard deviation <strong>of</strong> <strong>the</strong> 30 data given <strong>in</strong> Figure 2b is:4.4 N/mm 2 when determ<strong>in</strong>ed by <strong>the</strong> standard method;3.8 N/mm 2 when determ<strong>in</strong>ed from 0.886 x mean range.This shows that <strong>the</strong> standard deviation calculated from <strong>the</strong> mean range hasbeen less affected by <strong>the</strong> change <strong>in</strong> mean strength.Page 8 <strong>of</strong> 53
<strong>Use</strong> <strong>of</strong> <strong>control</strong> <strong>charts</strong> <strong>in</strong> <strong>the</strong> <strong>production</strong> <strong>of</strong> <strong>concrete</strong>Compressive strength - N/mm24540353025201510500 5 10 15 20 25 30Result numberFigure 2a. Fifteen random data generated assum<strong>in</strong>g a mean strength <strong>of</strong> 37.0 N/mm 2and a standard deviation <strong>of</strong> 3.5 N/mm 2 (<strong>the</strong> first group <strong>of</strong> 15 results are <strong>the</strong> sameas <strong>the</strong> second group <strong>of</strong> 15 results).Compressive strength - N/mm2454035302520151050Reduction <strong>of</strong> 5 N/mm2<strong>in</strong> <strong>the</strong> mean strength0 5 10 15 20 25 30Result numberFigure 2b. The same data as <strong>in</strong> Figure 6a, but with a reduction <strong>in</strong> mean strength <strong>of</strong>5.0 N/mm 2 <strong>in</strong>troduced at result 16.The true standard deviation <strong>of</strong> a population, σ, can only be determ<strong>in</strong>ed if all<strong>the</strong> population were to be tested, which is impractical. In practice <strong>the</strong>population standard deviation is estimated by test<strong>in</strong>g samples. The moresamples that are tested, <strong>the</strong> more reliable will be <strong>the</strong> estimated populationstandard deviation. EN 206-1 requires at least 35 results to <strong>in</strong>itially estimatePage 9 <strong>of</strong> 53
<strong>Use</strong> <strong>of</strong> <strong>control</strong> <strong>charts</strong> <strong>in</strong> <strong>the</strong> <strong>production</strong> <strong>of</strong> <strong>concrete</strong><strong>the</strong> population standard deviation. Prior to obta<strong>in</strong><strong>in</strong>g <strong>the</strong> estimated populationstandard deviation, <strong>concrete</strong> is <strong>control</strong>led by more conservative <strong>in</strong>itial test<strong>in</strong>grules. Without an estimated population standard deviation, it is not possible touse <strong>control</strong> <strong>charts</strong> to <strong>control</strong> <strong>the</strong> <strong>concrete</strong> <strong>production</strong>.Once <strong>the</strong> <strong>in</strong>itial population standard deviation has been estimated, EN 206-1permits two methods for verify<strong>in</strong>g <strong>the</strong> <strong>in</strong>itial estimate. The first method<strong>in</strong>volves check<strong>in</strong>g that <strong>the</strong> standard deviation <strong>of</strong> <strong>the</strong> most recent 15 resultsdoes not deviate significantly from <strong>the</strong> adopted value. The second method<strong>in</strong>volves <strong>the</strong> use <strong>of</strong> cont<strong>in</strong>uous <strong>control</strong> systems.The standard deviation for strength tends to be constant for medium and highstrength mixes but for lower strengths it tends to <strong>in</strong>crease proportionally withmean strength [6] and <strong>the</strong> relationship illustrated <strong>in</strong> Figure 3 may be assumed.In practice this means that <strong>the</strong> standard deviation for <strong>concrete</strong>s that have acharacteristic strength <strong>of</strong> 20 N/mm 2 or more is determ<strong>in</strong>ed by test<strong>in</strong>g andcalculation, while <strong>the</strong> standard deviation for <strong>concrete</strong> with a lower strength is<strong>in</strong>terpolated.Standard Deviation (N/mm 2 )Plant SD27Strength (N/mm 2 )Figure 3: Simplified standard deviation to mean strength relationship2.4 Sett<strong>in</strong>g <strong>the</strong> target strengthThe target strength is set to achieve a balance between <strong>the</strong> follow<strong>in</strong>grequirements:- high probability <strong>of</strong> achiev<strong>in</strong>g a population with at least <strong>the</strong> specifiedcharacteristic strength;- low risk <strong>of</strong> fail<strong>in</strong>g <strong>the</strong> m<strong>in</strong>imum strength criterion;- low consumers risk;- low producers risk;- competitive and economic.The target strength is selected by <strong>the</strong> producer, but <strong>the</strong> producer may have tocomply with certa<strong>in</strong> m<strong>in</strong>imum values. The target strength should never belower than (f ck +1.64σ), but it is normally higher than this value. NationalPage 10 <strong>of</strong> 53
<strong>Use</strong> <strong>of</strong> <strong>control</strong> <strong>charts</strong> <strong>in</strong> <strong>the</strong> <strong>production</strong> <strong>of</strong> <strong>concrete</strong>requirements, <strong>the</strong> requirements <strong>of</strong> a certification body or o<strong>the</strong>r requirements(see 9.4) may impose m<strong>in</strong>imum target strengths.UK experience is that a m<strong>in</strong>imum target strength <strong>of</strong> (f ck +1.96σ) at a test rate<strong>of</strong> at least 16 results per month is a good balance between <strong>the</strong>se conflict<strong>in</strong>gdemands. With a <strong>concrete</strong> family this gives about a 3σ marg<strong>in</strong>, i.e. a 1:1000risk <strong>of</strong> fail<strong>in</strong>g <strong>the</strong> m<strong>in</strong>imum strength requirement (f ck — 4). Data collected by aUK certification body on <strong>in</strong>dividual batch non-conformities shows that <strong>the</strong>actual rate <strong>of</strong> non-conformity is an order <strong>of</strong> magnitude lower and this is due to<strong>the</strong> active <strong>control</strong> <strong>of</strong> <strong>the</strong> <strong>production</strong>.Page 11 <strong>of</strong> 53
<strong>Use</strong> <strong>of</strong> <strong>control</strong> <strong>charts</strong> <strong>in</strong> <strong>the</strong> <strong>production</strong> <strong>of</strong> <strong>concrete</strong>3 Simple Data ChartsSimple data <strong>control</strong> <strong>charts</strong> are used to rout<strong>in</strong>ely monitor quality. There are twobasic types <strong>of</strong> <strong>control</strong> <strong>charts</strong>.Univariate – a <strong>control</strong> chart <strong>of</strong> one quality characteristic (e.g. mean strength)Multivariate - <strong>control</strong> chart <strong>of</strong> a statistic that summarises or representsmore than one quality characteristic (e.g. coefficient <strong>of</strong> variation)If a s<strong>in</strong>gle quality characteristic has been measured or computed from asample, <strong>the</strong> <strong>control</strong> chart shows <strong>the</strong> value <strong>of</strong> <strong>the</strong> quality characteristic versus<strong>the</strong> sample number or versus time.Simple data <strong>charts</strong> are useful <strong>in</strong> provid<strong>in</strong>g a visual image <strong>of</strong> <strong>production</strong> andunusual results. Simple <strong>charts</strong> may also give an <strong>in</strong>dication <strong>of</strong> trends but <strong>the</strong>general scatter <strong>of</strong> <strong>the</strong> data may also mask trends that can be identified only bymore <strong>in</strong>-depth analysis <strong>of</strong> <strong>the</strong> data.Consider <strong>the</strong> data <strong>in</strong> Table 4 and illustrated <strong>in</strong> Figure 4. A review <strong>of</strong> <strong>the</strong> datashows that all <strong>the</strong> results are with<strong>in</strong> +/- 8 N/mm 2 <strong>of</strong> <strong>the</strong> target. The results arefairly evenly distributed around <strong>the</strong> target (2 on target, 9 results above and 7below) so it is not immediately obvious what conclusions can be drawn from<strong>the</strong> data.Table 4: Example data for mean strength with a target strength <strong>of</strong> 40N/mm 2Result 28 day strength,Result 28 day strength,N/mm 2 N/mm 21 37 10 402 42 11 343 36 12 444 35 13 46.55 42 14 426 38 15 44.57 39.5 16 458 40 17 449 35 18 48Figure 4: Simple univariate <strong>control</strong> chart for strengthPage 12 <strong>of</strong> 53
<strong>Use</strong> <strong>of</strong> <strong>control</strong> <strong>charts</strong> <strong>in</strong> <strong>the</strong> <strong>production</strong> <strong>of</strong> <strong>concrete</strong>4 Shewhart Charts4.1 IntroductionWhile graphical plots can give useful <strong>in</strong>formation about <strong>the</strong> pattern <strong>of</strong> a<strong>production</strong> process, <strong>the</strong> <strong>control</strong> chart becomes a much more powerful tool ifstatistical rules are also applied to <strong>the</strong> data. Shewhart <strong>control</strong> systemsmeasure variables <strong>in</strong> <strong>the</strong> <strong>production</strong> processes (e.g. target mean strength).Theymake use <strong>of</strong> calculated <strong>control</strong> limits and apply warn<strong>in</strong>g limits based on <strong>the</strong>measured variation <strong>in</strong> <strong>the</strong> <strong>production</strong> process.ISO 8258 [7] gives general <strong>in</strong>formation on Shewhart <strong>control</strong> <strong>charts</strong> and ISO 7966[8] gives general <strong>in</strong>formation on Shewhart <strong>control</strong> <strong>charts</strong> for acceptance<strong>control</strong>.The Shewhart chart will have a horizontal central l<strong>in</strong>e which represents <strong>the</strong>expected mean value <strong>of</strong> <strong>the</strong> test results on <strong>the</strong> samples taken from <strong>production</strong>;<strong>in</strong> <strong>the</strong> case <strong>of</strong> <strong>concrete</strong>, <strong>the</strong> Target Mean Strength for a chart <strong>control</strong>l<strong>in</strong>gcompressive strength. L<strong>in</strong>es represent<strong>in</strong>g <strong>the</strong> upper <strong>control</strong> limit (UCL) lower<strong>control</strong> limit (LCL), upper warn<strong>in</strong>g limit (UWL) and lower warn<strong>in</strong>g limit (LWL)may also be added. Generally action is required if a result is beyond ei<strong>the</strong>r <strong>of</strong><strong>the</strong> <strong>control</strong> limits.The UWL and LWL are set at a level so that most <strong>of</strong> <strong>the</strong> results will fallbetween <strong>the</strong> l<strong>in</strong>es when a system is runn<strong>in</strong>g <strong>in</strong> <strong>control</strong>. These are notspecification limits but ‘warn<strong>in</strong>g’ limits based on <strong>the</strong> variability <strong>of</strong> <strong>the</strong><strong>production</strong> process. Given that <strong>concrete</strong> strengths follow a normal distribution(Figure 1), it follows that <strong>the</strong>re is a 50% chance that a result will be above <strong>the</strong>TMS and a 50% chance that it is below <strong>the</strong> TMS. In chapter 2 it was shown thata marg<strong>in</strong> <strong>of</strong> 1.96 x σ will lead to 2.5% <strong>of</strong> results be<strong>in</strong>g below <strong>the</strong> characteristicstrength. Some variables, e.g. consistence, have both upper and lower limitsand <strong>in</strong> <strong>the</strong>se cases it is essential to have both an UWL and a LWL. While forconformity to a specified characteristic strength a high value is not significant,from <strong>the</strong> viewpo<strong>in</strong>t <strong>of</strong> economic <strong>production</strong> it does matter. Therefore <strong>in</strong>practice, both upper and lower warn<strong>in</strong>g limits are used even for a variable thathas a s<strong>in</strong>gle limit value, e.g. <strong>concrete</strong> strength. Sett<strong>in</strong>g upper and lowerwarn<strong>in</strong>g limits at 1.96σ leads to <strong>the</strong> expectation that 95% <strong>of</strong> <strong>the</strong> results will fallwith<strong>in</strong> <strong>the</strong>se limits and 2.5% <strong>in</strong> each <strong>of</strong> <strong>the</strong> ‘tails’ <strong>of</strong> <strong>the</strong> normal distribution. Ifa marg<strong>in</strong> <strong>of</strong> 3.0 x σ is adopted, <strong>the</strong>re is very little chance <strong>of</strong> a result fall<strong>in</strong>goutside this limit due to natural variation (0.3% for two-tailed test). AShewhart <strong>control</strong> chart can be constructed withUCL = TMS + 3 x σLCL = TMS – 3 x σUWL = TMS + 2 x σLWL = TMS – 2 x σThe probability <strong>of</strong> a s<strong>in</strong>gle result fall<strong>in</strong>g outside <strong>of</strong> ei<strong>the</strong>r <strong>the</strong> UWL or LWL is4.56%, i.e. 2.28% above <strong>the</strong> UWL and 2.28% below <strong>the</strong> LWL (see Table 1Table2).The probability <strong>of</strong> two consecutive results fall<strong>in</strong>g outside <strong>the</strong> limits purely bychance is= 0.0456 x 0.0456 = 0.002079 or 0.21%Page 13 <strong>of</strong> 53
<strong>Use</strong> <strong>of</strong> <strong>control</strong> <strong>charts</strong> <strong>in</strong> <strong>the</strong> <strong>production</strong> <strong>of</strong> <strong>concrete</strong>The probability that <strong>the</strong> two results are ei<strong>the</strong>r both above or below <strong>the</strong> l<strong>in</strong>e(i.e. <strong>in</strong> <strong>the</strong> same direction) is only 0.05%. Such an outcome is very strongevidence that <strong>the</strong> expected outcome is not be<strong>in</strong>g achieved.4.2 Shewhart action criteria4.2.1 Po<strong>in</strong>ts beyond UCL or LCLThe presence <strong>of</strong> one or more po<strong>in</strong>ts ly<strong>in</strong>g outside <strong>of</strong> <strong>the</strong> UCL or LCL is primaryevidence that <strong>the</strong> system is out <strong>of</strong> <strong>control</strong> at that po<strong>in</strong>t. S<strong>in</strong>ce <strong>the</strong>re is only a0.3% chance that this result is due to natural variation, it is probable thatspecial variation will account for <strong>the</strong> extreme value and an immediate<strong>in</strong>vestigation <strong>in</strong>to <strong>the</strong> cause should be undertaken.4.2.2 Po<strong>in</strong>ts beyond UWL or LWLThe presence <strong>of</strong> two consecutive, or more than 1 <strong>in</strong> 40, po<strong>in</strong>ts beyond ei<strong>the</strong>rwarn<strong>in</strong>g l<strong>in</strong>e is evidence that <strong>the</strong> process is out <strong>of</strong> <strong>control</strong> and an <strong>in</strong>vestigation<strong>of</strong> <strong>the</strong> data should be undertaken.4.2.3 Patterns with<strong>in</strong> <strong>control</strong> limitsIt is also possible to analyse data that doesn’t breach ei<strong>the</strong>r <strong>the</strong> <strong>control</strong> orwarn<strong>in</strong>g limits to evaluate whe<strong>the</strong>r any trends are significant. Runs analysiscan give <strong>the</strong> first warn<strong>in</strong>g <strong>of</strong> a system go<strong>in</strong>g out <strong>of</strong> <strong>control</strong> before po<strong>in</strong>ts areseen beyond <strong>the</strong> warn<strong>in</strong>g limits.The follow<strong>in</strong>g simple rules <strong>of</strong> thumb have been proposed for sequences <strong>of</strong>results that rema<strong>in</strong> with<strong>in</strong> <strong>the</strong> warn<strong>in</strong>g limits [9]:1. Seven or more consecutive results on <strong>the</strong> same side <strong>of</strong> <strong>the</strong> target meanstrength2. At least 10 out <strong>of</strong> 11 results on <strong>the</strong> same side <strong>of</strong> <strong>the</strong> target meanstrength3. At least 12 out <strong>of</strong> 14 results on <strong>the</strong> same side <strong>of</strong> <strong>the</strong> target meanstrength4. At least 14 out <strong>of</strong> 17 results on <strong>the</strong> same side <strong>of</strong> <strong>the</strong> target meanstrength4.3 Control <strong>of</strong> standard deviationThe <strong>control</strong> and warn<strong>in</strong>g limits are determ<strong>in</strong>ed by <strong>the</strong> standard deviation <strong>of</strong> <strong>the</strong>process; it is <strong>the</strong>refore important to monitor <strong>the</strong> standard deviation. As <strong>the</strong>calculation to determ<strong>in</strong>e standard deviation is relatively complex, <strong>the</strong>alternative calculation <strong>in</strong> equation 2 is used l<strong>in</strong>k<strong>in</strong>g standard deviation to <strong>the</strong>range <strong>of</strong> pairs <strong>of</strong> results. Plot <strong>the</strong> runn<strong>in</strong>g mean range <strong>of</strong> <strong>the</strong> last n successiveresults where n ≥ 15 aga<strong>in</strong>st test result number. Select <strong>the</strong> change <strong>in</strong> standarddeviation that will prompt action (Δσ) and set action l<strong>in</strong>es at:1.128*current standard deviation ± 1.128* Δσ4.4 Example Shewhart chartConsider aga<strong>in</strong> <strong>the</strong> strength data <strong>in</strong> Table 4 and subject it to a Shewhartanalysis us<strong>in</strong>g <strong>the</strong> rules stated <strong>in</strong> 4.1.3. Figure 5 shows <strong>the</strong> data with a UCL,Page 14 <strong>of</strong> 53
<strong>Use</strong> <strong>of</strong> <strong>control</strong> <strong>charts</strong> <strong>in</strong> <strong>the</strong> <strong>production</strong> <strong>of</strong> <strong>concrete</strong>LCL, UWL and LWL applied. Immediately it is apparent that po<strong>in</strong>t 18 hasexceeded <strong>the</strong> UWL This does not breach <strong>the</strong> rule def<strong>in</strong>ed <strong>in</strong> 4.1.3 (requir<strong>in</strong>g 2consecutive po<strong>in</strong>ts above UWL) but also at this po<strong>in</strong>t <strong>the</strong>re is a sequence <strong>of</strong> 7po<strong>in</strong>ts on <strong>the</strong> same side <strong>of</strong> <strong>the</strong> target mean strength (see 4.2.3). The Shewhartchart is show<strong>in</strong>g that <strong>the</strong> process is out <strong>of</strong> <strong>control</strong>, i.e. <strong>the</strong> actual meanstrength is higher than <strong>the</strong> mean strength required.Figure 5: Control levels applied to data4.5 Modified application <strong>of</strong> Shewhart <strong>control</strong> chartIf <strong>the</strong> aim is to assess whe<strong>the</strong>r <strong>the</strong> level <strong>of</strong> <strong>production</strong> is higher than a specifiedcharacteristic value, a modified application <strong>of</strong> Shewhart <strong>control</strong> <strong>charts</strong> can beused, with <strong>the</strong> use <strong>of</strong> specific modified variables. This application comprisescheck<strong>in</strong>g that <strong>the</strong> average <strong>of</strong> n measured strength results is greater than alower l<strong>in</strong>e L l situated at a given distance from f ck with <strong>the</strong> follow<strong>in</strong>g variables:L l ≥ f ck + (q n x s) where- q n depends on n and on <strong>the</strong> AOQL chosen,- s is an updated evaluation <strong>of</strong> <strong>the</strong> standard deviation <strong>of</strong> <strong>the</strong> relevant<strong>production</strong>.In <strong>the</strong> case where n ≥ 15 and q n ≥ 1.48, <strong>the</strong> Shewhart <strong>charts</strong> will satisfy <strong>the</strong>requirement for an AOQL <strong>of</strong> 5%. This criterion also satisfies <strong>the</strong> conformitycriteria for mean strength <strong>in</strong> EN 206-1. A warn<strong>in</strong>g l<strong>in</strong>e at some higher value mayalso be appropriate.Example 4A precast <strong>concrete</strong> factory <strong>in</strong>tends us<strong>in</strong>g a Shewhart chart system to showconformity to <strong>the</strong> mean strength criterion <strong>in</strong> EN 206-1. Due to processrequirements <strong>the</strong> strengths tend to exceed <strong>the</strong> characteristic strength with<strong>in</strong> afew days and <strong>the</strong>refore <strong>the</strong>y opt to test at a real age <strong>of</strong> 7 days to verify that<strong>the</strong> specified 28 day strength is already be<strong>in</strong>g achieved at 7 days. As <strong>the</strong>compressive strengths are expected to be well above <strong>the</strong> specified strength,<strong>the</strong>y opt not to have a warn<strong>in</strong>g l<strong>in</strong>e.Page 15 <strong>of</strong> 53
<strong>Use</strong> <strong>of</strong> <strong>control</strong> <strong>charts</strong> <strong>in</strong> <strong>the</strong> <strong>production</strong> <strong>of</strong> <strong>concrete</strong>To do this task <strong>the</strong> runn<strong>in</strong>g average strength <strong>of</strong> <strong>the</strong> last ‘n’ consecutiveresults, where ‘n’ is a predeterm<strong>in</strong>ed number that is at least 15 are plotted ona Shewhart chart with one limit l<strong>in</strong>e with a value <strong>of</strong> (f ck + 1.48s). If <strong>the</strong>runn<strong>in</strong>g mean strength below this l<strong>in</strong>e this <strong>in</strong>dicates that an AOQL <strong>of</strong> 5% is notbe<strong>in</strong>g achieved. A warn<strong>in</strong>g l<strong>in</strong>e at some value higher than (f ck + 1.48s) may beadded.The specified compressive strength class is C25/30 and <strong>the</strong>y use cubes forassess<strong>in</strong>g <strong>the</strong> <strong>production</strong> and conformity. The current standard deviation is2.5 N/mm 2 . The limit value Ll is:30 +1.48*2.5 = 33.7 N/mm 2For <strong>control</strong> purposes, ra<strong>the</strong>r than us<strong>in</strong>g non-overlapp<strong>in</strong>g groups <strong>of</strong> results, <strong>the</strong>yopt to use <strong>the</strong> runn<strong>in</strong>g mean <strong>of</strong> <strong>the</strong> last 15 results. This is shown <strong>in</strong> Figure 6a),which shows that <strong>the</strong> mean strength is consistently above <strong>the</strong> limit value.Figure 6a): Control <strong>of</strong> conformity <strong>of</strong> mean strength us<strong>in</strong>g a runn<strong>in</strong>g mean <strong>of</strong>15 resultsIt is also necessary to check that <strong>the</strong> sample standard deviation has notchanged significantly. Though clause 8.2.1.3 <strong>of</strong> EN 206-1:2000 states that <strong>the</strong>present value is still applicable if <strong>the</strong> calculated value based on <strong>the</strong> last 15results is with<strong>in</strong> about ± current value/3, this is not a very sensitive <strong>in</strong>dicator<strong>of</strong> change and most producers would regard a 0.5 N/mm 2 change <strong>in</strong> standarddeviation as significant and <strong>the</strong> precast company uses this value <strong>of</strong> 0.5 N/mm 2 ,which is <strong>control</strong>led with ano<strong>the</strong>r modified Shewhart chart. On this chart ahorizontal l<strong>in</strong>e is drawn at <strong>the</strong> current mean range value (1.128σ) and actionl<strong>in</strong>es ± 1.128 x 0.5 from this value.Aga<strong>in</strong> a runn<strong>in</strong>g mean range <strong>of</strong> <strong>the</strong> last 15 consecutive and overlapp<strong>in</strong>g pairs <strong>of</strong>results is used. When <strong>the</strong> runn<strong>in</strong>g mean value crosses one <strong>of</strong> <strong>the</strong>se action l<strong>in</strong>es,this <strong>in</strong>dicates that <strong>the</strong> standard deviation has changed by 0.5 N/mm 2 and anew value should be applied.In this example <strong>the</strong> current standard deviation is 2.5 N/mm 2 and this equatesto a mean range <strong>of</strong> 1.128 x 2.5 = 2.82 N/mm 2 and upper and lower action l<strong>in</strong>esat 3.38 N/mm 2 and 2.26 N/mm 2 (2.82 ± 1.128 x 0.5). These are shown <strong>in</strong> Figure6b). At test result 26, <strong>the</strong> mean range crosses <strong>the</strong> upper action l<strong>in</strong>e <strong>in</strong>dicat<strong>in</strong>gPage 16 <strong>of</strong> 53
<strong>Use</strong> <strong>of</strong> <strong>control</strong> <strong>charts</strong> <strong>in</strong> <strong>the</strong> <strong>production</strong> <strong>of</strong> <strong>concrete</strong>that <strong>the</strong> standard deviation has <strong>in</strong>creased by 0.5 N/mm 2 . The limit value is<strong>in</strong>creased <strong>in</strong> Figure 6a) to 34.4 N/mm 2 and <strong>in</strong> Figure 6b) a new mean range isset at 3.38 N/mm 2 with upper and lower action l<strong>in</strong>es set at 3.94 N/mm 2 and2.82 N/mm 2 respectively. As <strong>the</strong> runn<strong>in</strong>g mean strength is still well above <strong>the</strong>limit l<strong>in</strong>e, <strong>the</strong> mix proportions are not changed, i.e. <strong>the</strong> appropriate action isto take no action o<strong>the</strong>r than change <strong>the</strong> values on <strong>the</strong> <strong>control</strong> <strong>charts</strong>.Figure 6b): Control <strong>of</strong> standard deviation us<strong>in</strong>g <strong>the</strong> runn<strong>in</strong>g mean range <strong>of</strong><strong>the</strong> last 15 rangesPage 17 <strong>of</strong> 53
<strong>Use</strong> <strong>of</strong> <strong>control</strong> <strong>charts</strong> <strong>in</strong> <strong>the</strong> <strong>production</strong> <strong>of</strong> <strong>concrete</strong>5 CUSUM5.1 IntroductionCUSUM <strong>control</strong> systems (short for cumulative sum) were developed <strong>in</strong> <strong>the</strong>1950s, <strong>in</strong>itially for quality <strong>control</strong> <strong>of</strong> cont<strong>in</strong>uous manufactur<strong>in</strong>g processes. Theyhave found widespread use <strong>in</strong> <strong>the</strong> <strong>concrete</strong> <strong>in</strong>dustry. In CUSUM <strong>charts</strong>, <strong>the</strong>central l<strong>in</strong>e does not represent a constant mean value but is a zero l<strong>in</strong>e for <strong>the</strong>assessment <strong>of</strong> <strong>the</strong> trend <strong>in</strong> <strong>the</strong> results. In <strong>concrete</strong> <strong>production</strong> three CUSUMsare used:• CUSUM M, for <strong>the</strong> <strong>control</strong> <strong>of</strong> mean strength;• CUSUM R (range), for <strong>the</strong> <strong>control</strong> <strong>of</strong> standard deviation;• CUSUM C, for <strong>the</strong> <strong>control</strong> <strong>of</strong> correlation.The CUSUM method, described <strong>in</strong> more detail <strong>in</strong> BS 5703[9] and ConcreteSociety Digest No. 6[10] and ISO/TR 7871[11], <strong>in</strong>volves subtract<strong>in</strong>g <strong>the</strong> testresult from a target value <strong>the</strong>n produc<strong>in</strong>g an ongo<strong>in</strong>g runn<strong>in</strong>g sum (<strong>the</strong> CUSUM)<strong>of</strong> <strong>the</strong> differences. If <strong>the</strong> process is <strong>in</strong> <strong>control</strong>, <strong>the</strong> po<strong>in</strong>ts on <strong>the</strong> CUSUM plotare distributed randomly (positive and negative differences cancell<strong>in</strong>g eacho<strong>the</strong>r out), to give an accumulative sum that is close to zero, but if <strong>the</strong> processslips out <strong>of</strong> <strong>control</strong>, this will be quickly illustrated by <strong>the</strong> CUSUM plot mov<strong>in</strong>gtowards <strong>the</strong> UCL or LCL.BS 5700[12] describes <strong>the</strong> follow<strong>in</strong>g advantages <strong>of</strong> <strong>the</strong> CUSUM system:a) for same sample size it gives a more vivid illustration <strong>of</strong> any changes;b) uses data more effectively <strong>the</strong>refore produces cost sav<strong>in</strong>gs;c) gives clear <strong>in</strong>dication <strong>of</strong> location and magnitude <strong>of</strong> change.CUSUM <strong>charts</strong> have been found to be more sensitive at detect<strong>in</strong>g small shifts <strong>in</strong><strong>the</strong> mean <strong>of</strong> a process than Shewhart, whereas Shewhart <strong>charts</strong> are superior atdetect<strong>in</strong>g large shifts [13]. When <strong>the</strong> CUSUM reaches <strong>the</strong> UCL or LCL, it ispossible to use <strong>the</strong> plot to determ<strong>in</strong>e at what po<strong>in</strong>t <strong>the</strong> process went out <strong>of</strong><strong>control</strong> and what scale <strong>of</strong> corrective action is required.Historically, CUSUM <strong>control</strong> <strong>charts</strong> were plotted manually and to determ<strong>in</strong>ewhe<strong>the</strong>r a trend <strong>in</strong> <strong>the</strong> plot was significant or not, a transparent mask <strong>in</strong> <strong>the</strong>shape <strong>of</strong> a truncated (cut-<strong>of</strong>f) V is placed on its side over <strong>the</strong> plot, with <strong>the</strong>lead po<strong>in</strong>t placed on <strong>the</strong> most recent result, not on <strong>the</strong> central l<strong>in</strong>e. Thetransparent V-mask overlay <strong>in</strong> Figure 7 is shown <strong>in</strong> red. Each limb is markedwith its standard deviation and <strong>in</strong> this example <strong>the</strong> values run from 3.0 N/mm 2<strong>in</strong> 0.5 N/mm 2 steps to 5.0 N/mm 2 . The limbs have no limitation on <strong>the</strong>ir length.The ‘arms’ <strong>of</strong> <strong>the</strong> V-mask represent <strong>the</strong> upper and lower <strong>control</strong> limits. If <strong>the</strong>plot crossed ei<strong>the</strong>r <strong>the</strong> upper or lower arm <strong>of</strong> <strong>the</strong> V, a significant change isdeemed to have occurred, see Figure 7. Computerized systems have takenover <strong>the</strong> analysis <strong>of</strong> CUSUMs but <strong>the</strong> concept is easier to understand us<strong>in</strong>g <strong>the</strong>more visual V-mask method.Page 18 <strong>of</strong> 53
<strong>Use</strong> <strong>of</strong> <strong>control</strong> <strong>charts</strong> <strong>in</strong> <strong>the</strong> <strong>production</strong> <strong>of</strong> <strong>concrete</strong>Figure 7: Illustration <strong>of</strong> V-mask placed over lead po<strong>in</strong>t to detect change (<strong>the</strong>current standard deviation is 4.5 N/mm 2 )Consider <strong>the</strong> data for compressive strength <strong>in</strong> Table 4 for a plant operat<strong>in</strong>g on astandard deviation <strong>of</strong> 3.5 N/mm 2 and with a target mean strength <strong>of</strong>40 N/mm 2 . The CUSUM can be calculated and is tabulated <strong>in</strong> Table 5. A plot <strong>of</strong><strong>the</strong> CUSUM with UCL and LCL is shown <strong>in</strong> Figure 8. When <strong>the</strong> V-mask is placedon <strong>the</strong> lead po<strong>in</strong>t (po<strong>in</strong>t 18), <strong>the</strong> CUSUM crosses <strong>the</strong> LCL at po<strong>in</strong>t 11 <strong>in</strong>dicat<strong>in</strong>gthat a change <strong>in</strong> <strong>the</strong> process occurred at this po<strong>in</strong>t. While <strong>the</strong> Shewhartanalysis <strong>of</strong> <strong>the</strong> data (see 4.4) also <strong>in</strong>dicated a change at po<strong>in</strong>t 18, <strong>the</strong> plot <strong>of</strong><strong>the</strong> CUSUM gives a clear visual picture <strong>of</strong> <strong>the</strong> trend and shows that it has beenpresent s<strong>in</strong>ce po<strong>in</strong>t 11.Page 19 <strong>of</strong> 53
<strong>Use</strong> <strong>of</strong> <strong>control</strong> <strong>charts</strong> <strong>in</strong> <strong>the</strong> <strong>production</strong> <strong>of</strong> <strong>concrete</strong>ResultTable 5: CUSUM data28 day Differencestrength from 40N/mm 2(N/mm 2 ) target (N/mm 2 )CUSUM(N/mm 2 )1 37 -3 -32 42 2 -13 36 -4 -54 35 -5 -105 42 2 -86 38 -2 -107 39.5 -0.5 -10.58 40 0 -10.59 35 -5 -15.510 40 0 -15.511 34 -6 -21.512 44 4 -17.513 46.5 6.5 -1114 42 2 -915 44.5 4.5 -4.516 45 5 0.517 44 4 4.518 48 8 12.5Figure 8: Example CUSUM plot for data <strong>in</strong> Table 5Page 20 <strong>of</strong> 53
<strong>Use</strong> <strong>of</strong> <strong>control</strong> <strong>charts</strong> <strong>in</strong> <strong>the</strong> <strong>production</strong> <strong>of</strong> <strong>concrete</strong>5.2 Controll<strong>in</strong>g mean strengthCompressive strength <strong>of</strong> <strong>concrete</strong> is <strong>the</strong> simplest parameter to monitor. Thetest result is compared with a target mean strength based on <strong>the</strong> specifiedcharacteristic strength plus <strong>the</strong> marg<strong>in</strong> (see equation 1).CUSUMs <strong>control</strong>l<strong>in</strong>g compressive strength are generally based on a <strong>concrete</strong>family and all test results are converted to <strong>the</strong> equivalent value <strong>of</strong> a selectedreference <strong>concrete</strong>, e.g. C32/40. The analysis is usually based on early age testresults (see 7.1), e.g. on 7 day strength data, as <strong>the</strong> risk <strong>of</strong> wait<strong>in</strong>g until 28days to identify a loss <strong>of</strong> <strong>control</strong> is unacceptable. The predicted 28 daystrength is calculated from <strong>the</strong> early age test result (see 7.1) and this is used <strong>in</strong><strong>the</strong> CUSUM until <strong>the</strong> actual 28 day strength is available. Some systems <strong>the</strong>nsubstitute <strong>the</strong> measured 28-day strength and re-calculate <strong>the</strong> CUSUM whileo<strong>the</strong>r systems cont<strong>in</strong>ue to use <strong>the</strong> predicted strength. The current trend is toreplace <strong>the</strong> predicted strength with <strong>the</strong> measured 28 day strength as s<strong>in</strong>ce 2000<strong>the</strong> data have also been used for conformity and conformity is based on <strong>the</strong>measured 28 day strength.A worked example <strong>of</strong> a CUSUM <strong>control</strong>l<strong>in</strong>g target mean strength (CUSUM M)us<strong>in</strong>g <strong>the</strong> <strong>concrete</strong> family approach is detailed <strong>in</strong> chapter 11.5.3 Controll<strong>in</strong>g standard deviationCUSUM may be used to monitor standard deviation by us<strong>in</strong>g <strong>the</strong> relationshipbetween <strong>the</strong> range <strong>of</strong> successive pairs <strong>of</strong> results given <strong>in</strong> equation 2.The expected range (current standard deviation x 1.128) <strong>of</strong> a pair <strong>of</strong> results ismonitored aga<strong>in</strong>st <strong>the</strong> actual range and a CUSUM <strong>of</strong> <strong>the</strong> differences calculated.The results are plotted and monitored us<strong>in</strong>g a V-mask or computer model.It should be noted that range is not a normally distributed variable, <strong>the</strong>refore ifa symmetrical V-mask is adopted; longer run lengths will be required to detecta decrease <strong>in</strong> <strong>the</strong> standard deviation. However this conservative approach –<strong>the</strong> use <strong>of</strong> a symmetrical mask- is adopted for simplicity <strong>in</strong> many systems.When a significant change is detected, <strong>the</strong> standard deviation is adjusted andresults corrected to <strong>the</strong> new target mean strength – higher if <strong>the</strong> standarddeviation has <strong>in</strong>creased, lower if <strong>the</strong> standard deviation has decreased. Theresult immediately prior to <strong>the</strong> change <strong>of</strong> target strength should also beadjusted to <strong>the</strong> new target mean strength to calculate <strong>the</strong> range <strong>of</strong> pairs,o<strong>the</strong>rwise an additional element <strong>of</strong> variation would be built <strong>in</strong>to <strong>the</strong> data.An example CUSUM on standard deviation (CUSUM R) is illustrated <strong>in</strong>chapter 11.5.4 Controll<strong>in</strong>g correlationControl systems for <strong>concrete</strong> are generally based on early age strength as <strong>the</strong>consequences <strong>of</strong> wait<strong>in</strong>g for <strong>the</strong> 28 day compressive strength results lead to anunacceptable level <strong>of</strong> risk. Seven day compressive strength results arenormally used <strong>in</strong> <strong>the</strong> <strong>control</strong> system and <strong>the</strong> 28 day strength is predicted us<strong>in</strong>gan estimated correlation (<strong>the</strong> relationship between 7 and 28 day strength). Inorder to confirm that <strong>the</strong> correlation factor is correct, a CUSUM C may be runon <strong>the</strong> differences between actual and predicted 28 day strengths. If <strong>the</strong>Page 21 <strong>of</strong> 53
<strong>Use</strong> <strong>of</strong> <strong>control</strong> <strong>charts</strong> <strong>in</strong> <strong>the</strong> <strong>production</strong> <strong>of</strong> <strong>concrete</strong>CUSUM C is positive <strong>the</strong>n <strong>the</strong> system is underestimat<strong>in</strong>g <strong>the</strong> 28 day strength andif negative it is overestimat<strong>in</strong>g <strong>the</strong> 28 day strength.When a significant trend is detected, a new correlation relationship isdeterm<strong>in</strong>ed. The CUSUM M for mean strength us<strong>in</strong>g predicted results will needto be recalculated as <strong>the</strong> system has effectively been under or over estimat<strong>in</strong>gfor a period <strong>of</strong> time and it may be significantly adrift. The plot <strong>of</strong> range neednot be re-determ<strong>in</strong>ed because <strong>the</strong> correlation change will affect all resultssimilarly (except for <strong>the</strong> range straddl<strong>in</strong>g <strong>the</strong> po<strong>in</strong>t <strong>of</strong> correlation change).The relationship between 7 and 28 day strength is affected by <strong>the</strong> cement typeand source, e.g. <strong>the</strong> strength ga<strong>in</strong> between 7 and 28 days <strong>of</strong> a <strong>concrete</strong> madewith a CEMI cement will be less than for an equivalent <strong>concrete</strong> b made with aCEMIII/B cement. Concretes with different cement types should <strong>the</strong>refore beei<strong>the</strong>r <strong>control</strong>led by separate <strong>control</strong> systems or <strong>the</strong> difference <strong>in</strong> correlationbetween different cement types considered <strong>in</strong> <strong>the</strong> corrections that are appliedwith<strong>in</strong> <strong>the</strong> <strong>concrete</strong> family [14]. Different sources <strong>of</strong> <strong>the</strong> same type and class <strong>of</strong>cement may have different 7:28 day strength ratios and if a source <strong>of</strong> cement ischanged, <strong>the</strong> validity <strong>of</strong> <strong>the</strong> current 7:28 day strength ratio should bereviewed.It is important to appreciate that calculat<strong>in</strong>g <strong>the</strong> correlation as a simplestraight-l<strong>in</strong>e relationship or as a simple percentage addition will not beaccurate at <strong>the</strong> limits <strong>of</strong> <strong>the</strong> mix design. This is because <strong>concrete</strong> mixes haveceil<strong>in</strong>g strengths that may be due to a failure <strong>of</strong> aggregate bond, failure <strong>of</strong> <strong>the</strong>aggregate particles <strong>the</strong>mselves or, as <strong>the</strong> cement content <strong>in</strong>creases, <strong>the</strong>voidage is <strong>in</strong>creas<strong>in</strong>g <strong>in</strong> proportion, i.e. <strong>the</strong> (w + air)/c ratio rema<strong>in</strong><strong>in</strong>gconstant. Therefore at <strong>the</strong> ceil<strong>in</strong>g strength, <strong>in</strong>creas<strong>in</strong>g <strong>the</strong> cement content <strong>of</strong><strong>the</strong> mix or us<strong>in</strong>g plasticisers to reduce w/c ratio will have little effect oncompressive strength. As <strong>the</strong> 28 day strength approaches <strong>the</strong> ceil<strong>in</strong>g strength,<strong>the</strong> ratio between 7:28 day strength will change. Clearly as <strong>the</strong> 28 day strengthapproaches <strong>the</strong> ceil<strong>in</strong>g strength, <strong>the</strong>re will be a reduced strength ga<strong>in</strong> from 7to 28 days. Similarly, at lower strengths, <strong>the</strong> results will tend to convergetowards zero.The <strong>in</strong>itial correlation may be established <strong>in</strong> different ways <strong>in</strong>clud<strong>in</strong>g:• Initial trial mixes at a range <strong>of</strong> cement contents;• Historical data.Once <strong>the</strong> <strong>in</strong>itial correlation is established, it needs to be checked rout<strong>in</strong>ely tocheck that it is still valid. This is <strong>the</strong> purpose <strong>of</strong> CUSUM C.An example CUSUM for correlation (CUSUM C) is shown <strong>in</strong> chapter 11. Thereare fewer data <strong>in</strong> <strong>the</strong> correlation CUSUM compared to <strong>the</strong> CUSUMs for meanand standard deviation because <strong>of</strong> <strong>the</strong> 21 day gap between 7 and 28 day resultsbecom<strong>in</strong>g available.In <strong>the</strong> example, <strong>the</strong> actual 28 day results have been used <strong>in</strong> place <strong>of</strong> <strong>the</strong>predicted 28 day data when <strong>the</strong>y become available. Some systems will only usepredicted data. However, all CUSUMs will recalculate <strong>the</strong> predicted data when<strong>the</strong> CUSUM shows a change <strong>in</strong> <strong>the</strong> correlation.b A <strong>concrete</strong> designed to produce <strong>the</strong> same 28 day strengthPage 22 <strong>of</strong> 53
<strong>Use</strong> <strong>of</strong> <strong>control</strong> <strong>charts</strong> <strong>in</strong> <strong>the</strong> <strong>production</strong> <strong>of</strong> <strong>concrete</strong>5.5 Design <strong>of</strong> V-maskThe design <strong>of</strong> <strong>the</strong> mask (i.e. <strong>the</strong> appropriate gradients and decision <strong>in</strong>tervals) isbased on statistical probabilities and <strong>the</strong>y are l<strong>in</strong>ked to <strong>the</strong> standard deviation<strong>of</strong> <strong>the</strong> plant as illustrated <strong>in</strong> Figure 9 for a typical CUSUM system.Figure 9: Design <strong>of</strong> V-maskA number <strong>of</strong> <strong>concrete</strong> producers have opted with <strong>the</strong>ir CUSUM systems t<strong>of</strong>ollow <strong>the</strong> ‘double-decision approach’ used <strong>in</strong> Shewhart <strong>charts</strong>, namely awarn<strong>in</strong>g l<strong>in</strong>e and a <strong>control</strong> limit, and take action when <strong>the</strong> warn<strong>in</strong>g l<strong>in</strong>e iscrossed. In this case <strong>the</strong> warn<strong>in</strong>g l<strong>in</strong>es are parallel to <strong>the</strong> X-axis and <strong>of</strong>fset by<strong>the</strong> same decision <strong>in</strong>terval as used <strong>in</strong> <strong>the</strong> traditional V-mask. Such an approachresults <strong>in</strong> action be<strong>in</strong>g taken sooner than with <strong>the</strong> traditional V-mask. As actionis be<strong>in</strong>g taken when <strong>the</strong> warn<strong>in</strong>g l<strong>in</strong>e is crossed, a <strong>control</strong> limit serves nopractical purpose and <strong>the</strong>y are usually omitted.5.6 Action follow<strong>in</strong>g changeWhen <strong>the</strong> CUSUM <strong>in</strong>dicates that <strong>the</strong> target mean strength or assumed standarddeviation is not be<strong>in</strong>g achieved, adjustments will be made to <strong>the</strong> <strong>concrete</strong><strong>production</strong>. Often, but not always, this requires a change <strong>in</strong> cement content orw/c ratio.The magnitude <strong>of</strong> <strong>the</strong> change required when <strong>the</strong> CUSUM M <strong>in</strong>dicates need foraction is effectively determ<strong>in</strong>ed by <strong>the</strong> number <strong>of</strong> results over which <strong>the</strong>process went out <strong>of</strong> <strong>control</strong> (a few po<strong>in</strong>ts would give a steep gradient andrepresent a large change, while conversely many po<strong>in</strong>ts would <strong>in</strong>dicate agradual change and a shallow gradient).The change <strong>in</strong> cement content can be calculated us<strong>in</strong>g <strong>the</strong> parabolic equation:dc = 0.75 x C mra x [(DI/n) + G]Where:• dc = change <strong>in</strong> cement content <strong>in</strong> kg/m 3equation 3Page 23 <strong>of</strong> 53
<strong>Use</strong> <strong>of</strong> <strong>control</strong> <strong>charts</strong> <strong>in</strong> <strong>the</strong> <strong>production</strong> <strong>of</strong> <strong>concrete</strong>• 0.75 is an anti-hunt<strong>in</strong>g factor to prevent oscillatory and complementarychanges occurr<strong>in</strong>g, i.e. it m<strong>in</strong>imises <strong>the</strong> risk <strong>of</strong> over-correct<strong>in</strong>g andhav<strong>in</strong>g to apply a second adjustment <strong>in</strong> <strong>the</strong> opposite direction• C mra is <strong>the</strong> relationship between strength and cement content from <strong>the</strong>ma<strong>in</strong> relationship (usually <strong>in</strong> <strong>the</strong> range 5 to 6 kg/m 3 to give a strength<strong>in</strong>crease <strong>of</strong> 1N/mm 2 )• DI is <strong>the</strong> decision <strong>in</strong>terval <strong>of</strong> V-mask (see Figure 9)• G is <strong>the</strong> gradient <strong>of</strong> V-mask (see Figure 9).Both DI and G are a function <strong>of</strong> standard deviation and have units <strong>of</strong> N/mm 2 .This relationship is shown graphically <strong>in</strong> Figure 10 for a change <strong>in</strong> <strong>the</strong> CUSUM M:<strong>the</strong> smaller <strong>the</strong> number <strong>of</strong> results <strong>the</strong> greater is <strong>the</strong> change required <strong>in</strong> cementcontent.Figure10: Action follow<strong>in</strong>g change <strong>in</strong> mean for different SD and run lengthA change <strong>in</strong> <strong>the</strong> standard deviation would result <strong>in</strong> a new target mean strengthbe<strong>in</strong>g adopted and <strong>the</strong>refore a correspond<strong>in</strong>g <strong>in</strong>crease or decrease <strong>in</strong> <strong>the</strong>cement content <strong>of</strong> <strong>the</strong> <strong>control</strong> mix and all o<strong>the</strong>r mixes <strong>in</strong> <strong>the</strong> <strong>concrete</strong> family.The <strong>in</strong>formation from a CUSUM that a change has occurred is only part <strong>of</strong> <strong>the</strong><strong>in</strong>formation available to <strong>the</strong> <strong>concrete</strong> producer. The aim <strong>of</strong> <strong>the</strong> producer is toidentify <strong>the</strong> cause <strong>of</strong> <strong>the</strong> change and take appropriate action at all relevantplants. For example if <strong>the</strong> change is identified as be<strong>in</strong>g due to a change <strong>in</strong>constituent A, <strong>the</strong> CUSUMs <strong>of</strong> all plants us<strong>in</strong>g constituent A should be checkedto show if <strong>the</strong>y are show<strong>in</strong>g <strong>the</strong> same trend. If so it would be prudent to takeaction even if <strong>the</strong> CUSUMs at one or more <strong>of</strong> <strong>the</strong>se plants have not yet<strong>in</strong>dicated a change sufficient to cross <strong>the</strong> <strong>control</strong> or warn<strong>in</strong>g l<strong>in</strong>es.A change <strong>in</strong> cement content or w/c ratio is not always required. For example if<strong>the</strong> cause <strong>of</strong> <strong>the</strong> change is known and it has been corrected, adjustment <strong>of</strong> <strong>the</strong>mix proportions may not be needed. A typical example <strong>of</strong> this is where <strong>the</strong>cement strength is known to have gone down, but subsequently recovered.Page 24 <strong>of</strong> 53
<strong>Use</strong> <strong>of</strong> <strong>control</strong> <strong>charts</strong> <strong>in</strong> <strong>the</strong> <strong>production</strong> <strong>of</strong> <strong>concrete</strong>6 Multivariable and Multigrade AnalysisMultigrade, multivariable CUSUM was developed by Ken Day [15] as adevelopment <strong>of</strong> <strong>the</strong> univariable CUSUM system discussed <strong>in</strong> chapter 5.6.1 MultivariableMultivariable CUSUM systems not only monitor a s<strong>in</strong>gle property <strong>of</strong> <strong>concrete</strong>,e.g. compressive strength, but <strong>in</strong>stead simultaneously monitor a number <strong>of</strong>properties, for example <strong>the</strong> Day’s CoNAD system plots;• Compressive strength;• Density;• Temperature;• Slump.Early action can be taken before <strong>the</strong> plot reaches <strong>the</strong> UCL or LCL because <strong>the</strong>downward trend <strong>in</strong> compressive strength may be accompanied by a downturn <strong>in</strong>density and ei<strong>the</strong>r (or both) an upturn <strong>in</strong> slump or temperature. If this patternoccurred over two or three results it <strong>in</strong>dicates a genu<strong>in</strong>e change and a probablecause (water addition). The temperature, slump and density <strong>in</strong>formation isavailable immediately and <strong>the</strong>refore trends can be detected prior to <strong>the</strong> 7 daystrengths be<strong>in</strong>g available. An illustration (without <strong>control</strong> limits) <strong>of</strong> a plot <strong>of</strong>multivariables is shown <strong>in</strong> Figure 11.Figure 11: Plot from Multivariable system6.2 MultigradeMultigrade CUSUMs are designed to <strong>in</strong>corporate <strong>concrete</strong>s from differentcompressive strength classes <strong>in</strong> <strong>the</strong> same CUSUM system. One approach is toPage 25 <strong>of</strong> 53
<strong>Use</strong> <strong>of</strong> <strong>control</strong> <strong>charts</strong> <strong>in</strong> <strong>the</strong> <strong>production</strong> <strong>of</strong> <strong>concrete</strong>adopt <strong>the</strong> family <strong>of</strong> mixes concept discussed <strong>in</strong> 7.2. However Day argues thatit is possible to sum differences from <strong>the</strong> current average value <strong>of</strong> any variable<strong>in</strong> each <strong>in</strong>dividual strength class <strong>of</strong> <strong>concrete</strong>, as though <strong>the</strong>y were all from <strong>the</strong>same average value. In this way results from high or low strength mixes andeven lightweight aggregate mixes can be <strong>in</strong>corporated <strong>in</strong>to <strong>the</strong> CUSUM [16].Day argues [17] that <strong>the</strong> advantages <strong>of</strong> this technique are:1. There is essentially no limit to <strong>the</strong> range <strong>of</strong> <strong>in</strong>dividual mixes that can betreated as a s<strong>in</strong>gle family.2. There is no requirement for adjustment formulas.3. There is no requirement for check<strong>in</strong>g that constituent mixes rema<strong>in</strong> asacceptable family members (except where a change po<strong>in</strong>t is detected).4. As a consequence <strong>of</strong> <strong>the</strong> above, change po<strong>in</strong>t detection is much morerapid and multi-variable CUSUMs become more effective <strong>in</strong> causedetection.An overall CUSUM can be plotted <strong>in</strong>corporat<strong>in</strong>g all <strong>the</strong> results. Additionally,<strong>the</strong> data for <strong>in</strong>dividual compressive strength classes can be analysed todeterm<strong>in</strong>e whe<strong>the</strong>r effects are across <strong>the</strong> range <strong>of</strong> mixes or are concentrated <strong>in</strong>specific compressive strength classes.As <strong>the</strong> trend is to hold all <strong>in</strong>formation on <strong>the</strong> computer system and <strong>in</strong>terrogateit for trends, differences between <strong>the</strong> operational practice <strong>of</strong> us<strong>in</strong>g CUSUM andmultivariable and multigrade analysis are less than <strong>the</strong>y appear. In bothsystems, <strong>the</strong> key is <strong>the</strong> operator understand<strong>in</strong>g <strong>the</strong> <strong>in</strong>formation be<strong>in</strong>g presentedby <strong>the</strong> <strong>control</strong> system, <strong>in</strong>terrogat<strong>in</strong>g <strong>the</strong> data to determ<strong>in</strong>e <strong>the</strong> cause andtak<strong>in</strong>g appropriate action.Page 26 <strong>of</strong> 53
<strong>Use</strong> <strong>of</strong> <strong>control</strong> <strong>charts</strong> <strong>in</strong> <strong>the</strong> <strong>production</strong> <strong>of</strong> <strong>concrete</strong>7 Speed<strong>in</strong>g <strong>the</strong> Response <strong>of</strong> <strong>the</strong> System7.1 Early age test<strong>in</strong>gBy us<strong>in</strong>g early strength data to predict 28 day strength, an adverse trend willbe detected more rapidly. If seven day test data are used, an adverse trendwill be detected three weeks earlier than wait<strong>in</strong>g for 28 day strength data.Generally <strong>control</strong> systems for mean strength are based on 7 day strengths as<strong>the</strong> risk <strong>of</strong> wait<strong>in</strong>g for 28 day test results is unacceptable to both <strong>the</strong> consumerand producer. However with certa<strong>in</strong> precast elements, process requirementslead to strengths that exceed <strong>the</strong> specified characteristic strength with<strong>in</strong> a fewdays and <strong>in</strong> this case test<strong>in</strong>g may be undertaken at a s<strong>in</strong>gle age less than28 days and <strong>the</strong> process <strong>control</strong>led us<strong>in</strong>g Shewhart <strong>charts</strong>. In this case <strong>the</strong>re isno need to predict 28 day strengths as <strong>the</strong>y already exceed what is specifiedand <strong>the</strong> sophistication <strong>of</strong> <strong>the</strong> CUSUM system is an unnecessary complication.Systems utilis<strong>in</strong>g accelerated tests (e.g. 1 or 2 days) have had limited success[6]. These systems generally entail heat<strong>in</strong>g <strong>the</strong> <strong>concrete</strong> samples but thisprocess <strong>in</strong>troduces a greater variability than is found <strong>in</strong> <strong>the</strong> normally cured 7day results.Test<strong>in</strong>g standard cured specimens at three days may <strong>in</strong>troduce greatervariability than test<strong>in</strong>g at 7 days. This is because at three days <strong>the</strong> <strong>in</strong>itialtemperature <strong>of</strong> <strong>the</strong> <strong>concrete</strong>, which is <strong>control</strong>led by <strong>the</strong> ambient conditions,has a greater impact on three day strength compared to 7 day strength. Inclimates that are similar to <strong>the</strong> UK, <strong>the</strong> 7:28 day strength ratio is likely to bemore stable than a 3:28 day strength ratio and it is <strong>the</strong> better choice for <strong>the</strong><strong>control</strong> system. The complications <strong>of</strong> modern <strong>concrete</strong>s, e.g. additions,admixtures, are also best handled us<strong>in</strong>g a 7:28 day strength relationship.The ratio between <strong>the</strong> early strength test data and <strong>the</strong> 28 day test data for <strong>the</strong>same mix is also monitored by a CUSUM to detect any significant change <strong>in</strong> <strong>the</strong>relationship. This is <strong>the</strong> CUSUM C described <strong>in</strong> 5.4. However, if one <strong>of</strong> <strong>the</strong>o<strong>the</strong>r <strong>control</strong> systems is used with early strength data, it is necessary tocont<strong>in</strong>ually check that <strong>the</strong> correlation has not changed. This may be done on acont<strong>in</strong>ual basis us<strong>in</strong>g, say, <strong>the</strong> last 10 results or periodically, say, every fifthresult.The multivariable CUSUM approach utilis<strong>in</strong>g data from temperature, densityand slump (discussed <strong>in</strong> chapter 6) claims to allow early <strong>in</strong>terpretation <strong>of</strong> data,i.e. a detection <strong>of</strong> a change <strong>in</strong> quality, than is possible with to a s<strong>in</strong>gle variableCUSUM.While predicted 28 day strengths are used to determ<strong>in</strong>e if action is needed tokeep <strong>the</strong> process under <strong>control</strong>, any conformity assessment is based on <strong>the</strong> 28day strength data and not <strong>the</strong> predicted data.7.2 Family <strong>of</strong> mixes conceptChanges <strong>in</strong> <strong>the</strong> performance <strong>of</strong> <strong>concrete</strong> are usually <strong>the</strong> result <strong>of</strong> a step change<strong>in</strong> a constituent material, e.g. between deliveries. Such a change will affect all<strong>concrete</strong> made with that constituent. A change <strong>in</strong> <strong>the</strong> function<strong>in</strong>g <strong>of</strong> a plantwill affect all <strong>concrete</strong> produced <strong>in</strong> that plant. To detect an adverse change <strong>in</strong>Page 27 <strong>of</strong> 53
<strong>Use</strong> <strong>of</strong> <strong>control</strong> <strong>charts</strong> <strong>in</strong> <strong>the</strong> <strong>production</strong> <strong>of</strong> <strong>concrete</strong>quality requires sufficient data, as a real change has to be separated fromnormal variability. Controll<strong>in</strong>g each <strong>concrete</strong> separately will delay <strong>the</strong> timetaken to detect an adverse change. Utilis<strong>in</strong>g <strong>the</strong> family <strong>of</strong> <strong>concrete</strong>s approachenables more test results to be <strong>in</strong>corporated <strong>in</strong>to <strong>the</strong> system. This speeds up<strong>the</strong> time taken to detect a significant change. For example Figure 5, <strong>the</strong>Shewhart analysis <strong>of</strong> <strong>the</strong> data <strong>in</strong> Table 4, shows 7 results above <strong>the</strong> target valueand this <strong>in</strong>dicates a significant trend. To identify this trend clearly it needs 7results to be entered <strong>in</strong>to <strong>the</strong> system. If each compressive strength class <strong>of</strong><strong>concrete</strong> were monitored separately, it is possible that <strong>the</strong>se 7 results couldhave been at 7 different compressive strength classes and <strong>the</strong>refore each<strong>control</strong> system would only have a s<strong>in</strong>gle result entered, and no trend wouldhave been detected.Clearly not all <strong>the</strong> <strong>concrete</strong> produced at a ready-mixed <strong>concrete</strong> plant is <strong>the</strong>same compressive strength class; <strong>in</strong> fact a huge variety <strong>of</strong> mixes can beproduced. Concretes can be produced with various compressive strengthclasses, with different consistences; with and without a variety <strong>of</strong> admixtureson <strong>the</strong>ir own or <strong>in</strong> comb<strong>in</strong>ation; with different aggregate sizes, types andproportions <strong>of</strong> f<strong>in</strong>e aggregates; with different m<strong>in</strong>imum cement content andmaximum water cement ratio specifications; with or without fibres; withdifferent cements and additions etc. The range <strong>of</strong> mixes produced at a precastfactory will be significantly smaller. Even with only two <strong>concrete</strong> types be<strong>in</strong>gtested at <strong>the</strong> same rate, comb<strong>in</strong><strong>in</strong>g <strong>the</strong> data <strong>in</strong>to a family will halve <strong>the</strong> timetaken to detect an adverse change.Each mix may be <strong>control</strong>led <strong>in</strong>dividually (particularly at a precast works), or by<strong>the</strong> specified compressive strength class. Alternatively, EN 206-1 allows similar<strong>concrete</strong>s to be grouped toge<strong>the</strong>r <strong>in</strong>to a family c <strong>of</strong> mixes and <strong>the</strong> <strong>control</strong>system can be applied to <strong>the</strong> family.Annex K <strong>of</strong> EN 206-1:2000 recommends where <strong>the</strong>re is little experience <strong>of</strong> <strong>the</strong>use <strong>of</strong> <strong>concrete</strong> families <strong>the</strong> follow<strong>in</strong>g may be <strong>in</strong>cluded <strong>in</strong> a family• cement <strong>of</strong> one type, strength class and source;• demonstrably similar aggregates and type I additions;• <strong>concrete</strong>s with or without a water reduc<strong>in</strong>g/plasticiz<strong>in</strong>g admixture;• full range <strong>of</strong> consistence classes;• <strong>concrete</strong>s with a limited range <strong>of</strong> strength classes.Valid correction factors are established for <strong>the</strong>se variables and for <strong>the</strong> variousmembers <strong>of</strong> <strong>the</strong> family, to make results comparable, and to enable <strong>the</strong>m all tobe used <strong>in</strong> a s<strong>in</strong>gle CUSUM <strong>control</strong> system.The start<strong>in</strong>g po<strong>in</strong>t for any family is <strong>the</strong> selection <strong>of</strong> a consistence, maximumaggregate size and a set <strong>of</strong> constituent materials. For this selection <strong>the</strong>relationship between strength and cement content (or water/cement ratio) isdeterm<strong>in</strong>ed and this is called <strong>the</strong> ma<strong>in</strong> relationship d . The ma<strong>in</strong> relationship isusually established by a series <strong>of</strong> trial mixes at vary<strong>in</strong>g cement contents,c Def<strong>in</strong>ed <strong>in</strong> EN 206-1[3] as “group <strong>of</strong> <strong>concrete</strong> compositions for which a reliable relationship betweenrelevant properties is established and documented”d Def<strong>in</strong>ed <strong>in</strong> <strong>the</strong> QSRMC regulations [18] as “The relationship established between cement content andstrength. It will normally be <strong>the</strong> relationship aris<strong>in</strong>g from fitt<strong>in</strong>g a curve to data aris<strong>in</strong>g from a series <strong>of</strong> trial<strong>concrete</strong> mixes”Page 28 <strong>of</strong> 53
<strong>Use</strong> <strong>of</strong> <strong>control</strong> <strong>charts</strong> <strong>in</strong> <strong>the</strong> <strong>production</strong> <strong>of</strong> <strong>concrete</strong>computer modell<strong>in</strong>g plus a limited number <strong>of</strong> trial mixes or be determ<strong>in</strong>ed byanalys<strong>in</strong>g <strong>production</strong> data. From this relationship, <strong>the</strong> mix proportions toachieve any target strength can be <strong>in</strong>terpolated for this set <strong>of</strong> materials,consistence and maximum aggregate size. Simple numerical adjustments to <strong>the</strong>cement and f<strong>in</strong>e aggregate contents (called secondary relationships) are madeto convert <strong>concrete</strong>s covered by <strong>the</strong> ma<strong>in</strong> relationship to o<strong>the</strong>r <strong>concrete</strong>s <strong>in</strong> <strong>the</strong>family or vice versa. The reference <strong>concrete</strong> to which all o<strong>the</strong>r tested<strong>concrete</strong>s are converted lies on <strong>the</strong> ma<strong>in</strong> relationship.The ma<strong>in</strong> and secondary family relationships are used <strong>in</strong> two directions. Theyare used to determ<strong>in</strong>e <strong>the</strong> mix proportions needed to satisfy a <strong>concrete</strong>specification, i.e. for <strong>concrete</strong> mix proportion<strong>in</strong>g, and <strong>the</strong>y are used to convert<strong>the</strong> strength <strong>of</strong> a tested <strong>concrete</strong> to <strong>the</strong> value it would have been if it had been<strong>the</strong> reference <strong>concrete</strong>. These equivalent strength values are used as <strong>in</strong>putdata to <strong>control</strong> <strong>charts</strong>.Where reliable relationships are established to <strong>the</strong> reference <strong>concrete</strong>, o<strong>the</strong>r<strong>concrete</strong>s may also be <strong>in</strong>cluded <strong>in</strong> <strong>the</strong> family. With <strong>the</strong> power <strong>of</strong> comput<strong>in</strong>g,<strong>the</strong> trend is to make use <strong>of</strong> <strong>the</strong> option <strong>of</strong> ei<strong>the</strong>r <strong>in</strong>clud<strong>in</strong>g or exclud<strong>in</strong>g a widerange <strong>of</strong> mixes from <strong>the</strong> family and to analysis <strong>the</strong> data <strong>in</strong> different ways. Themultigrade system and CUSUM system are capable <strong>of</strong> support<strong>in</strong>g suchsophisticated analyses. For example a number <strong>of</strong> plants us<strong>in</strong>g <strong>the</strong> samematerials could be <strong>in</strong>cluded with<strong>in</strong> a family, but while <strong>the</strong> comb<strong>in</strong>ed data areanalysed for trends, each plant is also reviewed separately. Even when dataare not comb<strong>in</strong>ed <strong>in</strong>to families, <strong>the</strong> data can be exam<strong>in</strong>ed to confirm trends.For example if Family A is <strong>in</strong>dicat<strong>in</strong>g a particular trend and it is believed to bedue to a change <strong>of</strong> constituent X, <strong>the</strong> data from o<strong>the</strong>r families/mixesconta<strong>in</strong><strong>in</strong>g this constituent should also be reviewed for signs <strong>of</strong> <strong>the</strong> same trendand, if appropriate, action.In general air entra<strong>in</strong>ed <strong>concrete</strong> is not <strong>in</strong>cluded <strong>in</strong> a family and it is <strong>control</strong>ledas a separate <strong>concrete</strong>, because <strong>of</strong> <strong>the</strong> additional variability caused byvariations <strong>in</strong> <strong>the</strong> air content. However if it is be<strong>in</strong>g <strong>control</strong>led by a CUSUMsystem, it is also normal to adjust <strong>the</strong> strength on <strong>the</strong> basis <strong>of</strong> <strong>the</strong> measured aircontent. This is to avoid mak<strong>in</strong>g unnecessary changes to <strong>the</strong> mix proportionswhen <strong>the</strong> changes <strong>in</strong> strength are simply <strong>the</strong> result <strong>of</strong> variable air content.When <strong>control</strong>l<strong>in</strong>g a family <strong>of</strong> mixes, <strong>the</strong> <strong>control</strong> strength <strong>of</strong> <strong>the</strong> reference<strong>concrete</strong> (to which o<strong>the</strong>r compressive strength classes <strong>of</strong> <strong>concrete</strong> arecorrected) is ei<strong>the</strong>r a <strong>concrete</strong> which represents <strong>the</strong> most common mixproduced at a plant or is mid-range <strong>in</strong> <strong>the</strong> family. It has to be a <strong>concrete</strong> on<strong>the</strong> ma<strong>in</strong> relationship. A number <strong>of</strong> adjustments may need to be applied to atest result to ensure that it can be compared to <strong>the</strong> reference <strong>concrete</strong>, e.g.for slump or for <strong>the</strong> <strong>in</strong>clusion <strong>of</strong> a plasticiser. The first steps are to convert <strong>the</strong>measured strength <strong>of</strong> <strong>the</strong> tested <strong>concrete</strong> <strong>in</strong>to an equivalent strength <strong>of</strong> a<strong>concrete</strong> on <strong>the</strong> ma<strong>in</strong> relationship and <strong>the</strong>n this equivalent strength is movedalong <strong>the</strong> ma<strong>in</strong> relationship to become <strong>the</strong> equivalent strength <strong>of</strong> <strong>the</strong> reference<strong>concrete</strong>. See <strong>the</strong> CUSUM example <strong>in</strong> chapter 11.In practice, <strong>the</strong> adjustments for consistence and constituents are applied to<strong>the</strong> cement content <strong>of</strong> <strong>the</strong> tested <strong>concrete</strong> so that it is deemed to beequivalent to a <strong>concrete</strong> on <strong>the</strong> ma<strong>in</strong> relationship <strong>in</strong> terms <strong>of</strong> constituents andconsistence. The measured strength <strong>of</strong> <strong>the</strong> tested <strong>concrete</strong> may be above,Page 29 <strong>of</strong> 53
<strong>Use</strong> <strong>of</strong> <strong>control</strong> <strong>charts</strong> <strong>in</strong> <strong>the</strong> <strong>production</strong> <strong>of</strong> <strong>concrete</strong>below or <strong>the</strong> same as <strong>the</strong> strength value on <strong>the</strong> ma<strong>in</strong> relationship for <strong>the</strong>adjusted cement content. A fur<strong>the</strong>r adjustment needs to be made to <strong>the</strong>predicted test result to allow for <strong>the</strong> difference between <strong>the</strong> strengths at <strong>the</strong>adjusted cement content and <strong>the</strong> cement content <strong>of</strong> <strong>the</strong> reference <strong>concrete</strong>.This is <strong>in</strong> order to determ<strong>in</strong>e what strength <strong>the</strong> tested <strong>concrete</strong> would haveachieved if it had had <strong>the</strong> same cement content as <strong>the</strong> reference <strong>concrete</strong>. It isthis twice adjusted result that is compared with <strong>the</strong> target mean strength <strong>of</strong><strong>the</strong> reference <strong>concrete</strong>, and <strong>the</strong> difference between <strong>the</strong>se values is <strong>the</strong>napplied <strong>in</strong> <strong>the</strong> CUSUM.Page 30 <strong>of</strong> 53
<strong>Use</strong> <strong>of</strong> <strong>control</strong> <strong>charts</strong> <strong>in</strong> <strong>the</strong> <strong>production</strong> <strong>of</strong> <strong>concrete</strong>8 Guidance on Control Systems8.1 Abnormal ResultsFrom time to time, results will occur that are outliers to <strong>the</strong> bulk <strong>of</strong> <strong>the</strong> data.These results could be due to a number <strong>of</strong> reasons, for example, a test<strong>in</strong>g erroror misreport<strong>in</strong>g. If an outlier is <strong>in</strong>cluded <strong>in</strong> <strong>the</strong> ma<strong>in</strong> data analysis, it coulddisproportionately affect <strong>the</strong> <strong>control</strong> system and result <strong>in</strong> actions be<strong>in</strong>g takento adjust <strong>the</strong> process that are unnecessary (which could <strong>in</strong>crease <strong>the</strong> risk to <strong>the</strong>user <strong>of</strong> <strong>the</strong> <strong>concrete</strong>). However, except where it is technically justifiable anddocumented, each outlier is checked for conformity aga<strong>in</strong>st <strong>the</strong> EN 206-1<strong>in</strong>dividual batch criterion.A general rule adopted is that results more than 3σ (3 standard deviations)away from <strong>the</strong> mean should be considered as outliers and <strong>the</strong>refore excludedfrom <strong>the</strong> analysis. The 3σ value equates to 3 results <strong>in</strong> a thousand (see Table2). However if a result that breaches <strong>the</strong> 3σ limit is followed by one that isgreater than 2σ <strong>in</strong> <strong>the</strong> same direction, <strong>the</strong>n both results should be <strong>in</strong>cluded <strong>in</strong><strong>the</strong> <strong>control</strong> system and an immediate <strong>in</strong>vestigation undertaken to identifywhe<strong>the</strong>r a significant change has occurred.8.2 Handl<strong>in</strong>g mixes outside <strong>the</strong> <strong>concrete</strong> familyThe <strong>control</strong> system will provide <strong>in</strong>formation on <strong>concrete</strong> <strong>in</strong> <strong>the</strong> family <strong>of</strong> mixesthat are used with<strong>in</strong> <strong>the</strong> system. The ma<strong>in</strong> relationship for a <strong>concrete</strong> familycan also be used to <strong>control</strong> mixes that are outside <strong>the</strong> family. This can be done<strong>in</strong> a number <strong>of</strong> ways:• The cement content <strong>of</strong> non-family <strong>concrete</strong> can be l<strong>in</strong>ked to aconservative value for that <strong>of</strong> <strong>the</strong> <strong>control</strong> mix, and if <strong>the</strong> cement contentfor <strong>the</strong> <strong>control</strong> mix is <strong>in</strong>creased, a review is undertaken <strong>of</strong> <strong>the</strong> mixdesign <strong>of</strong> <strong>the</strong> non-family <strong>concrete</strong>;• Establish<strong>in</strong>g a safe cement content differential (may be higher or lower)to be applied to different cement types or cement blend levels. Thesedifferentials can be established through trial mixes <strong>in</strong> <strong>the</strong> laboratory orfrom o<strong>the</strong>r <strong>control</strong> systems. This procedure is particularly useful when acritical <strong>concrete</strong> is produced <strong>in</strong>frequently. In effect this <strong>in</strong>creases <strong>the</strong>marg<strong>in</strong> between <strong>the</strong> specified characteristic strength and <strong>the</strong> targetstrength.8.3 Handl<strong>in</strong>g mixes not <strong>control</strong>led by compressive strengthrequirementsWhere mix proportions, particularly cement content per cubic metre, are<strong>control</strong>led by <strong>the</strong> strength criteria, sett<strong>in</strong>g <strong>the</strong> target strength for <strong>the</strong> mix isrelatively straightforward. It is <strong>the</strong> specified characteristic strength plus <strong>the</strong>marg<strong>in</strong>. However, strength does not always determ<strong>in</strong>e <strong>the</strong> mix design. Forexample a foundation to be placed <strong>in</strong> aggressive ground conditions may requirea structural strength <strong>of</strong> only C25/30, but due to <strong>the</strong> need to resist <strong>the</strong>aggressive ground <strong>the</strong> maximum w/c ratio may be 0.45, which <strong>in</strong> reality willproduce a strength well above that needed for achiev<strong>in</strong>g <strong>the</strong> specifiedPage 31 <strong>of</strong> 53
<strong>Use</strong> <strong>of</strong> <strong>control</strong> <strong>charts</strong> <strong>in</strong> <strong>the</strong> <strong>production</strong> <strong>of</strong> <strong>concrete</strong>characteristic strength. The target strength should be determ<strong>in</strong>ed from <strong>the</strong>higher <strong>of</strong> <strong>the</strong> (possibly) different cement contents required to conform to <strong>the</strong>specified strength, maximum water/cement ratio, and m<strong>in</strong>imum cementcontent.If this procedure is not followed, i.e. if <strong>the</strong> target strength is determ<strong>in</strong>ed from<strong>the</strong> specified strength alone, <strong>the</strong> standard deviation will <strong>in</strong>crease significantlyand <strong>the</strong> result may appear as an outlier (on <strong>the</strong> high side). However <strong>the</strong> mostserious consequence is that an adverse trend may take much longer to cross<strong>the</strong> V-mask due to <strong>the</strong> step change <strong>in</strong> trend caused by <strong>the</strong> result.Example 5A <strong>concrete</strong> has been specified as C25/30, maximum w/c ratio <strong>of</strong> 0.55,m<strong>in</strong>imum cement content <strong>of</strong> 300 kg/m 3 . Assum<strong>in</strong>g a standard deviation <strong>of</strong>4 N/mm 2 with<strong>in</strong> a family <strong>of</strong> <strong>concrete</strong>s a C25/30 <strong>concrete</strong> has a target strength<strong>of</strong> 38 N/mm 2 (cube). However <strong>the</strong> target w/c ratio <strong>of</strong> 0.53 equates to a targetstrength <strong>of</strong> 48 N/mm 2 and this higher value should be used as <strong>the</strong> target.The measured strength is 44 N/mm 2 . As <strong>the</strong>re is an exist<strong>in</strong>g adverse trend <strong>in</strong><strong>the</strong> results this result triggers action, Figure 12a). However if <strong>the</strong> targetstrength <strong>of</strong> this <strong>concrete</strong> had been <strong>in</strong>correctly entered as 38 N/mm 2 , <strong>in</strong>stead <strong>of</strong><strong>the</strong> result be<strong>in</strong>g 4 N/mm 2 below <strong>the</strong> target strength <strong>of</strong> 48 N/mm 2 , it wouldappear 6 N/mm 2 above <strong>the</strong> target strength <strong>of</strong> 38 N/mm 2 . This <strong>in</strong>correct entrywould not trigger action nor would it be identified as an outlier (currentstandard deviation is 4 N/mm 2 and <strong>the</strong> actual value is less than 3σ from <strong>the</strong>target value, see Figure 12b).Page 32 <strong>of</strong> 53
<strong>Use</strong> <strong>of</strong> <strong>control</strong> <strong>charts</strong> <strong>in</strong> <strong>the</strong> <strong>production</strong> <strong>of</strong> <strong>concrete</strong>a) Correct strength entry for w/c <strong>control</strong>led <strong>concrete</strong>b) Incorrect strength entry for w/c <strong>control</strong>led <strong>concrete</strong>Figure 12: Example <strong>of</strong> <strong>the</strong> effects <strong>of</strong> <strong>in</strong>correctly enter<strong>in</strong>g <strong>the</strong> target strength for amix <strong>control</strong>led by <strong>the</strong> maximum w/c ratioFor clarity, <strong>the</strong> transposition <strong>of</strong> <strong>the</strong>se results to <strong>the</strong> equivalent value <strong>of</strong> <strong>the</strong>reference <strong>concrete</strong> has not been described.8.4 Test ratesIt is important that <strong>the</strong> appropriate level and frequency <strong>of</strong> test<strong>in</strong>g isma<strong>in</strong>ta<strong>in</strong>ed <strong>in</strong> <strong>the</strong> <strong>control</strong> system. If <strong>the</strong> test<strong>in</strong>g rate is too low, it will take toolong to recognise that <strong>the</strong> system is no longer <strong>in</strong> <strong>control</strong> and <strong>the</strong>re will be anunacceptable risk that non-conform<strong>in</strong>g product is supplied to <strong>the</strong> customer. Itwould be uneconomic to test every s<strong>in</strong>gle batch <strong>of</strong> <strong>concrete</strong> that is produced,so a test rate is required to produce a situation where <strong>the</strong> risk is sharedreasonably between producer and user.Page 33 <strong>of</strong> 53
<strong>Use</strong> <strong>of</strong> <strong>control</strong> <strong>charts</strong> <strong>in</strong> <strong>the</strong> <strong>production</strong> <strong>of</strong> <strong>concrete</strong>For a given rate <strong>of</strong> <strong>production</strong>, as <strong>the</strong> rate <strong>of</strong> test<strong>in</strong>g <strong>in</strong>creases <strong>the</strong> level <strong>of</strong>auto-correlation <strong>in</strong>creases. Auto-correlation is <strong>the</strong> measure <strong>of</strong> <strong>the</strong> relationshipbetween a result and previous results. A high level <strong>of</strong> auto-correlation <strong>in</strong>dicatesthat a result is unlikely to be significantly different from <strong>the</strong> previous results(e.g. when two successive deliveries <strong>of</strong> <strong>the</strong> same type <strong>of</strong> <strong>concrete</strong> are sampled)and test<strong>in</strong>g at a lower rate will provide <strong>the</strong> same level <strong>of</strong> <strong>control</strong> at a lowercost. However it has to be recognised that plants with low rates <strong>of</strong> <strong>production</strong>may not be able to achieve <strong>the</strong> optimal rate <strong>of</strong> test<strong>in</strong>g. One way <strong>of</strong> handl<strong>in</strong>glow test rates is to have an additional cement differential, i.e. more cementthan that <strong>in</strong>dicated by <strong>the</strong> mix proportion<strong>in</strong>g, to protect <strong>the</strong> user from <strong>the</strong> riskassociated with low test<strong>in</strong>g rates.A test rate <strong>of</strong> about 16 results per month provides enough data to run aneffective <strong>control</strong> system without an excessive level <strong>of</strong> auto-correlation.The effect <strong>of</strong> auto-correlation is m<strong>in</strong>imised <strong>in</strong> <strong>the</strong> calculation <strong>of</strong> <strong>the</strong> effect <strong>of</strong> achange <strong>in</strong> <strong>the</strong> <strong>control</strong> system by <strong>the</strong> use <strong>of</strong> an anti-hunt<strong>in</strong>g factor (see 5.5).8.5 Action follow<strong>in</strong>g changeAn <strong>in</strong>vestigation should be undertaken to determ<strong>in</strong>e <strong>the</strong> cause <strong>of</strong> <strong>the</strong> change. ACUSUM system will <strong>in</strong>dicate <strong>the</strong> approximate time when <strong>the</strong> system startedgo<strong>in</strong>g out <strong>of</strong> <strong>control</strong>, aid<strong>in</strong>g <strong>the</strong> <strong>in</strong>vestigation.The over-rid<strong>in</strong>g pr<strong>in</strong>ciple is to protect <strong>the</strong> user <strong>of</strong> <strong>concrete</strong>. If <strong>the</strong> cause <strong>of</strong> anadverse change cannot be identified, all <strong>concrete</strong>s <strong>in</strong> <strong>the</strong> family need to beadjusted. The appropriate <strong>in</strong>crease or decrease <strong>in</strong> <strong>control</strong> cement content isestablished from <strong>the</strong> <strong>control</strong> system, <strong>the</strong> general rule is that upward changes <strong>in</strong>cement content are obligatory and downward changes are optional.As expla<strong>in</strong>ed <strong>in</strong> 5.5, <strong>the</strong> appropriate action may be not to change <strong>the</strong> mixproportions, as <strong>the</strong> cause <strong>of</strong> <strong>the</strong> change has been already identified andcorrected, e.g. <strong>the</strong> weigh scales have been repaired and re-calibrated. Goodpractice has been to have a m<strong>in</strong>imum value <strong>of</strong> standard deviation, typically <strong>in</strong><strong>the</strong> range 3.0 N/mm 2 to 3.5 N/mm 2 . This means that when <strong>the</strong> <strong>control</strong> systemshows <strong>the</strong> standard deviation is lower than this m<strong>in</strong>imum value it is notadopted and <strong>the</strong> higher m<strong>in</strong>imum value is assumed. With s<strong>in</strong>gle <strong>concrete</strong>s andshort <strong>production</strong> runs, it is possible to achieve a standard deviation <strong>in</strong> <strong>the</strong> order<strong>of</strong> 2 N/mm 2 . However, changes between batches <strong>of</strong> cement can result <strong>in</strong>changes <strong>of</strong> <strong>concrete</strong> strength <strong>in</strong> <strong>the</strong> order <strong>of</strong> 1 N/mm 2 and this equates <strong>of</strong> 0.5σwith a standard deviation <strong>of</strong> 2N/mm 2 and an <strong>in</strong>creased risk <strong>of</strong> non-conformity.Hav<strong>in</strong>g a m<strong>in</strong>imum standard deviation protects <strong>the</strong> user and producer.Page 34 <strong>of</strong> 53
<strong>Use</strong> <strong>of</strong> <strong>control</strong> <strong>charts</strong> <strong>in</strong> <strong>the</strong> <strong>production</strong> <strong>of</strong> <strong>concrete</strong>9 EN 206-1 Conformity Rules for Compressive Strength9.1 Basic requirements for conformity <strong>of</strong> compressive strengthEN 206-1[3], <strong>the</strong> European standard for <strong>concrete</strong>, states that conformityassessment shall be made on test results taken dur<strong>in</strong>g an assessment periodthat shall not exceed <strong>the</strong> last twelve months. Conformity <strong>of</strong> <strong>concrete</strong>compressive strength is assessed on specimens tested at 28 days e by apply<strong>in</strong>gtwo criteria:Criterion 1 — applies to groups <strong>of</strong> n non-overlapp<strong>in</strong>g or overlapp<strong>in</strong>gconsecutive test results f f cm ;Criterion 2 — applies to each <strong>in</strong>dividual test result f g ci .The criteria are given <strong>in</strong> Table 6.Table 6: EN 206-1 Conformity CriteriaProduction Number n <strong>of</strong> test Criterion 1 Criterion 2results forcompressivestrength <strong>in</strong> <strong>the</strong>Mean <strong>of</strong> n results( f cm )N/mm2Any <strong>in</strong>dividualtest result ( f ci )N/mm2groupInitial 3 ≥ f ck + 4 ≥ f ck — 4Cont<strong>in</strong>uous Not less than 15 ≥ f ck + 1.48σ ≥ f ck — 4Depend<strong>in</strong>g upon <strong>the</strong> shape <strong>of</strong> <strong>the</strong> test specimens, <strong>the</strong> appropriatecharacteristic strength, f ck , is selected for <strong>the</strong> specified compressive strengthclass. The same criteria apply regardless <strong>of</strong> whe<strong>the</strong>r cyl<strong>in</strong>der or cube strengthsare measured.Based on criteria def<strong>in</strong>ed <strong>in</strong> EN 206-1, <strong>the</strong> <strong>production</strong> is def<strong>in</strong>ed as ei<strong>the</strong>r‘<strong>in</strong>itial’ or ‘cont<strong>in</strong>uous’. Based on this classification <strong>of</strong> <strong>production</strong>, conformityis confirmed if both <strong>the</strong> criteria given <strong>in</strong> Table 6 are satisfied.Where conformity is assessed on <strong>the</strong> basis <strong>of</strong> a <strong>concrete</strong> family (see 7.2),Criterion 1 is to be applied to <strong>the</strong> reference <strong>concrete</strong> tak<strong>in</strong>g <strong>in</strong>to account alltransposed test results <strong>of</strong> <strong>the</strong> family; Criterion 2 is to be applied to <strong>the</strong> orig<strong>in</strong>altest results, i.e. for conformity <strong>of</strong> <strong>the</strong> <strong>in</strong>dividual batch, <strong>the</strong> test result cannotbe less than <strong>the</strong> characteristic strength associated with <strong>the</strong> specifiedcompressive strength class m<strong>in</strong>us 4 N/mm 2 .The UK Quarry Products Association (now part <strong>of</strong> <strong>the</strong> UK’s M<strong>in</strong>eral ProductsAssociation) has produced detailed Guidance on <strong>the</strong> application <strong>of</strong> <strong>the</strong> EN 206-1conformity rules [4], and it is demonstrated that <strong>the</strong> risk to <strong>the</strong> <strong>concrete</strong>producer from <strong>the</strong> mean strength (≥ (fck + 1.48σ)) criterion is unacceptablyhigh for 15 results even when us<strong>in</strong>g a <strong>production</strong> marg<strong>in</strong> <strong>of</strong> 1.96σ. Such amarg<strong>in</strong> may be adequate for <strong>the</strong> <strong>in</strong>dividual batch criterion (equivalent to a 3 <strong>in</strong>a 1000 chance <strong>of</strong> fail<strong>in</strong>g when <strong>the</strong> standard deviation is 4.0 N/mm 2 ) but <strong>the</strong>e If <strong>the</strong> strength is specified for a different age <strong>the</strong> conformity is assessed on specimens tested at <strong>the</strong>specified agef f cm is <strong>the</strong> mean compressive strength <strong>of</strong> <strong>concrete</strong>g f ci is <strong>the</strong> <strong>in</strong>dividual test result for compressive strength <strong>of</strong> <strong>concrete</strong>Page 35 <strong>of</strong> 53
<strong>Use</strong> <strong>of</strong> <strong>control</strong> <strong>charts</strong> <strong>in</strong> <strong>the</strong> <strong>production</strong> <strong>of</strong> <strong>concrete</strong>producer’s risk <strong>of</strong> fail<strong>in</strong>g <strong>the</strong> mean strength criterion rema<strong>in</strong>s high. Simply<strong>in</strong>creas<strong>in</strong>g <strong>the</strong> rate <strong>of</strong> test<strong>in</strong>g to some very high level does not solve <strong>the</strong>problem due to <strong>the</strong> <strong>in</strong>creased level <strong>of</strong> auto-correlation <strong>of</strong>f-sett<strong>in</strong>g <strong>the</strong> benefitfrom <strong>the</strong> <strong>in</strong>creased number <strong>of</strong> test data.9.2 Assessment periodAcross Europe, <strong>the</strong> actual rate <strong>of</strong> test<strong>in</strong>g <strong>in</strong> practice is variable. Test rates andlengths <strong>of</strong> conformity assessment periods have significant implications forconformity. At a rate <strong>of</strong> test<strong>in</strong>g <strong>of</strong> 15 results a month, it would take about onemonth to detect that a change <strong>of</strong> 0.5σ lower than target had occurred, i.e. forthis month <strong>the</strong> mean strength would have been, for example (1.96 — 0.5)σ,which would be a failure <strong>of</strong> <strong>the</strong> mean strength criterion if <strong>the</strong> assessmentperiod was one month. By tak<strong>in</strong>g immediate action, <strong>the</strong> producer can adjust<strong>the</strong> mix proportions, e.g. <strong>in</strong>crease <strong>the</strong> cement content, to give <strong>the</strong> expectedtarget strength, and when <strong>the</strong> results are averaged over a longer period, <strong>the</strong><strong>concrete</strong> will be <strong>in</strong> conformity for <strong>the</strong> whole <strong>of</strong> <strong>the</strong> assessment period. The factthat <strong>the</strong> same rules applied to <strong>the</strong> same data over different assessment periodscan produce different conformity results, does not <strong>in</strong>spire confidence <strong>in</strong> <strong>the</strong>process.The statistical basis <strong>of</strong> <strong>the</strong> mean strength criterion <strong>in</strong> EN 206-1 is <strong>the</strong>achievement <strong>of</strong> an AOQL <strong>of</strong> 5%. Failure to conform to <strong>the</strong> mean strengthcriteria shows that <strong>the</strong> average outgo<strong>in</strong>g quality limit is more than 5% and notthat <strong>the</strong> <strong>concrete</strong> is unfit for purpose. However it is an <strong>in</strong>dication that <strong>the</strong>producer needs to take action to achieve an AOQL <strong>of</strong> 5%9.3 Conformity rules for compressive strengthIf <strong>the</strong> assessment period selected by <strong>the</strong> producer is one year and all <strong>the</strong>results <strong>in</strong> a family are used, <strong>the</strong> risk <strong>of</strong> non-conformity over <strong>the</strong> assessmentperiod is close to zero. However over this year <strong>the</strong>re could be periods where<strong>the</strong> <strong>production</strong> was not achiev<strong>in</strong>g <strong>the</strong> specified characteristic strength, seeFigure 13.Example 6This example is based on conformity to <strong>the</strong> mean strength criterion <strong>of</strong> aC25/30 <strong>concrete</strong> with a target strength is 38 N/mm 2 (cube), i.e. a marg<strong>in</strong> <strong>of</strong>2σ. The standard deviation is a constant 4 N/mm 2 . Figure 13 comprisesrandomly generated data with a mean strength <strong>of</strong> 38 N/mm 2 except for results77 to 109 where <strong>the</strong> mean strength is set at 35 N/mm 2 for <strong>the</strong> numbergeneration. However <strong>the</strong> data set was manually adjusted to exclude <strong>in</strong>dividualfailures, as <strong>in</strong> practice such results are declared as non-conform<strong>in</strong>g andexcluded from <strong>the</strong> analysis <strong>of</strong> conformity <strong>of</strong> mean strength, i.e. <strong>the</strong>y no longerform part <strong>of</strong> <strong>the</strong> population claimed to be <strong>in</strong> conformity .The runn<strong>in</strong>g mean <strong>of</strong> 15 <strong>in</strong>dicates non-conformity between results 86 to 100and this transposes to non-conformity <strong>of</strong> <strong>concrete</strong> represented by test results((86 — 15) = 71 to 100) yet this period <strong>of</strong> ‘non-conformity’ is disguised when<strong>the</strong> assessment period is one year.For <strong>the</strong> purposes <strong>of</strong> discussion, it is assumed that <strong>the</strong> data, and <strong>the</strong> <strong>concrete</strong><strong>production</strong>, were not subject to <strong>production</strong> <strong>control</strong> us<strong>in</strong>g one <strong>of</strong> <strong>the</strong> <strong>control</strong>Page 36 <strong>of</strong> 53
<strong>Use</strong> <strong>of</strong> <strong>control</strong> <strong>charts</strong> <strong>in</strong> <strong>the</strong> <strong>production</strong> <strong>of</strong> <strong>concrete</strong>chart systems described <strong>in</strong> this publication. If such a <strong>control</strong> system had been<strong>in</strong> operation, <strong>the</strong> change <strong>in</strong> mean strength would have been detected and <strong>the</strong><strong>production</strong> would have been changed well before result 109.Figure 13: Illustration <strong>of</strong> <strong>the</strong> potential problem with us<strong>in</strong>g a long assessmentperiodF<strong>in</strong>d<strong>in</strong>g a solution that is fair to both consumers and producers is not easy as<strong>the</strong> solution has to cover normal, low and high <strong>production</strong> plants. A proposedsolution is:For plants with low rates <strong>of</strong> <strong>production</strong> <strong>of</strong> designed <strong>concrete</strong>Where <strong>the</strong> number <strong>of</strong> test results per three months for designed <strong>concrete</strong> is notgreater than 35, <strong>the</strong> assessment period shall comprise at least 15 and not morethan 35 consecutive results taken over a period not exceed<strong>in</strong>g 12 months.For plants with high rates <strong>of</strong> <strong>production</strong> <strong>of</strong> designed <strong>concrete</strong>Where <strong>the</strong> number <strong>of</strong> test results per three months for designed <strong>concrete</strong>exceeds 35, <strong>the</strong> assessment period shall not exceed three months.Such a solution does not resolve all <strong>the</strong> issues related to conformity <strong>of</strong>strength, for example <strong>the</strong> criteria are based on <strong>the</strong> assumption that <strong>the</strong><strong>concrete</strong> mix proportions are <strong>control</strong>led by strength and this is not always <strong>the</strong>case (see 8.2).It is also proposed that <strong>the</strong> use <strong>of</strong> <strong>control</strong> <strong>charts</strong> be accepted as an alternativeto <strong>the</strong> mean strength rule. This is conditional on <strong>the</strong> <strong>concrete</strong> be<strong>in</strong>g subject tothird party certification or an agreement between <strong>the</strong> parties. As a <strong>control</strong>chart comprises successive sampl<strong>in</strong>g plans (with a known standard deviation),<strong>the</strong> operat<strong>in</strong>g-characteristic curve <strong>of</strong> <strong>the</strong> <strong>in</strong>dividual sampl<strong>in</strong>g plan may beestablished. The average outgo<strong>in</strong>g quality (AOQ) curve is <strong>the</strong>n determ<strong>in</strong>ed bymultiply<strong>in</strong>g each percentage <strong>of</strong> all possible results below <strong>the</strong> requiredcharacteristic strength <strong>in</strong> <strong>the</strong> <strong>production</strong> by <strong>the</strong> correspond<strong>in</strong>g acceptanceprobability.Page 37 <strong>of</strong> 53
<strong>Use</strong> <strong>of</strong> <strong>control</strong> <strong>charts</strong> <strong>in</strong> <strong>the</strong> <strong>production</strong> <strong>of</strong> <strong>concrete</strong>Section 4.4 shows how this approach can be applied to <strong>control</strong> systems basedon <strong>the</strong> Shewhart chart and 9.4 shows how it may be applied with <strong>the</strong> CUSUMsystem.9.4 Achiev<strong>in</strong>g an AOQL <strong>of</strong> 5% with CUSUMCaspeele and Taerwe [5] have developed a system where for a selected marg<strong>in</strong>an upper limb V-mask for CUSUM M is used to determ<strong>in</strong>e when an AOQL <strong>of</strong> 5% isnot be<strong>in</strong>g achieved. Parameters for <strong>the</strong> V-mask are given for n =15 and 35 andfor <strong>in</strong>dependent and auto-correlated results. Production data show that<strong>concrete</strong> test results have some auto- correlation and <strong>the</strong>refore <strong>the</strong>se are <strong>the</strong>appropriate values. For <strong>the</strong> reasons given <strong>in</strong> 9.2, <strong>the</strong> producer should select anassessment period based on 35 results. The paper [5] is focussed on achiev<strong>in</strong>gan AOQL <strong>of</strong> 5% and it <strong>in</strong>cludes marg<strong>in</strong>s less than 1.64σ. The use <strong>of</strong> a marg<strong>in</strong> lessthan 1.64σ means that <strong>the</strong> producer is deliberately target<strong>in</strong>g <strong>the</strong> <strong>production</strong>not to achieve <strong>the</strong> specified characteristic strength. This is unacceptable and<strong>the</strong> marg<strong>in</strong> should never be less than 1.64σ. Table 7 gives <strong>the</strong> V-maskparameters for selected marg<strong>in</strong>s based on n =35 and auto-correlated results.Table 7: Selected conformity V-mask parametersMarg<strong>in</strong> Decision <strong>in</strong>terval Slope1.64σ 3σ σ/21.66σ 8σ σ/41.70σ 9σ σ/41.71σ 4σ σ/21.74σ 10σ σ/41.76σ 5σ σ/21.82σ 6σ σ/21.86σ 7σ σ/21.91σ 8σ σ/21.95σ 9σ σ/21.99σ 10σ σ/22.06σ 2σ σ/12.26σ 5σ σ/12.49σ 10σ σ/1The conformity V-mask only applies to <strong>the</strong> upper limb, i.e. to <strong>the</strong> actualstrength be<strong>in</strong>g less than <strong>the</strong> target strength, and its length is <strong>the</strong> selected value<strong>of</strong> n; 35 <strong>in</strong> <strong>the</strong> case <strong>of</strong> Table 7. In effect, <strong>the</strong> V-mask tests whe<strong>the</strong>r <strong>the</strong> last nresults have achieved an AOQL <strong>of</strong> 5%. Figure 14 for CUSUM M shows <strong>the</strong>conformity V-mask with <strong>the</strong> V-mask that shows when a significant change hashappened (see 5.4).Page 38 <strong>of</strong> 53
<strong>Use</strong> <strong>of</strong> <strong>control</strong> <strong>charts</strong> <strong>in</strong> <strong>the</strong> <strong>production</strong> <strong>of</strong> <strong>concrete</strong>Figure 14: Conformity and action V-masks for a target strength <strong>of</strong> (f ck + 1,96σ)When <strong>the</strong> CUSUM crosses <strong>the</strong> significant change l<strong>in</strong>e, <strong>the</strong> producer takesimmediate appropriate action. However <strong>the</strong>re will be a number <strong>of</strong> testspecimens that have been cast but not tested. If a conformity V-mask is be<strong>in</strong>gused, <strong>the</strong> CUSUM M should be re-set once <strong>the</strong>se results have been tested. Thismeans that <strong>the</strong> adverse trend may move towards <strong>the</strong> conformity l<strong>in</strong>e. At a testrate <strong>of</strong> 16 per month and <strong>the</strong> use <strong>of</strong> 7-day strength data, <strong>the</strong>re would be about4 results between cross<strong>in</strong>g <strong>the</strong> significant change l<strong>in</strong>e and re-sett<strong>in</strong>g CUSUM Mand <strong>the</strong>refore <strong>the</strong> probability <strong>of</strong> cross<strong>in</strong>g <strong>the</strong> conformity l<strong>in</strong>e is very low.A decade <strong>of</strong> experience us<strong>in</strong>g CUSUM with <strong>the</strong> target strength and significantchange limits given <strong>in</strong> Figure 14 and check<strong>in</strong>g conformity <strong>of</strong> mean strength toEN 206-1:2000 us<strong>in</strong>g a runn<strong>in</strong>g mean <strong>of</strong> 35 results [19] has never resulted <strong>in</strong>non-conformity <strong>of</strong> mean strength. Under <strong>the</strong>se conditions <strong>the</strong> conformity V-mask is highly unlikely to be crossed and if it was crossed, it would <strong>in</strong>dicatethat <strong>the</strong> producer must take action to achieve <strong>the</strong> target strength, but <strong>the</strong>producer would have taken this action already, i.e. when <strong>the</strong> significant changel<strong>in</strong>e was crossed.9.5 Non-conformityIf <strong>the</strong> <strong>control</strong> system shows that an AOQL <strong>of</strong> 5% is not be<strong>in</strong>g achieved, <strong>the</strong>producer is required to take immediate action to achieve <strong>the</strong> target strength.In addition <strong>the</strong> producer should identify any <strong>concrete</strong>s that are not fit forpurpose and <strong>in</strong>form <strong>the</strong> user and specifier. The certification body will checkthat <strong>the</strong> <strong>in</strong>vestigation was undertaken <strong>in</strong> <strong>the</strong> appropriate way and <strong>the</strong> users andspecifiers correctly <strong>in</strong>formed.Page 39 <strong>of</strong> 53
<strong>Use</strong> <strong>of</strong> <strong>control</strong> <strong>charts</strong> <strong>in</strong> <strong>the</strong> <strong>production</strong> <strong>of</strong> <strong>concrete</strong>10 Implement<strong>in</strong>g Control SystemsOnce cont<strong>in</strong>uous <strong>production</strong> is established <strong>the</strong> producer should have <strong>the</strong> choice<strong>of</strong> <strong>control</strong>l<strong>in</strong>g <strong>the</strong> mean strength us<strong>in</strong>g <strong>control</strong> <strong>charts</strong>. The use <strong>of</strong> <strong>control</strong> <strong>charts</strong>should be limited to producers with third party certification (e.g. <strong>the</strong> majority<strong>of</strong> <strong>the</strong> ready-mixed <strong>concrete</strong> and precast <strong>concrete</strong> <strong>in</strong>dustries <strong>in</strong> WesternEurope) or to where <strong>the</strong>re is agreement between <strong>the</strong> producer and user.The follow<strong>in</strong>g are recommended m<strong>in</strong>imum requirements on <strong>the</strong> <strong>control</strong> system:- achieve a maximum average outgo<strong>in</strong>g quality (AOQ) not exceed<strong>in</strong>g 5,0%;(Comment: This ensures that no more than 5% <strong>of</strong> <strong>the</strong> <strong>production</strong> isbelow <strong>the</strong> specified characteristic strength).- aim to ensure conformity <strong>of</strong> <strong>the</strong> <strong>production</strong> with <strong>the</strong> requiredcharacteristic strength;- <strong>in</strong>clude regular monitor<strong>in</strong>g <strong>of</strong> strength and standard deviation anddeviations from target values;- where applicable, <strong>in</strong>clude one or more procedures for speed<strong>in</strong>g <strong>the</strong>response <strong>of</strong> <strong>the</strong> system (e.g. use <strong>of</strong> early strength data, use <strong>of</strong> <strong>concrete</strong>families);- def<strong>in</strong>e and apply clear decision rules for conformity and warn<strong>in</strong>g limits;- document how <strong>the</strong> system achieves a maximum average outgo<strong>in</strong>g quality(AOQ) not exceed<strong>in</strong>g 5.0% (unless one <strong>of</strong> <strong>the</strong> rules <strong>of</strong> application given <strong>in</strong>an <strong>in</strong>formative annex to EN 206-1 is used);- when <strong>the</strong> <strong>control</strong> chart shows that <strong>the</strong> standard deviation is ≥ 0.5 N/mm 2above <strong>the</strong> currently applied value, change <strong>the</strong> applied value.Page 40 <strong>of</strong> 53
<strong>Use</strong> <strong>of</strong> <strong>control</strong> <strong>charts</strong> <strong>in</strong> <strong>the</strong> <strong>production</strong> <strong>of</strong> <strong>concrete</strong>11 CUSUM Example11.1 Reference mix and <strong>concrete</strong> familyThe follow<strong>in</strong>g example is used to simply illustrate <strong>the</strong> CUSUM process applied toa <strong>concrete</strong> plant <strong>control</strong>l<strong>in</strong>g its <strong>production</strong> based on a family <strong>of</strong> mixes, as is <strong>the</strong>common practice <strong>in</strong> <strong>the</strong> UK.The <strong>control</strong> system is based on a reference <strong>concrete</strong> described <strong>in</strong> Table 8. This<strong>concrete</strong> is representative <strong>of</strong> <strong>the</strong> ma<strong>in</strong> <strong>concrete</strong> produced at <strong>the</strong> plant. The<strong>control</strong> cement content is <strong>the</strong> current level that <strong>the</strong> CUSUM identifies asnecessary to produce <strong>the</strong> target strength <strong>of</strong> <strong>the</strong> reference <strong>concrete</strong>. Note that<strong>concrete</strong> with <strong>the</strong> same compressive strength class as <strong>the</strong> reference <strong>concrete</strong>might be actually produced with higher cement contents than <strong>the</strong> reference<strong>concrete</strong>. For example, specification requirements for durability may show that<strong>the</strong> m<strong>in</strong>imum cement content or <strong>the</strong> cement content to satisfy <strong>the</strong> specifiedmaximum w/c ratio is higher than <strong>the</strong> CUSUM <strong>control</strong> cement content <strong>of</strong> <strong>the</strong>reference <strong>concrete</strong>. How <strong>the</strong>se mixes are handled is described <strong>in</strong> 8.3.Table 8: Reference Mix DetailsCompressive strength C32/40Aggregate size and typeCement TypeSlump20mm gravelCEM III/A70mm (S2)AdmixtureNoneControl cement content 320 kg/m 3The <strong>control</strong> cement content is that expected to give <strong>the</strong> target strength <strong>of</strong> <strong>the</strong>reference <strong>concrete</strong>. Not all <strong>concrete</strong>s will be <strong>in</strong>cluded <strong>in</strong> <strong>the</strong> family <strong>of</strong> mixesused to <strong>control</strong> <strong>the</strong> ma<strong>in</strong> <strong>production</strong>. The parameters <strong>of</strong> <strong>the</strong> family are shown<strong>in</strong> Table 9.Compressive strengthAggregate size and typeCement TypeSlumpAdmixtureTable 9: Family parametersC16/20 to C45/55 <strong>in</strong>clusiveGravel only 20mm or 10mmCEM III/A only25mm to 150mm <strong>in</strong>clusiveWith or without water reduc<strong>in</strong>g admixture11.2 Ma<strong>in</strong> relationshipA key relationship needed <strong>in</strong> <strong>the</strong> CUSUM analysis is <strong>the</strong> ma<strong>in</strong> relationshipbetween cement content and strength (Figure 15), which not only allows mixesto be transposed to an equivalent to <strong>the</strong> reference <strong>concrete</strong>, but is also used todeterm<strong>in</strong>e <strong>the</strong> size <strong>of</strong> correction to be applied when <strong>the</strong> CUSUM <strong>in</strong>dicateschange has occurred (see 5.6).Page 41 <strong>of</strong> 53
<strong>Use</strong> <strong>of</strong> <strong>control</strong> <strong>charts</strong> <strong>in</strong> <strong>the</strong> <strong>production</strong> <strong>of</strong> <strong>concrete</strong>807060Strength (N/mm2)504030201000 100 200 300 400 500 600Cement ContentFigure 15: Ma<strong>in</strong> relationship between cement content and strengthIn addition to <strong>the</strong> ma<strong>in</strong> relationship, relationships are also needed to beestablished for <strong>the</strong> effect on cement content <strong>of</strong> chang<strong>in</strong>g <strong>the</strong> aggregate size,slump and <strong>the</strong> effect <strong>of</strong> <strong>the</strong> water-reduc<strong>in</strong>g admixture (WRA). These effectsare expressed as adjustments and are made to <strong>the</strong> cement content. Themagnitude <strong>of</strong> <strong>the</strong>se adjustments will normally be established by laboratorywork. The values for <strong>the</strong> family <strong>of</strong> mixes <strong>in</strong> this example are shown <strong>in</strong> Table10. The adjustments are those needed to convert <strong>the</strong> cement content <strong>of</strong> <strong>the</strong>tested <strong>concrete</strong> <strong>in</strong>to an equivalent cement content on <strong>the</strong> ma<strong>in</strong>strength/cement content relationship (Figure 15). For example a 10mmmaximum aggregate size <strong>concrete</strong> would have a higher cement content than a20mm maximum aggregate size <strong>concrete</strong> (<strong>the</strong> aggregate size used <strong>in</strong> <strong>the</strong> ma<strong>in</strong>relationship) and so a 10mm <strong>concrete</strong> has to be adjusted by reduc<strong>in</strong>g <strong>the</strong>cement content used to produce that <strong>concrete</strong> to what it would have been if a20mm <strong>concrete</strong> had been produced. If a WRA is used, <strong>the</strong> cement content isadjusted upwards. In this example <strong>the</strong> WRA is added as a constant percentageby mass <strong>of</strong> cement.Once <strong>the</strong>se changes have been made to adjust <strong>the</strong> actual cement content <strong>of</strong><strong>the</strong> tested <strong>concrete</strong> to <strong>the</strong> equivalent value on <strong>the</strong> ma<strong>in</strong> relationship, a secondadjustment is needed to fur<strong>the</strong>r correct that new cement content to that <strong>of</strong><strong>the</strong> reference <strong>concrete</strong>. This strength adjustment is <strong>the</strong> difference <strong>in</strong> strengthon <strong>the</strong> ma<strong>in</strong> relationship between that at <strong>the</strong> equivalent cement content <strong>of</strong> <strong>the</strong>tested <strong>concrete</strong> and <strong>the</strong> target mean strength <strong>of</strong> <strong>the</strong> reference <strong>concrete</strong>.Page 42 <strong>of</strong> 53
<strong>Use</strong> <strong>of</strong> <strong>control</strong> <strong>charts</strong> <strong>in</strong> <strong>the</strong> <strong>production</strong> <strong>of</strong> <strong>concrete</strong>Table 10: Adjustments per cubic metre to convert <strong>the</strong> cement content <strong>of</strong><strong>the</strong> tested <strong>concrete</strong> to a <strong>concrete</strong> on <strong>the</strong> ma<strong>in</strong> relationship A)Adjustments where <strong>the</strong> tested <strong>concrete</strong> conta<strong>in</strong>ed a WRACement content <strong>of</strong>200 to 380 380+tested <strong>concrete</strong>, kg/m 3Adjustment to cementcontent, kg/m 3+25 kgAt <strong>the</strong>se higher cement contents it ismore effective to use asuperplasticiz<strong>in</strong>g admixture B) .Adjustments where <strong>the</strong> tested <strong>concrete</strong> conta<strong>in</strong>ed 10mm maximum aggregate size C) .Cement content <strong>of</strong>200 to 380 380+tested <strong>concrete</strong>, kg/m 3Adjustment to cementcontent, kg/m 3 —15—10Adjustments where <strong>the</strong> tested <strong>concrete</strong> has a target slump that is not 70mmTargetslump, mmSlumpadjustment20 (S1) 50 70 (S2) 100 120 (S3) 150+15 kg +10 kg 0 —5 kg —10 kg —15 kgA)Numerically equal but opposite <strong>in</strong> sign (+ becomes -) adjustments are used <strong>in</strong> mixproportion<strong>in</strong>g.B) As <strong>the</strong> follow<strong>in</strong>g example does not need this adjustment for superplasticizer, a value is notgiven.C) As <strong>the</strong> follow<strong>in</strong>g example does not <strong>in</strong>clude aggregates larger than 20mm, no adjustments aregiven.11.3 Apply<strong>in</strong>g adjustmentsConsider <strong>the</strong> follow<strong>in</strong>g <strong>concrete</strong>s tested for <strong>in</strong>clusion <strong>in</strong> <strong>the</strong> CUSUM systemMix Ref 1C25/30 20mm aggregate CEM III/A 100 mm slump no WRAThe mix was produced with a cement content <strong>of</strong> 275 kg/m 3 . This mix meets <strong>the</strong>family criteria <strong>in</strong> Table 9.To relate <strong>the</strong> mix to <strong>the</strong> reference <strong>concrete</strong> described <strong>in</strong> Table 8, <strong>the</strong> mix mustfirst be adjusted for <strong>the</strong> fact it was specified as 100mm slump ra<strong>the</strong>r than70mm slump. Table 10 <strong>in</strong>dicates that for 100mm slump an adjustment <strong>of</strong> —5kg/m 3 is required. The adjustment is negative as additional cement wouldhave been added to <strong>the</strong> mix to ma<strong>in</strong>ta<strong>in</strong> <strong>the</strong> w/c ratio after <strong>the</strong> consistencehad been <strong>in</strong>creased from 70mm to 100mm slump.The adjusted cement content becomes: 275 — 5 = 270 kg/m 3From <strong>the</strong> ma<strong>in</strong> relationship <strong>in</strong> Figure 15, we would expect a 270kg/m 3 cementcontent to achieve a strength <strong>of</strong> 37.3 h N/mm 2 but <strong>the</strong> reference <strong>concrete</strong> ish This is a value calculated from <strong>the</strong> equation <strong>of</strong> <strong>the</strong> l<strong>in</strong>e <strong>in</strong> Figure 15.Page 43 <strong>of</strong> 53
<strong>Use</strong> <strong>of</strong> <strong>control</strong> <strong>charts</strong> <strong>in</strong> <strong>the</strong> <strong>production</strong> <strong>of</strong> <strong>concrete</strong>C32/40. As <strong>the</strong> plant has a standard deviation <strong>of</strong> 3.5N/mm 2 and a designmarg<strong>in</strong> <strong>of</strong> 2.0σ, <strong>the</strong> target mean strength <strong>of</strong> <strong>the</strong> reference <strong>concrete</strong> is47 N/mm 2 . A difference <strong>of</strong> 9.7 N/mm 2 (47 — 37.3 N/mm 2 ) <strong>in</strong> <strong>the</strong> CUSUM systemhas to be <strong>in</strong>troduced to transpose <strong>the</strong> strength at <strong>the</strong> equivalent cementcontent to <strong>the</strong> target mean strength <strong>of</strong> <strong>the</strong> reference mix. For example <strong>in</strong>Table 11 mix reference 1, <strong>the</strong> predicted and actual 28-day strengths are 42.5N/mm 2 and 39.5 N/mm 2 respectively. After adjustment to equivalent cementcontent values <strong>of</strong> <strong>the</strong> reference <strong>concrete</strong>, <strong>the</strong>se become 52.2 N/mm 2 (42.5 +9.7) and 49.2 N/mm 2 and <strong>the</strong> change <strong>in</strong> CUSUM M is 52.2 — 47 = 5.2 N/mm 2 if<strong>the</strong> predicted strength is be<strong>in</strong>g used and 49.2 — 47 = 2.2 N/mm 2 when <strong>the</strong>predicted 28-day strength is replaced with <strong>the</strong> actual 28-day strength.In this example <strong>the</strong> lowest compressive strength class <strong>in</strong> <strong>the</strong> <strong>concrete</strong> family isC16/20. However, if a family were to <strong>in</strong>clude <strong>concrete</strong> with strength classeslower than C16/20, i.e. a target mean strength <strong>of</strong> less than 27 N/mm 2 , anyresults are re-calculated us<strong>in</strong>g <strong>the</strong> standard deviation obta<strong>in</strong>ed from Figure 3.Mix Ref 2C32/40 20mm aggregate CEM III/A 150mm slump with a WRAThe mix was produced with a cement content <strong>of</strong> 310kg/m 3 . This mix meets <strong>the</strong>family criteria <strong>in</strong> Table 9.To relate <strong>the</strong> mix to <strong>the</strong> reference <strong>concrete</strong> described <strong>in</strong> Table 8, <strong>the</strong> mix mustfirst be adjusted for <strong>the</strong> fact that it conta<strong>in</strong>ed a WRA; and <strong>the</strong>n adjustedbecause it was specified as 150mm slump ra<strong>the</strong>r than 70mm slump. For <strong>the</strong>WRA <strong>the</strong> cement content for CUSUM purposes will need to be <strong>in</strong>creased tocorrect for <strong>the</strong> water reduction effected by <strong>the</strong> addition <strong>of</strong> <strong>the</strong> WRA. For <strong>the</strong>higher-than-reference slump <strong>the</strong> adjustment <strong>in</strong> cement content is negative.Total adjustment to apply is +25 —15 = 10kg (from Table 10)The adjusted cement content becomes:310 + 10 = 320 kg/m 3Note when undertak<strong>in</strong>g mix proportion<strong>in</strong>g, <strong>the</strong> adjustments from <strong>the</strong> ma<strong>in</strong>relationship always have <strong>the</strong> opposite sign, but <strong>the</strong> same numerical value.The second adjustment is to correct <strong>the</strong> recorded strength at this <strong>in</strong>creasedcement content to <strong>the</strong> strength expected at <strong>the</strong> cement content <strong>of</strong> <strong>the</strong>reference mix. From <strong>the</strong> ma<strong>in</strong> relationship <strong>in</strong> Figure 15, a 320 kg/m 3 cementcontent is expected to achieve a strength <strong>of</strong> 46.8 h N/mm 2 but <strong>the</strong> reference<strong>concrete</strong> is C32/40. As <strong>the</strong> plant has a current standard deviation <strong>of</strong> 3.5N/mm 2and a design marg<strong>in</strong> <strong>of</strong> 2.0σ, <strong>the</strong> target mean strength <strong>of</strong> <strong>the</strong> reference<strong>concrete</strong> is 47 N/mm 2 , a difference <strong>of</strong> 0.2 N/mm 2 , which is <strong>the</strong> adjustment thatwill be made to <strong>the</strong> predicted and actual cube strengths <strong>in</strong> <strong>the</strong> CUSUM system.Mix Ref 3C32/40 20mm aggregate CEM III/A 70mm slump no WRAThe mix was produced with a cement content <strong>of</strong> 320 kg/m 3 . This mix is <strong>the</strong>reference <strong>concrete</strong> and as it was batched at <strong>the</strong> <strong>control</strong> cement content, noadjustments need to be applied.These <strong>concrete</strong>s are <strong>the</strong> first three <strong>in</strong>cluded <strong>in</strong> <strong>the</strong> CUSUM analysis tabulated <strong>in</strong>Table 11.Page 44 <strong>of</strong> 53
<strong>Use</strong> <strong>of</strong> <strong>control</strong> <strong>charts</strong> <strong>in</strong> <strong>the</strong> <strong>production</strong> <strong>of</strong> <strong>concrete</strong>11.4 CUSUM calculationOnce <strong>the</strong> adjustments have been made and <strong>the</strong> adjusted 28 day strengthcalculated, <strong>the</strong> data may be used <strong>in</strong> any <strong>control</strong> system (e.g. CUSUM orShewhart). The follow<strong>in</strong>g example analyses <strong>the</strong> data by CUSUM techniques. ACUSUM is run on mean (CUSUM M), standard deviation (CUSUM R) andcorrelation (CUSUM C). For <strong>control</strong> purposes <strong>the</strong> mixes <strong>in</strong>clude a prescribed<strong>concrete</strong> (P300, sample reference 13) and a nom<strong>in</strong>al mix (1:2:4, samplereference 14).The results are plotted on <strong>the</strong> CUSUM and <strong>the</strong> V-mask overlaid on each result.This is a manual system used to illustrate <strong>the</strong> pr<strong>in</strong>ciples <strong>of</strong> <strong>the</strong> CUSUMtechnique. Clearly, this process would normally be carried out on computer,ei<strong>the</strong>r through a spreadsheet, a commercially available CUSUM programme orby <strong>the</strong> development <strong>of</strong> a company specific computer programme.The current plant standard deviation is 3.5 N/mm 2 which gives a target range<strong>of</strong> (1.128 x 3.5) = 3.9 N/mm 2 (see 2.3). The marg<strong>in</strong> is 2.0σ. The target cubestrength <strong>of</strong> <strong>the</strong> reference <strong>concrete</strong> is (40 + (2.0 x 3.5)) = 47 N/mm 2 .From <strong>the</strong> three plots <strong>in</strong> Figure 16, Figure 17 and Figure 18 it may be seen that<strong>the</strong> correlation and standard deviation are runn<strong>in</strong>g <strong>in</strong> <strong>control</strong>, but <strong>the</strong>re hasbeen a change <strong>in</strong> <strong>the</strong> mean from po<strong>in</strong>t 7 to po<strong>in</strong>t 17. This is evidence that <strong>the</strong>current <strong>control</strong> cement content <strong>of</strong> 320 kg/m 3 is not giv<strong>in</strong>g <strong>the</strong> required averagestrength <strong>of</strong> 47 N/mm 2 . As it is <strong>the</strong> upper arm <strong>of</strong> <strong>the</strong> V-mask that has beencrossed, this <strong>in</strong>dicates that <strong>the</strong> average mean strength is lower than <strong>the</strong> targetstrength. The mix proportions are immediately adjusted (see 11.5) and CUSUMM is reset at zero. Note that this change has been made on <strong>the</strong> basis <strong>of</strong> a set <strong>of</strong>actual 28 day strengths (data po<strong>in</strong>ts 1 to16) and predicted 28 day strengths(data po<strong>in</strong>t 17).Page 45 <strong>of</strong> 53
<strong>Use</strong> <strong>of</strong> <strong>control</strong> <strong>charts</strong> <strong>in</strong> <strong>the</strong> <strong>production</strong> <strong>of</strong> <strong>concrete</strong>Table 11: CUSUM calculationMix description (all CEM III/A) Results Adjustments CUSUM M CUSUM R CUSUM CMix referenceStrength classAggregate sizeTarget slumpPlasticiserBatched cementcontentActual 7 dayPredicted 28 dayActual 28 dayTotal cementadjustmentAdjusted cementcontentCement/StrengthCodeExpected strengthReference strengthTarget strengthStrengthadjustmentFrom predictedFrom actualAdjusted strengthDifference fromtargetCUSUM MRangeTarget RangeDifference fromtargetCUSUM RActual — predicted28 dayCUSUM CCURRENT STANDARD DEVIATION = 3,5 N/mm 2 ; TARGET RANGE = 1,128 x 3,5 = 3,9 N/mm 21 C25/30 20 100 No 275 31.1 42.5 39.5 -5 270 A 37.3 40 47 9.7 49.2 49.2 2.2 2.2 -3.0 -3.02 C32/40 20 150 Yes 310 33.8 45.3 46.3 10 320 A 46.8 40 47 0.2 46.5 46.5 -0.5 1.7 2.7 3.9 -1.2 -1.2 1.0 -2.03 C32/40 20 70 No 320 35.2 46.8 46.8 0 320 A 46.8 40 47 0.2 47.0 47.0 0.0 1.7 0.5 3.9 -3.4 -4.6 0.0 -2.04 C32/40 20 70 No 320 37.2 48.8 49.3 0 320 A 46.8 40 47 0.2 49.5 49.5 2.5 4.2 2.5 3.9 -1.4 -6.0 0.5 -1.55 C25/30 20 70 Yes 245 26.7 37.5 39.5 25 270 A 37.3 40 47 9.7 49.2 49.2 2.2 6.4 0.3 3.9 -3.6 -9.6 2.0 0.56 C32/40 20 150 Yes 310 41.5 52.8 53.8 10 320 A 46.8 40 47 0.2 54.0 54.0 7.0 13.4 4.8 3.9 0.9 -8.7 1.0 1.57 C32/40 20 70 No 320 42.6 53.8 53.3 0 320 A 46.8 40 47 0.2 53.5 53.5 6.5 19.9 0.5 3.9 -3.4 - -0.5 1.012.18 C28/35 20 50 No 285 28.2 39.2 39.2 10 295 A 42.1 40 47 4.9 44.1 44.1 -2.9 17.0 9.4 3.9 5.5 -6.6 0.0 1.09 C28/35 20 50 No 285 30.9 42.2 40.7 10 295 A 42.1 40 47 4.9 45.6 45.6 -1.4 15.6 1.5 3.9 -2.4 -9.0 -1.5 -0.510 C40/50 20 120 Yes 360 40.4 51.8 48.8 15 375 A 57.3 40 47 - 38.5 38.5 -8.5 7.1 7.1 3.9 3.2 -5.8 -3.0 -3.510.311 C25/30 20 100 No 275 27.6 38.6 40.5 -5 270 A 37.3 40 47 9.7 50.2 50.2 3.2 10.3 11.7 3.9 7.8 2.0 1.9 -1.612 C25/30 20 70 Yes 245 24.1 34.5 35.0 25 270 A 37.3 40 47 9.7 44.7 44.7 -2.3 8.0 5.5 3.9 1.6 3.6 0.5 -1.113 P300 20 150 Yes 300 26.2 36.9 37.4 10 310 A 44.9 40 47 2.1 39.5 39.5 -7.5 0.5 5.2 3.9 1.3 4.9 0.5 -0.614 1:2:4 20 70 No 270 27.6 38.6 37.6 0 270 A 37.3 40 47 9.7 47.3 47.3 0.3 0.8 7.8 3.9 3.9 8.8 -1.0 -1.615 C40/50 20 120 Yes 360 38.3 49.8 47.3 15 375 A 57.3 40 47 - 37.0 37.0 - -9.2 10.3 3.9 6.4 15.2 -2.5 -4.110.310.016 C40/50 20 120 Yes 360 41.5 52.8 53.8 15 375 A 57.3 40 47 - 43.5 43.5 -3.5 - 6.5 3.9 2.6 17.8 1.0 -3.110.312.717 C25/30 20 100 No 275 21.7 31.5 -5 270 A 37.3 40 47 9.7 41.2 41.2 -5.8 -18.52.3 3.9 -1.6 16.2TARGET STRENGTH NOT BEING ACHIEVED; CEMENT CONTENT INCREASED; CUSUM M RESET TO ZEROPage 46 <strong>of</strong> 53
<strong>Use</strong> <strong>of</strong> <strong>control</strong> <strong>charts</strong> <strong>in</strong> <strong>the</strong> <strong>production</strong> <strong>of</strong> <strong>concrete</strong>Figure 16: CUSUM MFigure 17: CUSUM RFigure 18: CUSUM CPage 47 <strong>of</strong> 53
<strong>Use</strong> <strong>of</strong> <strong>control</strong> <strong>charts</strong> <strong>in</strong> <strong>the</strong> <strong>production</strong> <strong>of</strong> <strong>concrete</strong>11.5 CUSUM action follow<strong>in</strong>g changeThe CUSUM M has shown that <strong>the</strong>re has been a decl<strong>in</strong>e <strong>in</strong> <strong>the</strong> performance;<strong>the</strong>refore to br<strong>in</strong>g <strong>the</strong> process back <strong>in</strong>to <strong>control</strong> it is necessary to <strong>in</strong>crease<strong>the</strong> <strong>control</strong> cement content. The magnitude <strong>of</strong> <strong>the</strong> <strong>in</strong>crease <strong>in</strong> cementcontent is a function <strong>of</strong> <strong>the</strong> standard deviation <strong>of</strong> <strong>the</strong> plant, and <strong>the</strong> number<strong>of</strong> results over which <strong>the</strong> change has taken place (see 5.6).In this case, <strong>the</strong> plant standard deviation is 3,5 N/mm 2 and <strong>the</strong> changeoccurred at Mix reference 7, but <strong>the</strong> CUSUM M first crosses <strong>the</strong> V-mask atMix reference 9 giv<strong>in</strong>g a change over 9 results. From Figure 19 it can beseen that a change over 9 results gives a change <strong>in</strong> cement content <strong>of</strong>14 kg/m 3 . For simplicity, this would be rounded to 15 kg/m 3 and <strong>the</strong>refore<strong>the</strong> <strong>control</strong> cement content <strong>of</strong> <strong>the</strong> reference <strong>concrete</strong> would be <strong>in</strong>creasedfrom 320 kg/m 3 to 335 kg/m 3 .A new ma<strong>in</strong> relation would also be adopted that relates to a <strong>control</strong> cementcontent <strong>of</strong> 335 kg/m 3 for a characteristic strength <strong>of</strong> 40 N/mm 2 (targetstrength 47 N/mm 2 ). Table 12 shows <strong>the</strong> relationships <strong>in</strong> tabular form andfrom Table 13, this can be seen as a change <strong>in</strong> cement/strength code from Ato B. The cement contents actually used at <strong>the</strong> plant would immediately be<strong>in</strong>creased to <strong>the</strong> amount shown by <strong>the</strong> new ma<strong>in</strong> relationship. This changedma<strong>in</strong> relationship will also lead to revised adjustments be<strong>in</strong>g applied toobta<strong>in</strong> <strong>the</strong> predicted cube strength <strong>of</strong> <strong>the</strong> reference <strong>concrete</strong>. Theseadjustments are applied from result 18 onwards (Table 13). They will alsobe applied to <strong>the</strong> batch<strong>in</strong>g <strong>of</strong> new mixes, but <strong>the</strong>re will be a period where<strong>the</strong> <strong>concrete</strong> has already been batched at a cement content that is less thanthat now known to be necessary. However for <strong>the</strong> <strong>control</strong> <strong>of</strong> <strong>the</strong> meanstrength, mix 18 onwards is adjusted to <strong>the</strong> new target cement content <strong>of</strong><strong>the</strong> reference <strong>concrete</strong> (335 kg/m 3 ).Page 48 <strong>of</strong> 53
<strong>Use</strong> <strong>of</strong> <strong>control</strong> <strong>charts</strong> <strong>in</strong> <strong>the</strong> <strong>production</strong> <strong>of</strong> <strong>concrete</strong>25Change <strong>in</strong> cement content kg/m320151050SD = 3.5 Nmm 20 5 10 15 20 25 30 35 40 45 50 55 60No <strong>of</strong> resultsFigure 19: Strength change aga<strong>in</strong>st number <strong>of</strong> resultsTable 12: Relationships between strength and cement contentCubestrengthCement content, kg/m 3 , forcement/strength codesCubestrengthCement content, kg/m 3 , forcement/strength codesN/mm 2 A BN/mm 2 A B20 180.0 195.0 41 290.0 305.021 185.0 200.0 42 295.0 310.022 190.0 205.0 43 300.0 315.023 195.0 210.0 44 305.0 320.024 200.0 215.0 45 310.0 325.025 205.0 220.0 46 315.0 330.026 210.0 225.0 47 320.0 335.027 215.0 230.0 48 325.0 340.028 220.0 235.0 49 330.0 345.029 225.0 240.0 50 335.0 355.030 230.0 245.0 51 340.0 360.031 235.0 255.0 52 345.0 365.032 240.0 260.0 53 355.0 370.033 245.0 265.0 54 360.0 375.034 255.0 270.0 55 365.0 380.035 260.0 275.0 56 370.0 385.036 265.0 280.0 57 375.0 390.037 270.0 285.0 58 380.0 395.038 275.0 290.0 59 385.0 400.039 280.0 295.0 60 390.0 405.040 285.0 300.011.6 Fur<strong>the</strong>r data and a change <strong>in</strong> standard deviationTable 13 is <strong>the</strong> cont<strong>in</strong>uation <strong>of</strong> <strong>the</strong> CUSUM calculation with additional data.Dur<strong>in</strong>g this period no more actual 28-day strength are available. The CUSUMswith <strong>the</strong> additional data are shown <strong>in</strong> Figures 20 to 22.Page 49 <strong>of</strong> 53
<strong>Use</strong> <strong>of</strong> <strong>control</strong> <strong>charts</strong> <strong>in</strong> <strong>the</strong> <strong>production</strong> <strong>of</strong> <strong>concrete</strong>Follow<strong>in</strong>g <strong>the</strong> change <strong>in</strong> cement content to achieve <strong>the</strong> target strength,sample number 18, C32/40 70mm slump, which is <strong>the</strong> <strong>control</strong> mix and<strong>the</strong>refore batched at <strong>the</strong> <strong>control</strong> cement content has previously notrequired a correction to <strong>the</strong> strength (See Table 11, samples 3, 4 and 7).However, <strong>the</strong> <strong>control</strong> cement content has now <strong>in</strong>creased to 335 kg/m 3 ; s<strong>in</strong>ce<strong>the</strong> mix was batched at 320 kg/m 3 before <strong>the</strong> CUSUM M detected <strong>the</strong> needfor a change, an adjustment from <strong>the</strong> new ma<strong>in</strong> relation needs to beapplied.The same <strong>concrete</strong> was batched at sample number 22 but <strong>in</strong> this case <strong>the</strong><strong>control</strong> mix cement content changes needed to compensate for <strong>the</strong> changes<strong>in</strong> mean strength and <strong>in</strong> standard deviation have already been implemented.For this reason <strong>the</strong>re is no adjustment to make as <strong>the</strong> batched cementcontent is now 345 kg/m 3 (320 +15 +5)(+15 kg/m 3 necessitated by <strong>the</strong>change <strong>in</strong> strength/cement content relationship and 5 kg/m 3 necessitated by<strong>the</strong> <strong>in</strong>crease <strong>in</strong> standard deviation, see Table 12).The range over <strong>the</strong> adjustment between samples 17 and 18 <strong>in</strong> compressivestrength is large (56.3 — 41.2) = 15.1 N/mm 2 . The results immediatelybefore and after <strong>the</strong> change <strong>of</strong> mean strength are corrected on differentma<strong>in</strong> relationships which will <strong>in</strong>crease variability. Consequently anamendment needs to be made to <strong>the</strong> result immediately prior to <strong>the</strong> changemean strength <strong>in</strong> order to not <strong>in</strong>troduce excessive variation <strong>in</strong>to <strong>the</strong> CUSUMR calculation. The result before <strong>the</strong> change <strong>of</strong> mean strength is adjustedus<strong>in</strong>g <strong>the</strong> new ma<strong>in</strong> relation for <strong>the</strong> range calculation only. From <strong>the</strong> newma<strong>in</strong> relationship <strong>the</strong> expected strength is 44.2 N/mm 2 and this reduces <strong>the</strong>range from 15.1 N/mm 2 to 12.1 N/mm 2 .After Mix reference 18, a change <strong>in</strong> <strong>the</strong> plant standard deviation is alsodetected, see Figure 21. A new standard deviation needs to be calculatedfrom <strong>the</strong> average current range. The average range is 5.3 N/mm 2 and <strong>the</strong>new standard deviation is 4.7 N/mm 2 (5.3/1.128). To avoid over-correct<strong>in</strong>g,a decision is taken to change <strong>the</strong> standard deviation to 4.0 N/mm 2 . Themarg<strong>in</strong> is <strong>in</strong>creased to 1.96 x 4.0 = 7.8 N/mm 2 rounded to 8 N/mm 2 . A1 N/mm 2 <strong>in</strong>crease <strong>in</strong> <strong>the</strong> marg<strong>in</strong> requires a 5 kg/m 3 <strong>in</strong>crease <strong>in</strong> <strong>the</strong> cementcontent, see Table 12. The current <strong>control</strong> mix cement content is <strong>the</strong>reforeimmediately <strong>in</strong>creased from 335 kg/m 3 to 340 kg/m 3 . The cement/strengthrelationship is unchanged (relationship B); what has changed is <strong>the</strong> targetstrength <strong>of</strong> <strong>the</strong> reference <strong>concrete</strong> has moved from 47 to 48 N/mm 2 .Page 50 <strong>of</strong> 53
<strong>Use</strong> <strong>of</strong> <strong>control</strong> <strong>charts</strong> <strong>in</strong> <strong>the</strong> <strong>production</strong> <strong>of</strong> <strong>concrete</strong>Table13: CUSUM table cont<strong>in</strong>uedMix description (all CEM III/A) Results Adjustments CUSUM M CUSUM R CUSUM CMix referenceStrength classAggregate sizeTarget slumpPlasticiserBatched cementcontentActual 7 dayPredicted 28 dayActual 28 dayTotal cementadjustment16 C40/50 20 120 Yes 360 41.5 52.8 53.8 15 375 A 57.3 40 47 -10.343.5 43.5 -3.5 -12.717 C25/30 20 100 No 275 21.7 31.5 -5 270 A 37.3 40 47 9.7 41.2 41.2 -5.8 -18.5Adjusted cementcontentCement/StrengthCodeExpected strengthReference strengthTarget strengthStrengthadjustmentFrom predictedFrom actualAdjusted strengthDifference fromtargetCUSUM MRangeTarget RangeDifference fromtargetCUSUM RActual — predicted28 dayCUSUM C6.5 3.9 2.6 17.8 1.0 -3.12.3 3.9 -1.616.2TARGET STRENGTH NOT BEING ACHIEVED; CEMENT CONTENT INCREASED; CUSUM M RESET TO ZERO17 Adjusted 21.7 31.5 270 B 34.3 40 47 12.7 44.2 44.2 0.0 16.218 C32/40 20 70 No 320 41.8 53.1 0 320 B 43.8 40 47 3.2 56.3 56.3 9.3 9.3 12.1 3.9 8.2 24.4STANDARD DEVIATION INCREASED TO 4,0 N/mm 2 ; TARGET STRENGTH INCREASED TO 48 N/mm 2 ; TARGET RANGE INCREASED TO 4,5 N/mm 2 ; CEMENT CONTENT INCREASED18 Adjusted 41.8 53.1 320 B 43.8 40 48 4.2 57.3 57.3 9.3 0.019 C25/30 20 100 No 290 26.2 36.9 -5 285 B 37.2 40 48 10.8 47.7 47.7 -0.3 9.0 9.6 4.5 5.1 5.120 C28/35 20 50 No 305 28.6 39.7 10 315 B 42.9 40 48 5.1 44.8 44.8 -3.2 5.8 2.9 4.5 - 3.51.621 P300 20 150 Yes 300 24.4 34.8 10 310 B 41.9 40 48 6.1 40.9 40.9 -7.1 -1.3 3.9 4.5 - 2.90.622 C32/40 20 70 No 340 39.5 51.0 0 340 B 47.6 40 48 0.4 51.4 51.4 3.4 2.1 10.5 4.5 6.0 8.9Page 51 <strong>of</strong> 53
<strong>Use</strong> <strong>of</strong> <strong>control</strong> <strong>charts</strong> <strong>in</strong> <strong>the</strong> <strong>production</strong> <strong>of</strong> <strong>concrete</strong>Figure 20: CUSUM M with additional dataFigure 21: CUSUM R with additional dataFigure 22: CUSUM C with additional dataPage 52 <strong>of</strong> 53
<strong>Use</strong> <strong>of</strong> <strong>control</strong> <strong>charts</strong> <strong>in</strong> <strong>the</strong> <strong>production</strong> <strong>of</strong> <strong>concrete</strong>12 References[1] SHEWHART, W A, Economic Control <strong>of</strong> Quality <strong>of</strong> Manufactured Product, 1931.[2] CEN, Product standards and conformity assessment guidel<strong>in</strong>e, CEN/BT N6287, 2000-11-09.[3] BRITISH STANDARDS INSTITUTION, Concrete – Part 1: Specification, performance,<strong>production</strong> and conformity, EN 206-1:2000.[4] HARRISON, T et al, Guidance on <strong>the</strong> application <strong>of</strong> <strong>the</strong> EN 206-1 conformity rules,Quarry Products Association, April 2001 (available for free download<strong>in</strong>g from <strong>the</strong> MPA-BRMCA web site).[5] CASPEELE, R and TAERWE, L, Comb<strong>in</strong>ed <strong>production</strong> and conformity <strong>control</strong> <strong>of</strong><strong>concrete</strong> with acceptance CUSUM <strong>control</strong> <strong>charts</strong>, 2010.[6] DEWAR, J D and ANDERSON, R, manual <strong>of</strong> Ready-Mixed <strong>concrete</strong>, 2 nd edition, 2003.[7] INTERNATIONAL STANDARDS ORGANISATION, Shewhart <strong>control</strong> <strong>charts</strong>,ISO8258: 1991.[7] INTERNATIONAL STANDARDS ORGANISATION, Acceptance <strong>control</strong> <strong>charts</strong>,ISO7966: 1993.[8] NEWMAN and CHOO, Advanced Concrete Technology – Test<strong>in</strong>g and Quality, Chapter9, 2003[9] BRITISH STANDARDS INSTITUTION, Guide to data analysis and quality <strong>control</strong>us<strong>in</strong>g CUSUM techniques, BS 5703:2003[10] BROWN, B V, Monitor<strong>in</strong>g <strong>concrete</strong> by <strong>the</strong> CUSUM system, Concrete Society DigestNo.6, 1984.[11] INTERNATIONAL STANDARDS ORGANISATION, Cumulative sum <strong>charts</strong> –Guidance on quality <strong>control</strong> and data analysis us<strong>in</strong>g CUSUM techniques, ISO/TR 7871:1997.[12] BRITISH STANDARDS INSTITUTION, Process <strong>control</strong> us<strong>in</strong>g quality <strong>control</strong> chartmethods and CUSUM techniques, BS5700.[13] NIST/SEMATECH, e-Handbook <strong>of</strong> Statistical Methods,http://www.itl.nist.gov/div898/handbook/, June 2008-06-18.[14] SEAR, L, A comb<strong>in</strong>ed CUSUM system for <strong>control</strong>l<strong>in</strong>g OPC and OPC/PFA <strong>concrete</strong>s,ACT Project 89/10.[15] DAY, K W, Concrete mix design, quality <strong>control</strong> and specification, 2 nd edition, 1999.[16] DAY, KW, Multigrade, multivariable CUSUM quality <strong>control</strong>, 8 th CANMET/ACIInternational Conference on advances <strong>in</strong> <strong>concrete</strong> technology, Montreal, May 2006.[17] DAY, KW, Concrete mix design, quality <strong>control</strong> and specification, 3 rd edition, 2007.[18] QUALITY SCHEME FOR READY MIXED CONCRETE, Quality and productconformity regulations,2003.[19] TROY, J, Private communication, April 2010.Page 53 <strong>of</strong> 53