Conceptual Site Model - Argonne National Laboratory
Conceptual Site Model - Argonne National Laboratory
Conceptual Site Model - Argonne National Laboratory

You also want an ePaper? Increase the reach of your titles
YUMPU automatically turns print PDFs into web optimized ePapers that Google loves.
Phase 1 Characterization Sampling and Analysis PlanWest Valley Demonstration ProjectRevision 1Prepared for theU.S. Department of EnergyWest Valley Demonstration ProjectWest Valley, New Yorkby<strong>Argonne</strong> <strong>National</strong> <strong>Laboratory</strong>Environmental Science Division9700 South Cass Avenue<strong>Argonne</strong>, IL 60439June 30, 2011
WVDP Phase 1 CSAPThis page intentionally left blank.Rev. 1ii
WVDP Phase 1 CSAP6.11.2 Down-Hole and Ex Situ Core Scans ..................................................................... 486.11.3 On-<strong>Site</strong> Cs-137 and Sr-90 Analytical Performance .............................................. 496.12 Develop an Inventory of Buried Infrastructure ...................................................................... 506.13 Determine Groundwater Flow Data Necessary for WMA 1 and WMA 2 Barrier WallDesigns .................................................................................................................................. 516.14 Collect Geotechnical Data Required for Barrier Wall Design ............................................... 516.15 Identify WMA-Specific Data Gaps ....................................................................................... 527.0 REMEDIAL ACTION SURVEYS................................................................................................ 537.1 WMA 1 and WMA 2 Excavation Support ............................................................................. 547.2 HLW Transfer Trench Contamination Status ........................................................................ 577.3 Removed Infrastructure Footprint Contamination Status ...................................................... 587.4 Excavation Efficacy ............................................................................................................... 598.0 REFERENCE AREA ..................................................................................................................... 618.1 Gross Activity Survey Reference Data Collection ................................................................ 618.2 Background Soil Sample Reference Data Collection ............................................................ 619.0 CIVIL SURVEYING AND COORDINATE CONTROL .......................................................... 659.1 Types of Civil Surveys .......................................................................................................... 659.2 Accuracy Requirements of Surveys ....................................................................................... 669.3 Survey Documentation .......................................................................................................... 6710.0 FIELD ACTIVITIES ..................................................................................................................... 6910.1 Soil Sampling Protocols ........................................................................................................ 6910.2 Groundwater Sampling Protocols .......................................................................................... 7010.3 Sample Chain-of-Custody/Documentation ............................................................................ 7010.3.1 Field Logbooks ..................................................................................................... 7010.3.2 Photographs .......................................................................................................... 7110.3.3 Sample-Numbering System .................................................................................. 7210.3.4 Sample Labels ....................................................................................................... 7210.3.5 Cooler Receipt Checklist ...................................................................................... 7210.3.6 Chain-of-Custody Records ................................................................................... 7310.3.7 Receipt of Sample Forms ...................................................................................... 7410.4 Documentation Procedures .................................................................................................... 7410.5 Corrections to Documentation ............................................................................................... 7510.6 Sample Packaging and Shipping............................................................................................ 7510.6.1 Sample Packaging ................................................................................................. 7510.6.2 Additional Requirements for Samples Classified as Radioactive Material .......... 7610.6.3 Sample Shipping ................................................................................................... 77Rev. 1iv
WVDP Phase 1 CSAP10.7 Investigation-Derived Waste ................................................................................................. 7710.8 Field Decontamination ........................................................................................................... 7811.0 GROSS ACTIVITY SURVEYS .................................................................................................... 7911.1 Surface Conditions ................................................................................................................. 7911.2 Detector Technologies ........................................................................................................... 8111.3 Background ............................................................................................................................ 8311.4 Protocols ................................................................................................................................ 8411.5 Quality Control and Quality Assurance ................................................................................. 8512.0 LABORATORY ANALYSES ....................................................................................................... 8912.1 Rapid <strong>Laboratory</strong> Analyses ................................................................................................... 8912.2 Standard <strong>Laboratory</strong> Analyses ............................................................................................... 9013.0 DOCUMENTATION AND REPORTING .................................................................................. 9314.0 QUALITY ASSURANCE AND QUALITY CONTROL ............................................................ 9515.0 REFERENCES ............................................................................................................................... 97APPENDICES 99Rev. 1v
WVDP Phase 1 CSAPLIST OF TABLESTable 1: Phase 1 Cleanup Goals (picocurie/gram [pCi/g]) ........................................................................ 14Table 2: ROI Sample Results from Three Locations (pCi/g) .................................................................... 24Table 3: Twelve Radionuclides of Potential Interest ................................................................................. 28Table 4: Soil Sample Numbers for Volume Estimation............................................................................. 44Table 5: Estimated Scanning Minimum Detectable Concentrations (MDCs) of Radionuclides in Soil ... 82Table 6: Radionuclide Target Sensitivity for <strong>Laboratory</strong> Sample Analysis .............................................. 91LIST OF FIGURESFigure 1 WVDP Waste Management Areas ................................................................................................. 9Figure 2 Locations of Subsurface Samples with ROI Results (except Uranium Isotopes) ......................... 23Figure 3 Surface Soil Samples with Both Cs-137 and Sr-90 Results ......................................................... 25Figure 4 Surface Soil Samples with SOR > 0.1 .......................................................................................... 26Figure 5 Flowchart Showing Decision-Making Process Based on GWS Data Collection ......................... 31Figure 6 Erdman Brook and Franks Creek Sections Where Sediment CG Requirements Apply ............... 39Figure 7 WVDP Radiologically Controlled Areas...................................................................................... 80Rev. 1vi
WVDP Phase 1 CSAPACRONYMS, ABBREVIATIONS, AND SYMBOLSAcAGCAmCCdCGCG emcCG wCISFCmcmCoCsCDDLCSAPDCGLDCGL wDEISDPDOEDOTDQIDQOELIMSEPAESRIEuFIDLERFSPFSSFSSPftGPSGWSH&SHASPHLWIIDWin.actiniumU.S. Army Geospatial Centeramericiumcarboncadmiumcleanup goalcleanup goal, elevated measurement criterioncleanup goal, wideCanister Interim Storage FacilitycuriumcentimetercobaltcesiumConstruction and Demolition Debris LandfallCharacterization Sampling and Analysis Planderived concentration guideline levelderived concentration guideline level, wideDraft Environmental Impact StatementDecommissioning PlanDepartment of EnergyU.S. Department of Transportationdata quality indicatorsdata quality objectiveElectronic <strong>Laboratory</strong> Information Management SystemU.S. Environmental Protection AgcncyEnvironmental Systems Research InstituteeuropiumField Instrument for Detection of Low Energy Radiationfield sampling planFinal Status SurveyFinal Status Survey Planfoot/feetglobal position systemgamma walkover surveyhealth and safetyHealth and Safety PlanHigh-Level WasteiodineInvestigation-Derived WasteinchRev. 1vii
WVDP Phase 1 CSAPLBGRLIDARmm 2mmMARSSIMMDCNaINFSNISTNpNRCPapCi/gPhase 1 DPPPEPuQAQAPPQCRaRCRAROISbSDASnSOPSORSrTcThUUSACEUTLWMAWRSWVDPWVESZnSLower Bound of the Gray RegionLight Detection and Rangingmetersquare metermillimeterMulti-Agency Radiation Survey and <strong>Site</strong> Investigation Manualminimum detectable concentrationsodium iodideNuclear Fuel Services, Inc.<strong>National</strong> Institute of Standards and TechnologyneptuniumNuclear Regulatory CommissionprotactiniumpicoCurie/gramDecommissioning Plan for the West Valley Demonstration Projectpersonal protective equipmentplutoniumquality assuranceQuality Assurance Project Planquality controlradiumResource Conservation and Recovery Actradionuclides of interestantimonyState Licensed Disposal Areatinstandard operating procedureSum of RatiosstrontiumtechnetiumthoriumuraniumUnited States Army Corps of EngineersUpper Tolerance LevelWaste Management AreaWilcoxon Rank SumWest Valley Demonstration ProjectWest Valley Environmental Serviceszinc sulfideRev. 1viii
WVDP Phase 1 CSAPRECORD OF REVISIONSDate Section Revision Reason11/30/2010 WholedocumentStandardized references to “surfacesoil,” “surficial soil,” “subsurfacesoil,” and “buried soil” throughoutPer NYSERDA comment 111/30/2010 Throughoutdocument11/30/2010 Throughoutdocument11/30/2010 Throughoutdocumentthe plan to avoid confusion.Removed references to compositesampling and revised the text toinclude only discrete samplesRe-defined surface soil samplingintervals as 0 to 15 cm and 15 to100 cmCalculate 0 – 1 m surface soilactivity concentrations using resultsfrom 0 -15 cm and 15 -100 cm soilsample results rather than measuringthem directly11/30/2010 Various Added text clarifying thatcharacterization of surface andsubsurface soils beneath hardstandsmay be deferred until their removalas part of Phase 1 DP activities11/30/2010 Allappendices11/30/2010 Throughoutdocument11/30/2010 Section 2.1,bullet 14Modified description of historicalcontaminant releasesMade typographical correctionsAdded text added to clarify thatgeotechnical informationrequirements for WMA 1 and WMA2 walls will be determined by theremediation contractor assignedwith responsibility for their design.11/30/2010 Section 2.3 Added text to indicate Lagoons 4and 5 are within Phase 1 scope11/30/2010 Section 2.3 Added text to describe CISFconstruction activities planned forWMA 611/30/2010 Section 6.5 Added text to indicate GWS datamay be inconclusive regardingcontamination status of surface soilsin areas where surface soils havebeen reworked11/30/2010 Section 6.5 Added text to indicate that Phase 1sediment CG values apply tospecific defined portions of ErdmanPer DOE requestTo improve understanding ofvertical distribution ofcontaminationTo improve understanding ofvertical distribution ofcontaminationTo facilitate access of exposed soilsurfaces and improvecharacterizationTo improve consistency andreadability and to reflect additionalavailable information and to addressNYSERDA comment 28NYSERDA comments and<strong>Argonne</strong> editing commentsPer NYSERDA comment 3.Per NYSERDA comment 4Per NYSERDA comment 5Per NYSERDA comment 9Per NYSERDA comment 10Rev. 1ix
WVDP Phase 1 CSAPBrook and Franks Creek.11/30/2010 Section 6.6 Added reference to Section 6.2 Per NYSDERDA comment 1311/30/2010 Section 6.10 Modified section to be consistent Per NYSERDA comment 17with Sections 6.5 and 6.6 of theCSAP11/30/2010 Section 7.1 Provided slope for the southern wall Per NYSERDA comment 18of WMA 2 excavation11/30/2010 Section 7.1 Added text to clarify what actions Per NYSERDA comment 19.will be taken if contamination isencountered in the walls of theWMA 1 excavations.11/30/2010 Section 8.3 Revised Section 8.3 to be consistent Per NYSERDA comment 20.with Section 8.211/30/2010 Section 11.5 Added text to Section 11.5 to clarify Per NYSERDA comment 22how control charts would be usedfor QC purposes11/30/2010 Section 13 Added text to clarify that GIS will Per NYSERDA comment 24be used for data analysis andpresentation11/30/2010 Section 14 Added text to clarify actions to be Per NYSERDA comment 25taken if detector performance fallsoutside acceptable ranges11/30/2010 Section 6.2 Added text justifying proposed Per NYSERDA comment 27approach for selecting samples foranalysis of the 12 potential ROIs11/30/2010 Section A.4 Modified text to more clearly Per NYSERDA comment 30identify sources of soilcontamination associated with oldsewer line11/30/2010 Figure A.23 Modified figure modified to show Per NYSERDA comment 39locations of soil bores alongproposed walls11/30/2010 Section B.1 Added text to clarify existinginfrastructure status and usePer NYSERDA comments 40, 41,and 4211/30/2010 Section B.9.3 Reorganized text to clarify sampling Per NYSERDA comment 44requirements11/30/2010 Section D.3 Added text about the history of the Per NYSERDA comment 50CDDL11/30/2010 Section E.9.3 Reorganized text to clarify sampling Per NYSERDA comment 53requirements11/30/2010 Section F.1 Added text to describe the history of Per NYSERDA comment 55the Old Sewage Treatment Plant11/30/2010 Section F.1 Added text to clarify planned Phase Per NYSERDA comment 561 test tower activities11/30/2010 Section F.9.3 Modified text to indicate sampling Per NYSERDA comment 57will address the 0 to 1 m soil surface11/30/2010 Section G.9.3 Modified text to indicate sampling Per NYSERDA comment 59will address the 0 to 1 m soil surface11/30/2010 AllappendicesAdjusted sample numbers to reflectmodifications to the CSAPPer NYSERDA comment 62Rev. 1x
WVDP Phase 1 CSAP11/30/2010 Section 6.5and 7.3Added text to clarify when and howsoils beneath hardstands will becharacterized11/30/2010 Section I.9.3 Modified text to indicate 0- to 15-cm-depth interval sampling appliesto areas where there are no concernsabout historical soil reworking11/30/2010 Section J.7 Clarified text to state that there wereno known releases within WMA11211/30/2010 Section6.11.111/30/2010 Section 6.5andappendicesAdded text specifying that staticFIDLER readings will be collectedprior to surface soil sampling forevery location where surface soilsamples are collectedAdded flowchart showing thedecision-making process based onGWS data, and modified appendicesto be consistent with flowchart11/30/2010 Section 8.2 Added requirement to reference areawork to complete and log four soilbores down to the Lavery Till12/31/2010 Table 3 Deleted references to NUREG-1757Vol. 2 soil screening values andadded required laboratorysensitivities12/31/2010 Section 8.3 Added text clarifying how aninvestigation level would be derivedfor GWS results to guide biased soilsampling12/31/2010 Section 6.2 Modified text to indicate that theCSAP background comparison willbe based solely on the 95% UTLvalues calculated based on referencearea sample results3/10/2011 Section 6.1 Text modified to state that the FSSSOR requirement will be reducedfor WMA’s with reducedradionuclides lists to reflect theaverage dose contribution of themissing radionuclides5/25/2011 Section 2.1and Section6.135/25/2011 Section 6.5andappendicesDeleted objective 13 in Section 2.1and Section 6.13 which was toobtain data to support Phase 2decision-makingAdditional text added clarifying thenumber of systematic surface soilsamples required for areas that arePer NYSERDA comment 64Per NYSERDA comment 66Per NYSERDA comment 68Per NRC comment FSSP-1Per NRC comment CSAP-2Per NRC comment CSAP-3Per NRC comment CSAP-6Per NRC comment CSAP-7Per NYSERDA requestPer NRC commentPer DOE request to avoid confusionover the primary goal of CSAPwork, which is to support Phase 1activities and to avoid the perceptionthat the CSAP would satisfy allPhase 2 information needs.Per NYSERDA request.Rev. 1xi
WVDP Phase 1 CSAPtoo wet to allow gamma walkoversurveys.Rev. 1xii
WVDP Phase 1 CSAPEXECUTIVE SUMMARYThe Phase 1 Characterization Sampling and Analysis Plan (CSAP) provides details about environmentaldata collection that will be taking place to support Phase 1 decommissioning activities described in thePhase 1 Decommissioning Plan for the West Valley Demonstration Project, Revision 2 (Phase I DP;DOE 2009).The four primary purposes of CSAP data collection are: (1) pre-design data collection, (2) remedialsupport, (3) post-remediation status documentation, and (4) Phase 2 decision-making support. Datacollection to support these four main objectives is organized into two distinct data collection efforts. Thefirst is data collection that will take place prior to the initiation of significant Phase 1 decommissioningactivities (e.g., the Waste Management Area [WMA] 1 and WMA 2 excavations). The second is datacollection that will occur during and immediately after environmental remediation in support ofremediation activities. Both data collection efforts have a set of well-defined objectives that encompassthe data needs of the four main CSAP data collection purposes detailed in the CSAP.The main body of the CSAP describes the overall data collection strategies that will be used to satisfydata collection objectives. The details of pre-remediation data collection are organized by WMA. TheCSAP contains an appendix for each WMA that describes the details of WMA-specific pre-remediationdata collection activities.The CSAP is intended to expand upon the data collection requirements identified in the Phase 1Decommissioning Plan. The CSAP is intended to tightly integrate with the Phase 1 Final Status SurveyPlan (FSSP). Data collection described by the CSAP is consistent with the FSSP where appropriate and tothe extent possible.Rev. 1xiii
WVDP Phase 1 CSAP1.0 INTRODUCTION AND PURPOSEThe Phase 1 Decommissioning Plan for the West Valley Demonstration Project, Revision 2(Phase I DP; DOE 2009) describes the Phase 1 decommissioning activities planned for the WestValley Demonstration Project (WVDP) premises. These activities will at least partially addressresidual radionuclide contamination concerns in environmental media (soils and groundwater).The Phase 1 DP includes unrestricted release Derived Concentration Guideline Levels (DCGLs)for the identified radionuclides of interest (ROIs) pertinent to the environmental media to beaddressed by Phase 1 activities.The objective of the Phase 1 decommissioning activities is to remove certain facilities andremediate specific portions of the WVDP premises according to criteria for unrestricted releaseconsistent with the License Termination Rule in 10 CFR 20.1402 in a manner that will not limitfuture Phase 2 decommissioning options. The Phase 1 DP activities are intended to reduce shortandlong-term health and safety (H&S) risks in a manner that will ultimately support the Phase 2decommissioning activities required to complete decontamination and decommissioning of theproject premises.To support Phase 1 decommissioning activities, environmental sampling data will be collected forfour main purposes; these include, but are not limited to, the following:• Providing data necessary to properly design and implement Phase 1 decommissioningactivities intended to address environmental contamination;• Supporting remediation activities while they are under way;• Documenting the post-Phase 1 remediation contamination status of selected areas; and• Providing data necessary for Phase 2 decision-making.This Phase 1 Characterization Sampling and Analysis Plan (CSAP) provides the basis for thisdata collection.The CSAP scope includes environmental media data collection (surface and subsurface soils,sediments, and groundwater) to support Phase 1 decommissioning activities. Waste streamcharacterization data collection during the course of remediation and structure/buildingRev. 1 1
WVDP Phase 1 CSAPcharacterization is outside the scope of the CSAP; data collection efforts in support of those twoactivities will be described in separate plans. However, CSAP pre-remediation data collectionwill provide information pertinent to waste stream characterization needs.In addition, the CSAP is focused on radiological parameters of interest. Chemical analyses arealso outside the scope of the CSAP. Any chemical analyses required to support ResourceConservation and Recovery Act (RCRA) decision-making will be described in separatedocumentation. Finally, the CSAP does not address Final Status Survey (FSS) data collectionrequirements. FSS requirements are described in the Phase 1 Final Status Survey Plan, Revision 1(DOE 2011) for the WVDP.The contents of this plan supplement and expand upon information contained in the Phase 1 DP.All CSAP field activities will be conducted consistent with the Health and Safety Plan (HASP)described by the Phase 1 DP. Some areas within the WVDP premises have been identified asradiological controlled areas; CSAP work within those areas will comply with pertinentradiologically controlled area requirements.Section 9.4.2 of the Phase 1 DP describes the U.S. Environmental Protection Agency’s (EPA’s)Data Quality Objective (DQO) process (EPA 2006), which is a seven-step process for developingtechnically defensible data collection programs. These seven steps are: (1) identifying theproblem, (2) specifying the decision, (3) determining the potential inputs to the decision, (4)defining the study boundaries, (5) developing decision rules, (6) establishing limits on decisionerrors, and (7) optimizing the final design. The CSAP does not follow the exact organization ofthe DQO process but does address each of the steps. The CSAP introduction states the problem tobe addressed: satisfying the data needs of the Phase 1 DP process. Section 2.0 provides thespecific decisions/objectives/questions that must be answered by CSAP data collection. Inputs tothose questions, study boundaries, decision rules and acceptable errors, and the final datacollection designs are presented in Sections 5.0, 6.0, and 7.0, and additional Waste ManagementArea- (WMA-) specific details for pre-remediation data collection are provided in the appendices.Rev. 1 2
WVDP Phase 1 CSAP2.0 OBJECTIVES AND OVERVIEWSection 1.0 identified the following four main CSAP data collection purposes: (1) pre-design datacollection, (2) remedial support, (3) post-remediation status documentation, and (4) Phase 2decision-making support. Data collection to support these four main purposes is organized intotwo distinct data collection efforts. The first is pre-remediation data collection that will take placeprior to the initiation of significant Phase 1 decommissioning activities (e.g., the WMA 1 andWMA 2 excavations). The second is remediation support data collection that will occur duringand immediately after environmental remediation in support of remediation activities. Both datacollection efforts have a set of well-defined objectives, described in more detail below, thatencompass the data needs of the four main CSAP data collection purposes.2.1 Pre-remediation Data Collection Objectives1. Evaluate Appropriateness of the Current List of ROIs. The Phase 1 DP contains a masterlist of 18 ROIs for the WVDP premises. This list may not be applicable to all areas of theWVDP premises. Data collection is required to identify area-specific subsets of this listthat would need to be addressed by any future area-specific sampling activities (e.g.,FSS). These data would be used to ensure that appropriate analytical procedures areemployed for specific areas during any follow-on data collection activities. One possibleoutcome is that the master ROI list is reduced for specific areas (i.e., one or more of the18 ROIs either are not found in the soils/sediments or are found at such low level activityconcentrations that they are inconsequential for Phase 1 decision-making).2. Verify Absence of Additional ROIs. An additional 12 potential ROIs have been tentativelyidentified based on screening analyses described in the 1996 Draft Environmental ImpactStatement (DEIS) (DOE 1996). Data collection is required to verify that these 12potential ROIs are not of any significant decision-making concern. These data would beused to determine whether the current ROI list contained in the Phase 1 DP should beexpanded.3. Explore the Possibility of Surrogate ROIs. There is a question as to whether ROI ratiosare consistent enough to allow for the use of surrogates in future data collection effortsRev. 1 3
WVDP Phase 1 CSAP(e.g., remedial support and FSS). Data collection is required to determine area-specificradionuclide ratios and determine their consistency. These data would be used to supportthe use of surrogates, if the results indicate this is appropriate.4. Establish Background Data Sets. The Phase 1 DP calls for background surveys to beperformed to establish surface soil background conditions in known non-affected areas.Background survey data are necessary for interpreting gross activity scan results and fordetermining when CSAP soil results are inconsistent with background assumptions andmay be useful for FSS analysis depending on the type of statistical test used to establishcompliance with wide-area DCGL (DCGL w ) requirements. Surface soil background datacollection will take place from an appropriate area near or within the WVDP premises,possibly an area that has been used to collect previous background data for the WVDPpremises.5. Determine Extent of Surface Soil Contamination. The lateral and vertical extent ofsurface soil contamination (represented by the top 0-1m of soil) present at activityconcentrations that would require an action based on the ROI list and associated surfacesoil DCGLs contained in the Phase 1 DP is unknown. Data collection is required todetermine the extent of contamination. These data would become the basis for potentialexcavation footprints (discretionary in Phase 1) and volume estimates that can be used forprogrammatic planning purposes (i.e., costing, identifying appropriate disposal optionsand appropriate material handling needs, and so forth), and for FSS design and support inthose areas where remediation will, ultimately, be unnecessary.6. Identify the Presence/Absence of Subsurface Soil Contamination. The presence/absenceand vertical depth (where present) of soil contamination in areas outside the plannedWMA 1 and WMA 2 excavations is unknown. Data collection is required to determinepresence and extent of contamination outside the planned WMA 1 and WMA 2excavations. These data may be used to adjust DCGL derivations contained in the Phase1 DP for subsurface soils and would be used to identify areas suitable for Phase 1 FSSdata collection (i.e., areas where surface contamination appears to meet DCLGrequirements and subsurface contamination is absent). These data would also be used todetermine whether thin layers of highly elevated contamination are present in the top 1-msoil profile that would pose dose concerns if exposed but that may not be identified byRev. 1 4
WVDP Phase 1 CSAPFSS protocols or to determine whether localized hot spots exist in the subsurface.Additionally, these data would be used to assist with volume estimation and contaminantfootprint delineation for programmatic planning purposes and for FSS design purposes,as appropriate.7. Determine Level and Extent of Sediment Contamination. The level and vertical/lateraldistribution of contamination in Erdman Brook and Franks Creek sediments within theWVDP premises are not known. Data collection is required to determine the activityconcentrations and vertical/lateral distribution of contamination in stream sediments andin and along the adjacent banks. These data may be used to adjust DCGL derivationscontained in the Phase 1 DP for sediments and would be used to assist with volumeestimation and contaminant footprint delineation for programmatic purposes and for FSSdesign purposes, as appropriate.8. Define Required Extent of WMA 1 and WMA 2 Excavations. The nature and extent ofsubsurface contamination in the area of the planned boundaries of the WMA 1 and WMA2 excavations is not well-defined. The minimum excavation footprints are defined by theneed to remove subsurface foundations and infrastructure and contaminated soils downinto the Lavery Till interface. The volume of soil to be excavated to meet these minimumexcavation requirements is reasonably well-known. However, it is particularly importantto confirm that there is no significant subsurface contamination on the up-gradient andthe southern cross-gradient sides of the WMA 1 excavation. If this contamination ispresent, it may pose recontamination concerns for the clean backfill used in the WMA 1excavation after the sheet pile wall impermeable barriers are removed. Data collection isrequired to determine the presence and level of contamination that might be encounteredalong the planned boundaries of the WMA 1 and WMA 2 excavations.9. Identify Soil Waste Stream Characteristics. The characteristics of soil waste streams thatwill be generated by Phase 1 excavation activities are unknown. Pre-remediation datacollection is required to determine the radiological waste profile characteristics of soilsfrom these different waste streams that will be disposed of at an off-site disposal facility.These data would be used to assist with programmatic planning purposes and to supportthe evaluation of potential H&S concerns. Note that remedial support waste streamcharacterization activities are outside the scope of the CSAP.Rev. 1 5
WVDP Phase 1 CSAP10. Verify Contamination Status of Soils To Be Affected by Phase 1 Construction Needs. Thecurrent contamination status of soils that will be affected by on-site construction activitiesneeds to be determined. Data collection is required to establish the contamination statusof surface soils in areas to be used to support Phase 1 decommissioning activities prior tothe initiation of those activities. An example is the area where the new Canister InterimStorage Facility will be constructed. The purpose of this data collection is to determinecontamination status and support corrective action decision-making that might bedesirable prior to facility construction/soil reworking.11. Establish <strong>Site</strong>-Specific Performance for On-<strong>Site</strong> and Field-Based Analytical Methods.The site-specific performance of field-screening and field-deployable analytical methodshas not been established for the WVDP premises. The Phase 1 decommissioning processfor the WVDP will be a lengthy and expensive program. Field-screening and fielddeployableanalytical methods (e.g., trailer-based) have the potential for streamliningcharacterization, remediation, waste disposal, and FSS activities. Examples of these arescanning methods (and associated detection limits) for Cs-137, and on-site analyticalmethods for Cs-137 and Sr-90. CSAP activities will provide an opportunity todemonstrate and optimize performance of field-screening and on-site analytical methodsfor the benefit of future WVDP work. Data are required that can be used forcharacterization of technology performance and long-term deployment.12. Develop an Inventory of Buried Infrastructure. The WVDP premises are assumed to havea significant amount of buried infrastructure associated with the various WVDP buildingsand their historical activities. This infrastructure is important from the perspective ofidentifying the potential for subsurface contamination and for designing andimplementing safe characterization and remediation activities. The current understandingof buried infrastructure (location, footprint, original purpose, and contamination status) isincomplete. Data collection is required to develop, as practicable, a completeunderstanding of the location and footprint of buried infrastructure across the WVDPpremises.13. Determine Groundwater Flow Data Necessary for WMA 1 and WMA 2 Barrier WallDesigns. The design of the barrier walls for WMA 1 and 2 will require area-specificRev. 1 6
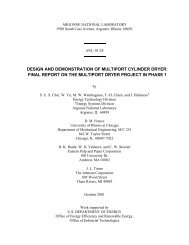
WVDP Phase 1 CSAP2. High-Level Waste (HLW) Transfer Trench Contamination Status. Data will be collectedto establish the radiological status of the inside of the empty HLW Transfer Trench(WMA 3) after the transfer lines have been removed.3. Removed Infrastructure Footprints Contamination Status. In many cases, the Phase 1decommissioning activities will remove infrastructure (including pads and foundations)and thereby expose soils. Where the exposed soils meet DCGL requirements andcontamination is not present in underlying soils, FSS data collection may take place.Alternatively, data may be collected to simply establish the contamination status of theexposed soils when Phase 1 activities are complete for use in determining what additionalaction may be required in Phase 2.4. Excavation Efficacy. Where significant removal of soil is required (e.g., WMA 1 andWMA 2) or where contaminated soil is removed outside of the WMA 1 and WMA 2deep excavations as part of other activities (e.g., hardstand removals), data will becollected to guide soil removal, to support soil segregation for waste disposal purposes,and/or to verify that the remediation goals for that particular location or area have beenachieved. When appropriate, these data will be collected consistent with the requirementsof the Phase 1 FSSP to assist in demonstrating compliance with relevant DCGLstandards.2.3 CSAP OverviewFor planning purposes, the WVDP premises have been divided into WMAs as described in thePhase 1 DP. There are 12 WMAs, numbered 1 through 12. Of these, all will potentially beincluded in CSAP data collection efforts, with the exception of WMA 8 and WMA 11. WMA 8includes the State-Licensed Disposal Area (SDA), which is not part of the WVDP. WMA 11includes properties separate from the primary WVDP premises that are not within the scope ofPhase 1 DP activities. Figure 1 shows the location of each WMA. Additional descriptive detail isprovided below.Rev. 1 8
WVDP Phase 1 CSAPFigure 1 WVDP Waste Management AreasRev. 1 9
WVDP Phase 1 CSAP• WMA 1 is approximately 4.4 acres. WMA 1 contains the bulk of the WVDP’s facilities,including the Process Building, the Vitrification Building, and supporting facilities. Alarge, deep excavation is planned for WMA 1 as part of Phase 1 DP activities. Theexcavation will remove contaminated facilities and address subsurface contamination thatis a source for the North Plateau Groundwater Plume, as described in Section 7.3 of thePhase 1 DP.• WMA 2 is approximately 14 acres. WMA 2 contains low-level radioactive waste watermanagement facilities, including various lagoons. A large, deep excavation is planned forWMA 2 as part of Phase 1 DP activities. The excavation will remove contaminated wastewater management facilities; Lagoons 1, 2 and 3; and associated subsurface soilcontamination. In addition, facilities outside the deep excavation, including Lagoons 4and 5, will be removed, as described in Section 7.4 of the Phase 1 DP.• WMA 3 is approximately 2.3 acres. WMA 3 contains the HLW tank facilities. Only verylimited contaminated facility removal is planned for WMA 3 as part of Phase 1 DPactivities; the HLW tanks will remain in place, as described in Section 7.5 of the Phase 1DP.• WMA 4 is approximately 10 acres. WMA 4 contains the Construction and DemolitionDebris Landfill (CDDL). There currently are no planned Phase 1 DP activities withinWMA 4.• WMA 5 is approximately 19 acres. WMA 5 includes a variety of waste-processing andstorage facilities. Removal of facilities, facility pads, and hardstands is planned for WMA5 as part of Phase 1 DP activities, as described in Section 7.6 of the Phase 1 DP.• WMA 6 is approximately 14.5 acres. WMA 6 contains a variety of support facilities.Removal of facilities, facility pads, and hardstands is planned for WMA 6 as part ofPhase 1 DP activities, as described in Section 7.7 of the Phase 1 DP. In addition,construction of a Canister Interim Storage Facility (CISF) is planned for the south end ofRev. 1 10
WVDP Phase 1 CSAPWMA 6 to house the 275 canisters of vitrified high-level waste currently stored in theMain Plant Process Building. Preliminary designs for the CISF include a concrete padwith approximate dimensions of 150 ft by 200 ft by 3 ft in thickness. This concrete padwill be used to temporarily store horizontal or vertical shielded concrete storage modulescontaining canisters of vitrified HLW. The exact number of storage modules will dependon the number of canisters of vitrified HLW that will be stored in each individual storagemodule.• WMA 7 is approximately 8 acres. WMA 7 contains the Nuclear Regulatory Commission-(NRC-) Licensed Disposal Area (NDA). Removal of a hardstand is the only activityplanned for WMA 7 as part of Phase 1 DP activities, as described in Section 7.8 of thePhase 1 DP.• WMA 8 contains the SDA, which is not within the scope of the WVDP.• WMA 9 is approximately 12 acres. WMA 9 contains the Drum Cell. The Drum Cell andseveral hardstands will be removed from WMA 9 as part of Phase 1 DP activities, asdescribed in Section 7.9 of the Phase 1 DP.• WMA 10 is approximately 30 acres. WMA 10 includes several support facilities andparking lots. Removal of some of the facilities, facility pads, hardstands, and parking lotsis planned for WMA 10 as part of Phase 1 DP activities, as described in Section 7.10 ofthe Phase 1 DP.• WMA 11 includes the Bulk Storage Warehouse and Hydrofracture Test Well Area. Thesefacilities/areas are physically separated from the primary WVDP premises. WMA 11 isnot within the scope of the Phase 1 DP.• WMA 12 includes all other WVDP areas. As indicated in Figure 1, there are two separateportions of the primary WVDP premises that fall within WMA 12, a portion along thenorthern boundary of the WVDP premises, and a larger area in the central/eastern part ofthe WVDP premises. Currently, there are no Phase 1 DP activities planned for eitherportion of WMA 12 within the WVDP premises.Rev. 1 11
WVDP Phase 1 CSAPThe CSAP scope includes data collection on environmental media (surface and subsurface soils,sediments, and groundwater) to support Phase 1 decommissioning activities. Surface soils refer tosoils within the uppermost 1 m of the vertical soil profile. The top of the vertical soil profile isdefined to be either exposed soil surfaces or the interface between soils and surface soil coversuch as asphalt, floor slabs, concrete pavement, compacted gravel, and the like. Subsurface soilsrefer to all soils deeper than the definition of surface soils. Sediments refer to sediment orsediment-like material found in the footprint of ditches, drainage features, and streams within theWVDP premises. The main body of the CSAP provides general information regarding the typesof data collection and data collection strategies that will be implemented in support of Phase 1 DPactivities. Pre-remediation WMA-specific data collection details are contained in CSAPappendices, with an appendix dedicated to each WMA within the WVDP premises. Eachappendix also provides further details about the WMA that it addresses, including informationabout known and suspected contamination releases.The Phase 1 DP presented 18 ROIs and developed DCGLs for each radionuclide appropriate forsurface soils, sediments, and subsurface soils. The surface soil standards are applicable only inthose areas where contamination impacts are limited to the top 1 m of soil. The sedimentstandards are applicable only to specific portions of Erdman Brook and Franks Creek as describedin Section 5.1.2 in the Phase 1 DP. The subsurface soil standards are applicable only to the finalexposed excavation surfaces that are deeper than one m and are associated with the WMA 1 andWMA 2 excavations as discussed in Section 5.2.5 in the Phase 1 DP. The DCGL standards werefurther refined by the Phase 1 DP to account for cumulative dose scenarios; the Phase 1 DP refersto the final set of standards as cleanup goals (CG).Since there are multiple radionuclides, CGs are implemented using a Sum of Ratios (SOR)calculation. The SOR value for a sample is computed as the sum of the radionuclide-specificactivity concentrations, with each divided by its respective CG value (the cleanup goal wide[CG w ] for SOR values pertinent to the CG w , or the cleanup goal elevated measurement criterion[CG emc ] for SOR values pertinent to the CG emc ). Because CG values are incremental tobackground, for CSAP purposes the average background activity concentration will be subtractedfrom each radionuclide’s result before the sample SOR is calculated. SOR calculations addressthe situation in which a sample might have all radionuclides below their CG value, but at aRev. 1 12
WVDP Phase 1 CSAPsignificant fraction of their CG value; the cumulative dose in this instance could exceed therequired dose limits. This would be reflected by an SOR value greater than one.Table 1 reproduces the Phase 1 DP CG values contained in Table 5-14 of that document. Thesevalues are incremental to background. For the balance of this document, cleanup requirements arereferred to as CG requirements.Rev. 1 13
WVDP Phase 1 CSAPTable 1: Phase 1 Cleanup Goals (picocurie/gram [pCi/g])(Source: WVDP Phase 1 Decommissioning Plan, Revision 2, Table 5-14)Surface Soil Subsurface Soil Streambed SedimentNuclideCG 1 w CG 2 emc CG w CG emc CG w CG emcAm-241 2.6E+01 3.9E+03 2.8E+03 1.2E+04 1.0E+03 2.1E+04C-14 1.5E+01 1.6E+06 4.5E+02 8.0E+04 1.8E+02 5.9E+05Cm-243 3.1E+01 7.5E+02 5.0E+02 4.0E+03 3.1E+02 2.8E+03Cm-244 5.8E+01 1.2E+04 9.9E+03 4.5E+04 3.8E+03 3.6E+05Cs-137 1.4E+01 3.0E+02 1.4E+02 1.7E+03 1.0E+02 9.4E+02I-129 2.9E-01 6.0E+02 3.4E+00 3.4E+02 7.9E+01 2.0E+04Np-237 2.3E-01 7.5E+01 4.5E-01 4.3E+01 3.2E+01 1.1E+03Pu-238 3.6E+01 7.6E+03 5.9E+03 2.8E+04 1.2E+03 1.7E+05Pu-239 2.3E+01 6.9E+03 1.4E+03 2.6E+04 1.2E+03 1.7E+05Pu-240 2.4E+01 6.9E+03 1.5E+03 2.6E+04 1.2E+03 1.7E+05Pu-241 1.0E+03 1.3E+05 1.1E+05 6.8E+05 3.4E+04 7.5E+05Sr-90 3.7E+00 7.9E+03 1.3E+02 7.3E+03 4.7E+02 7.1E+04Tc-99 1.9E+01 2.6E+04 2.7E+02 1.5E+04 6.6E+04 4.2E+06U-232 1.4E+00 5.9E+01 3.3E+01 4.2E+02 2.2E+01 2.1E+02U-233 7.5E+00 8.0E+03 8.6E+01 9.4E+03 2.2E+03 4.4E+04U-234 7.6E+00 1.6E+04 9.0E+01 9.4E+03 2.2E+03 2.1E+05U-235 3.1E+00 6.1E+02 9.5E+01 3.3E+03 2.3E+02 2.0E+03U-238 8.9E+00 2.9E+03 9.5E+01 9.9E+03 8.2E+02 8.2E+03Notes:(1) CG w refers to activity concentrations that must be achieved, on average, over areas the size ofFSS units.(2) CG emc refers to activity concentrations that must be achieved, on average, over 1-m 2 areas.Rev. 1 14
WVDP Phase 1 CSAP3.0 ORGANIZATION, RESPONSIBILITIES, AND DOCUMENTATION3.1 OrganizationCSAP activities will be managed in accordance with Department of Energy (DOE) requirements.Necessary data collection tasks will be defined and scheduled. Appropriate schedules will bedeveloped for this purpose, such as a long-term schedule, short-term schedules, and plans-of-theweek.NRC will be provided copies of these schedules for information. Implementing plans willbe prepared as necessary in support of the work.3.2 ResponsibilitiesDOE will employ a characterization contractor to accomplish the planned Phase 1 data collectionactivities, including those contained in this plan as well as those specified by the FSSP. Thecharacterization contractor will be responsible for developing and implementing task-specificwork plans that are consistent with the CSAP and the preparation of data packages and summaryreports as deliverables for completed tasks. DOE will provide task-specific work plans andresulting data packages and reports to the NRC as work progresses. DOE and/or its contractorswill maintain an administrative record of characterization activities, including electronic andhardcopy documents, data sets, and related information such as maps, diagrams, geologic logs,field notebooks, and photographs.3.3 DocumentationPrior to the initiation of Phase 1 CSAP activities, the characterization contractor will develop aHASP and Quality Assurance Project Plan (QAPP) applicable to the proposed Phase 1 CSAPwork.Field data collection activities will be initiated through the use of DOE-issued technical taskorders. These technical task orders may be area-specific (e.g., implement pre-remediation datacollection necessary for WMA 10) or goal-specific (e.g., complete buried infrastructure inventoryfor the WVDP premises). In either case, any task order requiring field data collection will beaccompanied by a field sampling plan (FSP). Field sampling plans will provide details aboutRev. 1 15
WVDP Phase 1 CSAPmethods, technologies, and protocols to be used, referencing standard operating procedures(SOPs) as appropriate.Radiological work permits will be prepared as necessary and approved by the RadiologicalControl Manager or his or her designee in accordance with applicable DOE procedures. Personsworking in areas covered by radiological work permits will be briefed before starting work inaccordance with DOE procedures. Training of project personnel will be commensurate with theirexperience, their responsibilities, and the potential hazards to which they could be exposed.Records will be maintained showing the employee’s name, training date, type of training receivedand other relevant information. Training requirements will be consistent with those identified inSection 8.3 of the Phase 1 DP.Rev. 1 16
WVDP Phase 1 CSAP4.0 HISTORICAL AERIAL PHOTOGRAPHY ANALYSISA comprehensive historical aerial photography analysis has been completed by the U.S. ArmyGeospatial Center (AGC 2009). As part of this review, the AGC obtained and reviewed historicalaerial photographs of the WVDP premises from 1962 to 2007. The AGC report provides asummary of their analyses and conclusions. The aerial photographs that were obtained and georeferencedby the AGC were used to assist in developing the WMA-specific data collectionrequirements. In particular, historical aerial photographs were used in the development of thisCSAP to identify areas of historic concern from the perspective of environmental contaminationrelease and transport. The WMA-specific aerial photography reviews and conclusions aredescribed in greater detail in the CSAP appendices, which contain WMA-specific data collectionrecommendations.Rev. 1 17
WVDP Phase 1 CSAPThis page intentionally left blank.Rev. 1 18
WVDP Phase 1 CSAP5.0 BURIED INFRASTRUCTURE INVENTORYThe current site contractor, West Valley Environmental Services (WVES), along with itssupporting contractors, maintains a partial inventory of buried infrastructure in tabular, hardcopy,and electronic AutoCad formats. This inventory is primarily intended to support safedig/maintenance activities at the WVDP. The quality of the existing inventory ranges from“excellent” for specific locations where recent activities have required a detailed knowledge ofburied infrastructure footprints, to “poor” for areas where there has not been a need for thisinformation.Understanding where buried infrastructure exists, its original purpose, and the contaminationstatus of adjacent subsurface soils is important to the success of Phase 1 decommissioningactivities and a necessary input for Phase 2 decision-making. As part of the Phase 1decommissioning process, facilities will be removed and contaminated soils will be excavatedand shipped to an off-site disposal facility. In some cases, these soil excavations will coverseveral acres, extend to significant depths, and intersect buried infrastructure. In addition, therewill be intrusive subsurface sampling in the vicinity of WVDP facilities, as specified in theWMA-specific appendices to this CSAP. Buried infrastructure affects this characterization workfrom the perspective of safety, and also, in some cases, contamination is expected to be associatedwith buried infrastructure because of leaks, preferential flow, or the use of contaminated surfacesoils as backfill when buried infrastructure was installed.One CSAP objective is to develop a complete electronic inventory (including an integratedelectronic map) of buried infrastructure at the WVDP. This inventory will be used to supportPhase 1 subsurface characterization activities on the WVDP premises and Phase 2 decisionmaking.The products of buried infrastructure inventory activities will include the following: (1)an inventory (in a spreadsheet or database format) identifying the buried infrastructure, itspurpose, date of installation, depth, whether it is active or abandoned, and the quality of locationinformation; (2) an accompanying report that summarizes the inventory work and identifiesremaining data gaps; and (3) an electronic map in both AutoCad and ArcGIS format (either shapefile or geodatabase, with coordinates in State Plane feet, New York NAD 1983 that depicts thefootprints of buried infrastructure that have been identified and cataloged by the buriedRev. 1 19
WVDP Phase 1 CSAPinfrastructure inventory activities. Each record in the inventory will have a unique identifierlinked to electronic map features.As part of buried infrastructure inventory activities, the CSAP contractor will review, organize,integrate, and complete (as necessary) buried infrastructure records maintained by the current sitecontractor. The CSAP contractor will work closely with the current site contractor to gain accessto the necessary drawings (hardcopy and electronic) and the facility itself. At the conclusion ofthis activity, the CSAP contractor will have developed a buried infrastructure inventory andcorresponding maps to the extent currently available information allows, and will havedetermined the data gaps in the inventory regarding the presence, location, and depth of buriedinfrastructure.The CSAP contractor will identify additional primary data collection activities to resolve the datagaps in the inventory, as deemed practicable. These activities may include (but are not limited to)traces of buried lines and non-intrusive geophysical surveys, as appropriate. All field workinvolving the determination of buried infrastructure footprints will include civil survey controlconsistent with accepted industry standards for this type of work.DOE or its contractors will maintain the buried infrastructure inventory over the life span ofPhase 1 and any Phase 2 activities, updating the inventory as new infrastructure is installed,existing infrastructure is removed (by maintenance or remediation activities), or new data becomeavailable about the existence, location, and/or contamination status of buried infrastructure. Anexample of the latter would occur as CSAP intrusive data collection and Phase 1 remediationactivities proceed and buried infrastructure is encountered and documented.Rev. 1 20
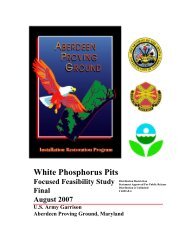
WVDP Phase 1 CSAP6.0 PRE-REMEDIATION DATA COLLECTIONPhase 1 pre-remediation data collection within each of the WMAs will address the CSAPobjectives presented in Section 2.1. Not all of those objectives are pertinent to all WMAs. Inaddition, certain WMAs have very specific characterization data requirements. For example,geotechnical information is required for soils within WMA 1 and WMA 2 to support the designof the barrier walls required for those excavations.Collection of historical environmental data has been conducted to characterize the nature andextent of contamination impacts within the WVDP premises. In addition, routine environmentalcompliance monitoring data are collected on a regular basis. The Phase 1 DP provides a generaldescription of historical radiological data collection activities in Section 4.2. The CSAPappendices describe historical data results pertinent to the radiological contamination status oftheir specific WMAs. Pre-remediation data collection as described in general by the followingsection and in more detail in the appendices is intended to fill data gaps in historical data.The following subsections describe the overall sampling strategies that will be used to address thepre-remediation CSAP objectives contained in Section 2.1. WMA-specific details about theimplementation of these strategies and the resulting pre-remediation data collection requirementscan be found in the CSAP appendices.6.1 Evaluate Appropriateness of the Current List of Radionuclides of InterestThe Phase 1 DP identified 18 ROIs (Table 1) based on a review of historical activities on theWVDP premises. To date, there are no soil samples within the WVDP Electronic <strong>Laboratory</strong>Information Management System (ELIMS) database that have results for all 18 ROI.A total of 13 subsurface soil samples (all collected in 1998) from three locations were analyzedfor all ROIs except the uranium isotopes. Figure 2 shows the locations of these samples; all of thesamples were collected from the area potentially affected by the 1968 subsurface contaminationrelease beneath the Process Building, immediately down-gradient from the release point. Table 2provides the radionuclide results of these samples. Sr-90 was observed in all samples and rangedup to 8,000 pCi/g. Eleven of the 13 samples exceeded the subsurface CG w for Sr-90. In contrast,Rev. 1 21
WVDP Phase 1 CSAPnone of the other ROI exceeded their subsurface CG w . For the other 13 ROIs with results, onlyone sample had an ROI activity concentration that was close to its CG w . The ROI was I-129 withan activity concentration that was 44% of its CG w ; however, the Sr-90 activity concentration forthat same sample was more than an order of magnitude higher than its CG w . On the basis of thisvery limited data set (i.e., samples from one specific location fairly close to the original ProcessBuilding subsurface release point), the subsurface SOR calculation is dominated by Sr-90.In contrast, 27 soil samples were explicitly identified in ELIMS as surface samples with bothCs-137 and Sr-90 results. Figure 3 shows the locations of these samples, color-coded by theirrespective CG w SOR values, using only Cs-137 and Sr-90 results as the basis for the SORcalculation. Figure 4 shows the samples with SOR values greater than 0.1. In Figure 4, locationsare color-coded by whether Cs-137 or Sr-90 dominated the SOR calculation.These limited data suggest the following: (1) Cs-137 and Sr-90 are likely the radionuclides thatwill dominate SOR values in areas of contamination, and (2) which of these two isotopes is moresignificant will vary from location to location, presumably because of different contaminantrelease histories and their differing environmental transport characteristics.CSAP data collection will be used to determine the set of radionuclides of concern for eachWMA. Samples will be collected from each of the WMAs and analyzed for all 18 ROIs. Thesesamples will be selected to ensure proper coverage of soil/sediment types and potentialcontaminant release scenarios that may be present within a specific WMA. Sample results fromeach WMA will be reviewed to determine the contribution of each radionuclide to the SORvalues. ROIs that will be carried forward into the remedial design and the Phase 1 FSS processfor a specific WMA will be radionuclides that either contribute more than 10% to the SOR valuewhen an SOR values exceeds unity or are present at levels above their CG w value. At a minimum,the set of WMA-specific radionuclides will always contain Cs-137 and Sr-90. In the event thatradionuclides are dropped for a specific WMA for Phase 1 FSS purposes, the SOR requirementwill be reduced to reflect the average dose contribution for the missing radionuclides as describedin the Phase 1 Final Status Survey Plan.Rev. 1 22
WVDP Phase 1 CSAPFigure 2 Locations of Subsurface Samples with ROI Results (except UraniumIsotopes)Rev. 1 23
WVDP Phase 1 CSAPTable 2: ROI Sample Results from Three Locations (pCi/g)Location GP86 GP78 GP30From (ft) 20 24 30 34 21 23 29 33 20 22 22 30 36To (ft) 22 26 32 36 23 25 31 35 22 24 24 32 36.5Units pCi/g pCi/g pCi/g pCi/g pCi/g pCi/g pCi/g pCi/g pCi/g pCi/g pCi/g pCi/g pCi/gAm-241 0.016(J)0.015(J)0.015(J)0.005(UJ)0.015(J)0.037(J)0.017(J)0.000(UJ)0.018(J)0.009(UJ)0.008(UJ)-0.010(UJ)-0.002(UJ)C-14 -0.040(UJ)-0.085(UJ)-0.105(UJ)-0.077(UJ)0.042(UJ)0.047(UJ)-0.121(UJ)-0.072(UJ)-0.068(UJ)-0.007(UJ)-0.038(UJ)-0.057(UJ)-0.061(UJ)Cm-243/244 0.012(UJ)0.009(J)0.009(UJ)0.003(UJ)0.003(UJ)0.015(J)0.009(UJ)0.004(UJ)0.008(J)0.002(UJ)0.011(U)-0.007(UJ)0.010(J)Cs-1370.014 0.037 0.015 0.050 0.024 0.038 -0.010 0.002 0.040 0.032 -0.003 -0.0070.107(UJ) (UJ) (UJ) (J) (UJ) (UJ) (UJ) (UJ) (UJ) (UJ) (UJ) (UJ)I-129 0.591(UJ)-2.100(UJ)0.417(UJ)-0.424(UJ)-0.130(UJ)-0.792(UJ)0.450(UJ)0.076(UJ)0.982(UJ)-1.270(UJ)1.490(UJ)0.927(UJ)0.014(UJ)Np-237 0.002(UJ)0.033(J)0.009(UJ)-0.007(UJ)-0.002(UJ)0.003(UJ)0.007(UJ)0.013(UJ)0.028(J)0.001(UJ)0.018(UJ)-0.003(UJ)0.004(UJ)Pu-238 0.012(UJ)0.009(UJ)0.002(UJ)0.011(UJ)-0.001(UJ)0.004(UJ)0.005(UJ)0.003(UJ)0.019(J)0.004(UJ)0.005(UJ)-0.004(UJ)0.007(UJ)Pu-239/240 0.014(J)0.010(UJ)0.005(UJ)0.009(UJ)0.007(UJ)0.006(UJ)0.005(UJ)0.003(UJ)0.016(J)0.002(UJ)0.005(UJ)0.004(UJ)-0.004(UJ)Pu-241 0.819(UJ)0.171(UJ)-0.676(UJ)1.020(UJ)-1.250(UJ)-0.525(UJ)0.577(UJ)-1.580(UJ)-0.155(UJ)-0.792(UJ)0.188(UJ)-4.570(J)-0.077(UJ)Sr-90 4,230 3,100 2,910 736 8,000 4,130 561 21.8 2,840 1,020 3,080 787 5.63Tc-99 -0.498(UJ)-0.218(UJ)-0.568(UJ)-0.611(UJ)0.074(UJ)-0.005(UJ)-0.468(UJ)-0.542(UJ)-0.239(UJ)-0.245(UJ)-0.427(UJ)-0.474(UJ)-0.634(UJ)U-232 NA NA NA NA NA NA NA NA NA NA NA NA NAU-233 NA NA NA NA NA NA NA NA NA NA NA NA NAU-234 NA NA NA NA NA NA NA NA NA NA NA NA NAU-235 NA NA NA NA NA NA NA NA NA NA NA NA NAU-238 NA NA NA NA NA NA NA NA NA NA NA NA NANotes:NA = not available.U = below detection limits.J = estimated value.Rev. 1 24
WVDP Phase 1 CSAPFigure 3 Surface Soil Samples with Both Cs-137 and Sr-90 ResultsRev. 1 25
WVDP Phase 1 CSAPFigure 4 Surface Soil Samples with SOR > 0.1Rev. 1 26
WVDP Phase 1 CSAP6.2 Verify Absence of Additional ROIIn addition to the 18 ROIs contained in the Phase 1 DP, another 12 radionuclides have beenidentified as potentially being of interest; these 12 potential ROIs are listed in Table 3. Theidentification process relied on historical process knowledge; to date none of these 12 has beenobserved in historical samples at levels that would be of dose concern and the belief is that it isunlikely that any of these 12 exist at significant levels in environmental media. Several of the 12have short half-lives relative to the history of WVDP/Nuclear Fuel Services, Inc. (NFS) activities;others would have had very low abundance within the spent fuel that would have been processedat the site, compared to Cs-137 and Sr-90.CSAP data collection will provide supporting data to determine whether any of these 12radionuclides should be of interest. A subset of CSAP samples will be analyzed for theseadditional 12 radionuclides. This subset will focus on samples from WMAs and settings in whichthey would most likely be encountered, if environmental releases at detectable levels hadoccurred. The WMAs of primary interest include WMA 1, 2, 3, 5, 6, 7, and 9. Example settingsof particular interest include elevated areas identified by gross gamma scans that might beindicative of discrete releases, buried infrastructure where associated soil contamination is likelypresent, areas of known environmental releases, and so on.In the cases of WMA 1 and WMA 2, because of the relatively higher and more pervasivecontamination levels expected, in addition to the analysis of biased samples for the 12radionuclides listed in Table 3, 10% of all other soil samples will be analyzed for the completesuite of 30 radionuclides.When soil samples are collected, sufficient soil mass will be obtained to allow for an analysis ofall 30 radionuclides (i.e., the 18 ROIs plus the 12 potential ROIs). For any particular WMA, if ananalysis of a sample for the 12 potential ROIs identifies one or more present at levels that wouldbe considered potentially significant, the balance of the samples from that WMA will also beanalyzed for the radionuclide(s) identified as occurring at levels of potential significance.“Potentially significant” is defined to be a radionuclide that is detectable, exceeds the 95% UTL(upper tolerance level) value for background, and occurs when the SOR value for the sample(based on the 18 ROI) is less than one.Rev. 1 27
WVDP Phase 1 CSAPTable 3: Twelve Radionuclides of Potential InterestRadionuclideYes/NoNaturally OccurringHalf Life(years)Typical SoilBackgroundActivityConcentrations(pCi/g)Required<strong>Laboratory</strong>Sensitivity(pCi/g)Ac-227 Yes 21.8 ~ 0.05 0.1Co-60 No 5.3 Not applicable –Cd-113m No 14.1 Not applicable –Eu-154 No 8.6 Not applicable –H-3 Yes 12.3 NegligiblequantitiesPa-231 Yes 32,760 ~ 0.05 0.1Ra-226 Yes 1,602 ~ 1 0.1Ra-228 Yes 5.8 ~ 1 0.1Sb-125 No 2.8 Not applicable –Sn-126 No 12.4 Not applicable –Th-229 No 7,340 Not applicable –Th-232 Yes 1.4E10 ~ 1 0.1–6.3 Explore the Possibility of Surrogate ROIsA surrogate radionuclide is a radionuclide that is consistently present in a predictable ratiowhenever contamination is at levels of concern. If such a ROI is identifiable, it may be used as asurrogate for the other radionuclides during remediation and the FSS process. Typically, amodified CG is calculated for the surrogate ROI so that as long as the surrogate is less than themodified CG, one can be confident that if the sample is analyzed for all the ROIs, the resultingSOR value would be less than unity.The data presented in Section 6.1 suggest that it is unlikely that a surrogate ROI can be found thatwould be applicable across the WVDP premises. CSAP data collection is expected to confirmthat this is the case. There will be no CSAP data collection specific to this goal; instead, CSAPRev. 1 28
WVDP Phase 1 CSAPdata collected to support the other goals will be used to explore the possibility of a surrogate ROI.Note that almost all CSAP soil samples will be analyzed for all 18 ROIs.6.4 Establish Background Data SetsThe Phase 1 DP presented background activity concentrations for surface and subsurface soilsbased on historical sampling. These background data are sufficient for establishing a generalsense of background activity concentrations for surface and subsurface soils for the 18 ROIs.However, they do not provide information regarding the background levels of the 12 potentialROIs, nor do they address the background level of gross activity that might be encountered duringsurface scans, nor do they establish a background data set sufficient for conducting statistical testssuch as the Wilcoxon Rank Sum (WRS) test that may be required by the Phase 1 FSS process.CSAP data collection will establish background values including both average conditions andbackground variability for gross gamma activity and for radionuclide-specific activityconcentrations for surface soils through the use of a reference area. Section 8 discusses theestablishment of a reference area and associated data collection in greater detail. Section 11.5provides details about protocols for establishing background gross gamma activities for surfacesoil scans.6.5 Determine Extent of Surface Soil ContaminationSurface contamination is defined as radionuclide contamination above background levels withinthe 0- to 1-m depth profile. In the case of surface soils covered with concrete slabs, pavement,asphalt, gravel, hardstand material, and the like, the start of the 0-to 1-m-depth profile is definedas the interface between the overlying cover material and the underlying soil surface. In the caseof areas where some surface soil removal is expected to take place as part of Phase 1 activities(outside of the WMA 1 and WMA 2 deep excavations), the start of the 0- to 1-m-depth profile isdefined as the exposed soil surface that remains after the initial removal has taken place. As anexample, when building slabs are removed, it is expected that as much as 60 cm of soilimmediately underlying the slab will be removed as well. In some cases, such as hardstands, theoverlying cover material may be more than 1-m thick. Phase 1 DP activities will remove existingcover material (building slabs, hardstands, and so on) in many of the WMAs.Rev. 1 29
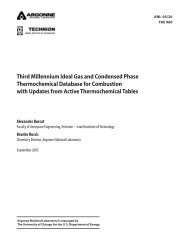
WVDP Phase 1 CSAPCSAP data collection will establish the extent of surface soil contamination above surface soilCG w values within the WVDP premises. The strategy for establishing surface soil contaminationextent has the following components:• Initial conceptual site models will be established for each of the WMAs that identify,based on existing information, areas within WMAs where surface contamination issuspected to be present. The appendices to the CSAP provide initial conceptual sitemodels for each of the WMAs.• A complete, logged gamma walkover survey (GWS) will be conducted for accessiblesurfaces for the WVDP premises. Section 11 describes GWS protocols in greater detail.The goal is to have a data density of at least one measurement per square meter (m 2 ) withan acquisition time of one second using one or more sodium iodide (NaI) detectors.Based on process knowledge and the limited surface soil samples available, it is expectedthat surface soil contamination above surface soil CG w values will always beaccompanied by Cs-137 elevated at levels detectable via a GWS. The GWS data will beused to further refine WMA-specific initial conceptual site models. In particular, GWSdata will be used to identify areas where GWS results indicate surface contaminationlikely exceeds CG w requirements; areas where contamination impacts exist, but it is veryunlikely surface contamination exceeds CG w requirements; areas that appear un-affectedby contamination; and areas where the GWS data are inconclusive. For the WVDP Phase1 process, the first two are analogous to Multi-Agency Radiation Survey and <strong>Site</strong>Investigation Manual (MARSSIM) Class 1 and Class 2 areas, respectively. Figure 5provides a flowchart for decision-making based on GWS data results. The followingbullets further elaborate on the steps shown in Figure 5.• Areas where GWS data clearly indicate surface contamination exists above CG wrequirements will have limited sampling conducted to confirm GWS findings. Thissampling will typically target the highest gross activity levels encountered. Soil sampleswill be collected representative of both the 0- to 15-cm interval and the 15-cm to 1-minterval. Sampling may also take place to confirm the boundaries of contamination aboveCG w requirements if this is not obvious from GWS data.Rev. 1 30
WVDP Phase 1 CSAPConduct GWSSurveyDoGWSData IndicateLocalizedHot SpotConcerns?YesBias SampleHot SpotNoDoGWS DataIndicate > CGConditions?YesBias Sample HighestLocation and BoundariesNoDoGWS DataIndicate PossibleCG Exceedancess?YesNoSample Area of InterestSystematicallyDoGWS DataIndicate Impacts< CG?YesNoFlag Area as PotentiallyReady for FSS SamplingFigure 5 Flowchart Showing Decision-Making ProcessBased on GWS Data CollectionRev. 1 31
WVDP Phase 1 CSAP• In areas where GWS data indicate surface soil impacts but at levels unlikely to exceedsurface soil CG w requirements, surface soil samples will be collected to document surfacesoil activity levels. Systematic sampling will typically be conducted on a triangular gridwith a grid spacing of 20 m.• Areas where GWS data indicate background conditions in surface soils and there are nosubsurface contamination concerns will be flagged as potentially ready for Phase 1 FSSdata collection. It is likely that no additional surface soil samples will be collected fromthese areas as part of CSAP efforts unless there is a specific need identified; sampling forFSS purposes may take place separate from CSAP activities during Phase 1, or FSSsampling may be deferred until Phase 2.• Areas where GWS data are inconclusive regarding the contamination status of surfacesoils relative to surface soil CG w requirements will be systematically sampled. Examplesare transition zones between soils clearly above CG w requirements and soils clearlybelow CG w requirements and areas where surface cover limits the utility of GWS data,such as paved areas and areas where surface soils have been reworked or covered. Theseareas will be systematically sampled to evaluate their contamination status. Systematicsampling will typically be conducted on a triangular grid with a grid spacing of 20 m.This will result in approximately five sampling locations per 2,000-m 2 area, the minimumnumber needed to perform a statistical evaluation of the resulting data. A 2,000-m 2 area isthe maximum size of a MARSSIM Class 1 survey unit. In this case, soil samples will becollected in a manner consistent with FSS protocols. The expectation is that these datawill indicate an area that either likely meets FSS requirements or does not. In the formercase, the area will be flagged as ready for Phase 1 FSS data collection and the dataevaluated to determine whether the data sets are sufficient to statistically establish surfacesoil CG w compliance. If not, then additional Phase 1 FSS sampling will take place duringPhase 1 FSS data collection to statistically establish compliance with surface soil CG wrequirements.• For some WMAs, there will likely be wetland areas with standing water or saturated soilconditions where a GWS is not appropriate. In these areas systematic soil sampling willbe conducted instead. In general, this sampling will consist of collecting at surface soilsamples representative of the top 0- to 15-cm depth from the wetland area. For wetlandRev. 1 32
WVDP Phase 1 CSAPareas less than 200 m 2 in size, one sample will be collected. For areas between 200 and1,000 m 2 in size, one sample per 200 m 2 will be collected. For areas between 1,000 and2,500 m 2 in size, five samples will be collected. For areas exceeding 2,500 m 2 in size, atminimum one sample will be collected per 500-m 2 area.• Sufficient soil mass will be collected to allow for the analysis of all 18 ROIs and 12potential ROIs; however, initial soil screening may focus on Cs-137 and Sr-90 ifevidence for the area of interest indicates that these are the only radionuclides ofsignificance from an SOR perspective. If the systematic soil sample soil screeningindicates the area likely meets surface soil CG w requirements, the 18 ROIs would beanalyzed to provide FSS-quality data sets.• If systematic surface soil sampling indicates that contamination exists above surface soilCG w requirements, soil sampling will be extended laterally until contamination isbounded spatially, if boundaries are not obvious from GWS data. If systematic surfacesoil sampling indicates contamination exists above background levels but below CG wrequirements, the lateral extent of systematic sampling may be extended until surfaceimpact extent is bounded.• In general (with the exception of sampling from wetlands in response to GWSinaccessibility), two samples will be collected from each location, one representative of a0- to 15-cm depth, and one representative of a 15-cm to 1-m depth. The purpose of the 0-to 15-cm sample is address the concern that elevated contamination levels might belimited to the immediate surface and exist at levels that would cause direct exposure doseissues, but that would be diluted by a 0- to 1-m depth sampling protocol. The purpose ofthe 15-cm to 1-m depth sample is to provide data that can be combined with data fromthe 0- to 15-cm interval to construct activity concentrations representative of andcomparable to the surface soil CG w definition. The exceptions to the two-sample-perlocationrequirement are areas where there is no evidence of historical surface soildisruption and no reason to be concerned about subsurface soil contamination. Anexample of this type of area would be portions of WMAs 4, 10, and 12. In these cases,CSAP surface soil sampling may be limited to only the top 0-to 15-cm depth interval.However, if only a 0- to 15-cm sample is collected at a location and the results of thatRev. 1 33
WVDP Phase 1 CSAPsample indicate contamination impacts above background levels, then a 15 cm – 1 msample will also be collected and analyzed from that location.• For the majority of drainage features/ditches within the WVDP premises, the surface soilCG requirements apply. The exceptions to this are well-defined portions of ErdmanBrook and Franks Creek within the WVDP premises; for these well-defined portions,sediment CG requirements apply. When there is a concern about potential ditchcontamination, because of either GWS results or historical process knowledge, ditchsediments will be sampled systematically. In general, these samples will be representativeof the 0- to 15-cm depth interval and will be on a 30-m linear grid. The primary reasonfor this spacing is that if a generic ditch footprint is defined as having a width of 3 m, a30-m sampling grid spacing results in one sample per approximately 100 m 2 , whichcorresponds to an area equivalent to a stationary external dose scenario. If a ditch samplehas results that indicate contamination impacts above background levels, then a 15-cm to1-m sample will also be collected and analyzed from that location.• Characterization of surface soils beneath hardstands may be deferred until afterhardstands are removed as part of Phase 1 DP activities to facilitate access to exposedsoil surfaces.6.6 Identify the Presence/Absence of Subsurface Soil ContaminationSubsurface soil contamination is defined as contamination impacts that exist deeper than thesurface soil definition (i.e., deeper than 1 m). There are areas of the WVDP premises wherecontamination at depth is known to exist. In some cases this deep contamination will be addressedby Phase 1 decommissioning activities (e.g., the WMA 1 and WMA 2 excavations). In othercases known deep contamination has been identified as a Phase 2 concern (e.g., the North PlateauGroundwater Plume extending beneath WMA 2 and WMA 4). However, there are other areas ofthe WVDP premises where subsurface soil contamination is known to exist but the extent isunknown (e.g., the buried outfall ditch present in WMA 6) or where subsurface soilcontamination is suspected to exist (e.g., portions of WMA 3 and the northern portion of WMA6).Rev. 1 34
WVDP Phase 1 CSAPUnderstanding where subsurface soil contamination is present and its extent is important for thefollowing reasons. First, outside of the WMA 1 and WMA 2 excavations, Phase 1 FSS protocolscan be applied only to surface soils where there is confidence that deep or subsurfacecontamination is not present. Second, Phase 2 decision-making requires knowledge of the natureand extent of subsurface soil contamination. With the exception of the North PlateauGroundwater Plume in the North Plateau, data on the nature and extent of subsurface soilcontamination within the WVPD premises are very limited.Subsurface contamination has several potential sources. The first is contamination resulting fromthe presence of buried infrastructure. In this case, contamination at depth could have resultedfrom leaking infrastructure that carried contaminated waste, from the use of contaminated soils asbackfill when infrastructure was installed (particularly pertinent to infrastructure installed afterthe 1968 releases from the Process Building main stack that resulted in surface soil contaminationassociated with the cesium prong), and from the potentially preferential flow pathways buriedinfrastructure provides to contaminated groundwater. A second source is contamination that wasburied by WVDP/NFS activities. A prime example is the original outfall ditch in WMA 6 thatwas covered to control exposure to contaminated sediments. A third source is the migration ofcontaminated groundwater through the subsurface. The principal example of this is the subsurfacecontamination that currently exists beneath portions of WMA 2 and WMA 4 resulting from therelease of contaminated liquids beneath the Processing Building in WMA 1.CSAP data collection will verify the presence/absence of subsurface soil contamination where itis considered a potential concern, and will provide data to determine its extent when it isencountered. The strategy for investigating subsurface soil contamination has the followingcomponents:• Initial conceptual site models will be established for each of the WMAs that identify,based on existing information, areas within WMAs where subsurface contamination issuspected to be present. The appendices to the CSAP provide initial conceptual sitemodels for each of the WMAs. Historical information pertinent to these initial conceptualsite models include the presence/absence of buried infrastructure, evidence of surface soildisturbance in historical aerial photographs, anecdotal evidence of releases that may haveresulted in subsurface soil contamination, and subsurface soil and groundwater data setsthat contain radionuclide results.Rev. 1 35
WVDP Phase 1 CSAP• Buried infrastructure will be mapped in each WMA (see Sections 5 and 6.12 for moredetails). Particular attention will be paid to buried infrastructure that may have carriedcontaminated liquids and to infrastructure that was installed after 1968. The former is ofconcern from the perspective of a subsurface release, and the latter from the perspectiveof the use of contaminated soils as backfill. Portions of these infrastructure footprints willbe excavated and the adjacent soils screened for the presence of contamination. Ingeneral, for buried infrastructure that carried waste or waste water, the focus will be onsoils immediately beneath the line. For buried infrastructure that did not carry waste orwaste water but was installed after 1968, the focus will be on soils immediately above theline that would be representative of backfill.Characterization of soils adjacent to buried infrastructure will be done by using trenchingtechniques. For buried infrastructure that is active or that potentially contains radioactivecontamination inside, special care will be taken to not compromise the integrity of theinfrastructure.The length, width, and depth of trenches will be dependent on the depth of the buriedinfrastructure that is of interest and the degree of confidence that its location is known.Soils removed while trenching will be staged adjacent to the trench operation andreplaced when the trenching and soil characterization work at a particular location iscomplete to minimize the volume of investigation-derived waste.Gross gamma detectors will be used to assist in the selection of subsurface soil samplesassociated with buried infrastructure that represent potential contamination impactconcerns. Infrastructure that has the potential for radioactive contamination in the lineposes shine concerns for gross gamma detectors once the line is exposed. The possibilityof shine effects will be monitored as necessary and appropriate mitigating actions taken ifnecessary. Examples of actions include collimating the detector being used.• Biased sampling will target WMA-specific features where subsurface contamination issuspected to be present. Areas immediately outside the planned WMA 1 and WMA 2deep excavations are an example (see Section 6.8 for additional details) as is the buriedoriginal outfall ditch in WMA 6 and the original Old Hardstand drainage features inRev. 1 36
WVDP Phase 1 CSAPWMA 5. In some cases, subsurface sampling will be conducted by scanning subsurfacesoil cores or borings. In other cases, where buried linear features are suspected, soiltrenching combined with soil screening will be used.• When soil cores are used for sample collection (either specifically for subsurfacecontamination characterization or as part of surface soil characterization work), a downholegamma scan will be conducted by using an appropriate NaI detector (e.g., a 1 in. × 1in. NaI detector with shielding to control gamma flux through the top and bottom of thedetector). Biased samples will be collected from specific subsurface soil intervals thatexhibit the most elevated gross activity levels based on the down-hole gamma scan data.• For locations where systematic or biased surface soil samples are collected, if a 15-cm to1-m soil sample identifies contamination above background levels, then an additionalsample will be collected from the next 1-m-deep interval (i.e., 1 to 2 m) and evaluated todetermine the presence or absence of contamination at depth above backgroundconcentrations. If contamination is encountered in this deeper interval, then samplingmay continue at depth until contamination is bounded vertically.• For locations where systematic or biased subsurface soil samples indicate contaminationis present above background levels, additional sampling locations may be selected tolaterally bound subsurface contamination. The decision to laterally bound contaminationand the sample spacing/configuration required will be location/situation-specific, and willtake into account the original release mechanism, the types of radionuclides encountered,and the levels observed.• In some areas of the WVDP premises, the combination of surface contamination presentpre-WVDP combined with extensive surface reworking by WVDP activities raisesgeneric subsurface soil contamination concerns over larger areas. Examples of thisinclude portions of WMA 5, WMA 3, and WMA 2. In these cases, systematic subsurfacesampling will be conducted with a subsurface core spacing of 20 m. The typical initialdepth of evaluation will be 2 m. This sampling will be coordinated with systematicsurface soil sampling described in Section 6.5.Rev. 1 37
WVDP Phase 1 CSAP• In all cases, the initial soil samples from a location will be analyzed for all 18 ROIs. Inselected cases, samples will also be analyzed for the additional 12 potential ROIs (seeSection 6.2 for a description of which samples would be selected for analysis of theadditional 12 potential ROIs). If initial analyses indicate that only a limited set ofradionuclides are present, then subsequent sample analyses used to vertically or laterallybound contamination will be limited to those radionuclides originally identified as beingabove background conditions.• Characterization of subsurface soils beneath hardstands may be deferred until afterhardstands are removed as part of Phase 1 DP activities to facilitate access to subsurfacesoils.6.7 Determine Level and Extent of Sediment ContaminationThe Phase 1 DP defines CG requirements for sediments. These requirements are applicable tospecific reaches of Erdman Brook and Franks Creek as identified in Figure 6. All other sedimentsassociated with drainage features on the WVDP premises will be subject to surface soil CGrequirements.CSAP data collection from Erdman Brook and Franks Creek sediments will be used to evaluatethe presence and extent of sediment contamination that exceed sediment CG requirements. Thissampling is confined to to the specific reaches of Erdman Brook and Franks Creek as identified inFigure 6. The strategy has two basic components:• GWS data will be collected from the reaches of concern as practicable. Biased sedimentsampling will occur in response to the identification of anomalies in the GWS data.Biased sampling will consist of samples from the surface to a depth of 15 cm that targetthe highest gross activity readings. In the event that a sample identifies contaminationimpacts above background levels, a second sample from the same location representing adepth of 15 cm to 1 m will be analyzed. In the event that sample identifies contaminationimpacts above background, a third sample from the same location representing a depth of1 to 2 m will be analyzed. This process will continue until contamination impacts abovebackground conditions are vertically bounded.Rev. 1 38
WVDP Phase 1 CSAPFigure 6 Erdman Brook and Franks Creek SectionsWhere Sediment CG Requirements ApplyRev. 1 39
WVDP Phase 1 CSAPOne sample will be selected downstream from the confluence of Erdman Brook andFranks Creek, but within the WVDP premises, that is expected, based on GWS results, torepresent the heaviest sediment contamination. This sample will represent a depth of 0 –15 cm and will be analyzed for the 18 ROIs plus the 12 potential ROIs.• Systematic sampling locations will be distributed along Erdman Brook and Franks Creekfor those portions where the sediment CG requirements apply and there is a possibility ofcontamination exceeding sediment CG w requirements. Systematic samples will becollected from the stream center-line. A minimum of three sample locations will beidentified for each portion of the creeks that meet the above criteria, with a systematicsample location spacing of 30 m. Based on current information, only a portion of ErdmanBrook is expected to require this sampling (see Appendix J). Samples will berepresentative of the 0- to 15-cm depth interval under the assumption that ifcontamination is present, it is most likely confined to surface sediments. The sampleresults will be used to determine whether sediment contamination potentially exceedssediment CG w requirements. If any sample yields results above background conditions, asecond sample will be analyzed from that location representative of a 15-cm to 1-m depthinterval. If that sample yields a result above background conditions, a third sample willbe analyzed representative of a 1- to 2-m depth interval. This process will continue untilthe vertical extent of contamination impacts above background is bounded.• Biased and systematic samples will be analyzed for all 18 ROIs. Biased samples will alsobe analyzed for the 12 potential ROIs. If any of these 12 is present at potentiallysignificant levels, the balance of sediment samples will also be analyzed for thoseradionuclides of potential interest that were observed at potentially significant levels.6.8 Define Required Extent of WMA 1 and 2 ExcavationsTwo deep, extensive excavations are planned for WMA 1 and WMA 2 as part of Phase 1decommissioning activities. The excavations will extend, at minimum, 1 ft into the underlyingLavery Till. The lateral extent is to some degree fixed by structure constraints. A minimum extentis required to safely remove buried foundations associated with the Process Building. Likewise,the footprint and layout of the lagoons establish the minimum requirements for the WMA 2excavation. The maximum extent is also physically constrained in some instances. For example,Rev. 1 40
WVDP Phase 1 CSAPthe northern wall of the WMA 1 excavation cannot compromise the structural integrity of theHLW Tanks in WMA 3.Within those constraints, one goal of the two excavations is to remove subsurface contaminationthat exceeds the subsurface CG requirements derived by and contained in the Phase 1 DP.To verify that the planned excavation footprints do, in fact, address subsurface contaminationabove CG w requirements, subsurface sampling will take place along the planned footprintboundaries for WMA 1 and WMA 2. The sampling strategy defining the lateral extent of theWMA 1 and WMA 2 excavations has the following components:• Continuous soil cores will be collected with a spacing of 10 m for locations along sheetpile wall footprints and 20 m for locations along slurry wall footprints, with intact soilcores retrieved. Soil cores will include at least 1 m of the underlying Lavery Till. Thereason for the 10 m spacing along sheet pile wall footprints is to provide a reasonableprobability that contamination with a significant subsurface spatial extent is identified.“Significant extent” is defined as subsurface contamination that may extend more than 10m beyond the proposed excavation footprints; the assumption is that if this is the case, thecontamination would have extended along the excavation boundary at least as long. In thecase of slurry walls, contamination is assumed to be present on the side opposite theexcavation; in this case the spacing is driven by geotechnical design needs for those walls(e.g., depth to till). For both sheet pile and slurry walls, the proposed spacing may bemodified in response to field conditions if those are different from initial assumptions.For example, in the case of the slurry wall, if significant variation in the depth to theLavery Till was found from core location to core location, the spacing might be reducedto better capture the variations in Lavery Till depth.• For each core location from sheet pile wall footprints and from the southern boundary ofthe WMA 2 excavation, a down-hole gamma scan will be performed with an appropriateNaI detector to the extent practicable. Each hole will extend beneath the water table;consequently, usable down-hole gamma scan data will likely not be available for the fulldepth of the core. Each core will also be scanned ex situ for gamma and gross betaactivity by using an appropriate detector.Rev. 1 41
WVDP Phase 1 CSAP• A minimum of four samples from each core will be submitted: one representing the top 1m of soil, one representing the top 1 m of Lavery Till, one representing the 1-m soilinterval immediately on top of the Lavery Till, and one representing the 1-m intervalstraddling the water table. In addition, if the down-hole or ex situ scan identifies elevatedreadings and the highest readings do not correspond to one of these four intervals, the 1-m interval representative of the highest gross activity readings will be submitted foranalysis. Since the depth to the Lavery Till varies significantly, the total depths of the soilcores will also vary significantly depending on where they are collected. If the depth totill is less than 3 m, the minimum number of samples will be adjusted accordingly. In thecase of slurry wall core locations, only two samples will be collected, one representingthe top 1 m of Lavery Till and one representing the 1-m soil interval immediately on topof the Lavery Till.The reason for collecting a sample from the top 1 m of soil is to define the extent ofsurface soil contamination. The objective of the Lavery Till sample is to understand thecontamination status of the underlying Lavery Till. The purpose of the soil samplesimmediately above the Lavery Till is to determine the presence/absence of contaminationimmediately above the Lavery Till and to have a point of comparison for Lavery Tillsample results. The rationale for the sample from the interval straddling the water table isbecause contamination migration is likely via contaminated groundwater and releasesabove the water table. Consequently, in the vicinity of releases, a likely zone to encountercontamination is in soils along the water table. The reason for the biased sample is tounderstand the maximum levels of contamination that are present if the depth of thatcontamination does not correspond to one of the other depth intervals already sampled.• Three groundwater samples will be collected from each subsurface sample location ifpossible: one from the water table, one from immediately above the Lavery Till, and onemidway between these two intervals. In general, away from source areas, activityconcentrations for affected groundwater, as measured in picocuries per liter, would besignificantly greater than activity concentrations in impacted soils at the same location, asmeasured in picocuries per gram. Consequently, groundwater activity concentrationsserve as a conservative indication of the potential for subsurface soil contamination.These data will also provide insights into the extent of subsurface groundwatercontamination.Rev. 1 42
WVDP Phase 1 CSAP• If contamination above background is identified in one or more of these locations,additional locations may be selected further from the planned excavation footprint tobound the lateral extent of subsurface contamination (groundwater or soils) in the case ofsheet pile wall footprints and the southern boundary of the WMA 2 excavation. Theseparation distance from the excavation footprint will be a location-specific decision, andwill depend on the level of contamination encountered, the type of contamination (e.g.,groundwater versus soil), and the vertical extent of contamination observed. Bounding isnot required for the slurry wall footprints; the working assumption is that subsurface soilcontamination is present on the other side of slurry walls.• If buried infrastructure of potential concern is identified that intersects the planned WMA1 or WMA 2 excavation footprints, one of the trenches used to expose the buriedinfrastructure will be along the planned excavation boundary and evaluated for thepresence of adjacent soil contamination.6.9 Identify Soil Waste Stream CharacteristicsA significant volume of soil will be removed as part of the WMA 1 and WMA 2 excavations. Allexcavated soils will be disposed of off-site regardless of the soil activity concentrations. Theradionuclide activity concentrations of these soils are expected to vary widely, from non-affectedsoils, to low-level radionuclide contamination, to heavily contaminated soils. For planningpurposes, it is important to have estimates of the various soil waste streams that will be generatedby the WMA 1 and WMA 2 excavations.CSAP data collection will support the identification and estimation of contaminated waste streamtypes. Data collection will take the form of soil sampling from soil cores that are systematicallycollected across the accessible portions of the planned WMA 1 and WMA 2 excavations. Soilcores will be obtained that extend at least 1 m into the Lavery Till. Each soil core will be dividedinto 1-m intervals, with the final sample representing the top 1 m of Lavery Till and a samplefrom each interval submitted for analyses of Cs-137 and Sr-90. For example, if there were 10 soilcores to a total depth of 10 m, this would result in 100 samples. The sample with the highest Cs-137 activity concentration from each core will also be analyzed for the other 12 potential ROIs. .Rev. 1 43
WVDP Phase 1 CSAPThe number of cores is based on the number of samples required to obtain relatively accurate soilvolume estimates. For the purposes of this analysis, “relatively accurate” for every potentialwaste stream is defined as a volume estimate error no more than 10% of the total excavatedvolume. Using this definition along with a Bernoulli trial/binomial distribution analysis indicatesa minimum of 100 systematically placed samples is required to meet this objective (e.g., 10samples from 10 soil core locations). Table 4 provides the relative volume estimation errorexpected with 100 systematic samples under different contamination probability assumptions.The “contamination probability” identified in Table 4 can be interpreted as the fraction of thetotal excavation volume that meets a particular waste stream definition. The “relative error” is theratio of the expected error associated with estimating the contamination fraction based on 100systematic samples to the expected volume of contamination. While relative errors grow ascontamination probabilities become smaller, absolute errors shrink and never exceed 10% of thetotal excavated volume if 100 systematic samples are collected.Table 4: Soil Sample Numbers for Volume EstimationVolume Error Relative toContaminationProbabilityNumber ofSamplesContaminationVolumeTotal ExcavationVolume0.50 100 0.20 0.100.40 100 0.24 0.100.30 100 0.30 0.090.20 100 0.39 0.080.10 100 0.59 0.066.10 Verify Contamination Status of Soils To Be Affected by Phase 1 Construction NeedsThere will be areas of the WVDP premises that will be used to support Phase 1 decommissioningactivities. Examples of these areas include lay-down areas that may be used for excavated soilstaging, as necessary. When these areas are identified and prior to their use in support of Phase 1decommissioning activities, the contamination status of surface soils in the areas needed tosupport Phase 1 decommissioning activities will be determined.Rev. 1 44
WVDP Phase 1 CSAPCSAP data collection will be used to determine the contamination status of surface soils in thefootprints of areas that may be used for Phase 1 construction and remediation activities. Datacollection in these areas will consist of the following:• A logged GWS of the area in question will be conducted consistent with the protocolsdescribed in Section 11. If the GWS identifies elevated areas, biased sampling will takeplace targeting the highest GWS levels. Two samples will be collected from eachlocation, one representative of the 0- to 15-cm-depth interval and one representative ofthe 15 cm to 1 m of exposed soils. Samples will be submitted for analyses of all 18 ROIsplus the additional 12 potential ROIs.• Systematic surface soil samples will be collected consistent with the protocols describedin Sections 6.10 and 10. A minimum of five sample locations will be selected for eacharea. If areas are larger than 2,000 m 2 , a triangular grid spacing of 20 m will be used.Two samples will be collected from each location, one representative of the 0- to 15-cmdepthinterval and one representative of the 15 cm to 1 m of exposed soils. Samples willbe submitted for analyses of all 18 ROIs. Consistent with Section 6.11, soil sampling atdepths greater than 1 m will take place if there are reasons to suspect that contaminationmay be present at depth or if surface sampling encounters contamination that potentiallyextends to depths greater than 1 m.Characterization of surface and subsurface soils beneath hardstands may be deferred until afterhardstands are removed as part of Phase 1 DP activities.6.11 Establish <strong>Site</strong>-Specific Performance for On-<strong>Site</strong> and Field-Based Analytical MethodsCSAP data collection will use a variety of on-site and field-based data collection methods. Acomponent of CSAP data collection will be to establish site-specific performance for thesemethods to ensure data of sufficient quality to satisfy decision-making requirements. Examples offield-based and on-site methods include various gamma walkover NaI detectors, down-hole NaIdetectors, detectors for conducting ex situ core scans, and rapid-turn on-site methods for Cs-137and Sr-90 soil sample analyses.Rev. 1 45
WVDP Phase 1 CSAPFor field or on-site methods deployed as part of Phase 1 CSAP data collection, the following arethe minimum generic performance verification requirements:• Precision. Precision is a measure of the degree of variability or “error” in a method’sresults. Precision is usually expressed either as a standard deviation or as a relativepercentage error. Precision is typically a function of contaminant concentration. Theprecision of field and on-site laboratory methods will be established for contaminantlevels that are of significance from a decision-making perspective.• Accuracy. Accuracy refers to how close a reported result from a method is to the truevalue. Accurate methods are methods with acceptable precision and an absence of bias.Bias is evaluated by comparing average reported results with known values for repeatedmeasurements of standard reference materials.• Reproducibility. Reproducible results refer to results that can be replicated, typicallywithin a specified percentage of the original value. Acceptable percentages aretechnology/application-specific. In the case of detectors, reproducibility is demonstratedby replicate measurements. For analytical methods, reproducibility is demonstrated bysplit sample analyses.• Completeness. Completeness is a measure of how often data are rejected or lost due tomethod problems and/or data quality issues. Methods must be shown to produce useable(i.e., satisfying data quality requirements) data sets at least 80% of the time.Method performance can also be evaluated by the level of decision-making error associated witha method’s data sets. For example, if the decision was whether contamination was present orabsent at a location, errors would include falsely identifying contamination when it was notpresent at levels of concern or missing contamination when, in fact, it was present at levels ofconcern.6.11.1 NaI Gamma Walkover Survey Detector PerformanceThere are a variety of NaI detector geometries that can potentially be used for GWS. Because oflow-energy gamma emitting radionuclides that are ROI, a Field Instrument for Detection of LowRev. 1 46
WVDP Phase 1 CSAPEnergy Radiation (FIDLER) will be used. A 2 in. × 2 in. NaI detector may also be used toenhance the detectability of Cs-137 at CG w levels, if necessary. To evaluate FIDLER detectorperformance and to determine whether a 2×2 or 3×3 NaI detector is necessary, the following datacollection activities will be performed:• A reference area will be established with a portion (100 m 2 ) used for detector evaluation(see Section 8 for more details). Each gross gamma activity detector used in support ofPhase 1 activities for logged surveys will be evaluated by surveying and logging the datafor this area. Key parameters will include average response of the detector and thevariability in data results observed. Data density will be at least one reading per squaremeter; data will be collected in a manner that results in relatively uniform coverage forthe area.• At least 20 locations will be selected from the WVDP premises for comparative samplecollection. The key characteristics desired for each location are as follows: indications ofelevated surface activity at levels that would likely be near or above CG w requirementsfor Cs-137, an area likely affected primarily by Cs-137 impacts, an absence of any shineconcerns, no surface cover (e.g., pavement, gravel, asphalt, and the like), relative constantgross activity readings over a small area (2 to 3 m 2 ), and an area that will unlikely beimmediately affected by Phase 1 remediation activities. WMAs most likely to have theseconditions are the northern portion of WMA 10, the northern portions of WMA 5, and thewestern portions of WMA 4. Under ideal conditions, the 20 locations would span grossactivity levels ranging from slightly above background through approximately three timesbackground gross activity levels.• Each location selected will be flagged and marked in a manner that allows it to berecovered exactly. Each detector type (e.g., FIDLER, 2×2, 3×3) planned for use as part ofPhase 1 activities will have, at minimum, a static 30-second reading obtained at a heightof 15 cm above the location prior to soil sampling. Detector measurements will not takeplace if soil moisture conditions may adversely affect results (i.e., immediately afterheavy rains or in the presence of saturated or near-saturated surface soil conditions).• After detector measurements have been made, each location will be sampled. Sampleswill be representative of a 0-to 15-cm soil depth.Rev. 1 47
WVDP Phase 1 CSAP• Samples will be submitted for an analysis of all 18 ROI.• Regression analyses will be used to develop a relationship between sample results anddetector responses. In particular, gross activity responses per picocurie per gram will beestimated. These responses will be used in conjunction with background data sets toestimate the minimum detectable Cs-137 activity concentrations (i.e., the activityconcentrations that can be reliably differentiated from background conditions) for eachdetector type.• If the minimum detectable activity concentrations for the FIDLER are below the CG wrequirements for Cs-137, then only a FIDLER will be used for the WVDP premise-widegamma scans. If the minimum detectable activity concentrations for the FIDLER areabove CG w requirements for Cs-137 but the minimum detectable activity concentrationsfor an alternate detector (e.g., 2 in. × 2 in. or 3 in. × 3 in.) are below, then an alternativedetector will also be deployed in addition to the FIDLER as part of WVDP premise-wideGWS.All surface soil sampling locations will have a static FIDLER reading collected from anunobstructed height of 15 cm above the location prior to sampling. Static FIDLER readings willbe recorded in a fashion that allows them to be paired with the analytical results associated withthe sampled location. These paired results will be preserved and reviewed as work progresses toallow monitoring of FIDLER performance and determination of field MDC values for theFIDLER.Additional GWS-related quality assurance/quality control (QA/QC) requirements related toperformance are described in Sections 11 and 14.6.11.2 Down-Hole and Ex Situ Core ScansDown-hole scans and/or ex situ core scans will be used as part of CSAP soil-coring activities todetermine the vertical distribution of contamination in the subsurface. Down-hole scans are thepreferred method; however, site conditions may at times preclude the collection of down-holegross activity scans for the entire length of soil cores. In these instances, ex situ core scans mayRev. 1 48
WVDP Phase 1 CSAPbe substituted. Ex situ core scans will be used to identify the portion of a soil core that should bebiased sampled in response to elevated gamma scan readings.The performance of down-hole and ex situ core scans will be monitored by electronicallyrecording scan results, matching scans with corresponding soil core sample results, andevaluating the relationship between core scan results and corresponding soil core sample results.The general relationship evaluation process is similar to that for GWS detectors as described inSection 6.11.1.Data specific to down-hole and ex situ core scan performance will not be collected; however,performance will be evaluated and monitored as down-hole and ex situ core scan data setsbecome available. This evaluation will have two components:• Average background values and background variability for down-hole gamma scans andex situ soil core scans will be determined based on data from CSAP soil cores in whichno contamination is found present above background levels and from reference area datacollection. This variability will, in turn, allow the development of field investigationlevels that can be applied to down-hole and ex situ surveys to flag results that areinconsistent with background and potentially indicative of the presence of radionuclidesabove background levels.• In many cases, CSAP data collection protocols call for biased sampling of soil coresif/when elevated readings are encountered from either down-hole or ex situ surveys of thesoil cores. In these cases the resulting laboratory data will be matched with thecorresponding survey scan data, and the results used in combination with the backgrounddata sets to estimate minimum detectable concentrations.6.11.3 On-<strong>Site</strong> Cs-137 and Sr-90 Analytical PerformanceRapid screening of soil and groundwater samples for Cs-137 and Sr-90 is a key component of thevarious CSAP sampling strategies. Cs-137 and Sr-90 are believed to be the two radionuclides inenvironmental media that will drive Phase 1 decision-making for most of the WVDP premises.Rapid screening for Cs-137 and Sr-90 in environmental media will likely take place on-site in anappropriate facility.Rev. 1 49
WVDP Phase 1 CSAPThe detection limit capability for rapid screening of Cs-137 and Sr-90 is the same as that forstandard off-site laboratory analyses as described in Section 12. These detection limits may not berequired for all samples analyzed on-site, but the on-site analytical capacity must exist formeeting these detection limits when necessary.The accuracy and precision of on-site methods will be determined and monitored through the useof certified standards.Of particular concern is the ability of an on-site laboratory to adequately prepare and homogenizesoil samples for analysis. Soil sample preparation protocols will be developed as part of theoverall standard laboratory operating procedures. The goal of soil sample preparation is that theerror introduced by residual within-sample heterogeneity should be no more than themeasurement error associated with the analytical procedure at the relevant CG w . Conformancewith this goal will be evaluated through the use of replicate subsampling and analysis of soilsamples. The soil samples selected for replicate subsampling and analysis will be soil samplesthat exhibit activity concentrations for either Cs-137 or Sr-90 within the immediate range of therelevant CG w requirement (i.e., from one half of the CG w to three times the CG w ).6.12 Develop an Inventory of Buried InfrastructureBuried infrastructure is important to Phase 1 decommissioning activities for a number of reasons.Buried infrastructure has the potential to be associated with subsurface soil and groundwatercontamination, as a source (e.g., leaking lines), because of contaminated backfill, or because theburied infrastructure provides preferential flow paths for the movement of contaminatedgroundwater. Buried infrastructure is a consideration from a safety and engineering perspectivefor intrusive CSAP characterization work and for planned Phase 1 remediation activities thatinvolve excavation of subsurface soils.CSAP data collection will develop an inventory of buried infrastructure within the WVDPpremises. The details of the strategy for developing this inventory are described in Section 5 ofthis plan. DOE will maintain this inventory through the life cycle of Phase 1 activities, updatingand amending the inventory as necessary and appropriate.Rev. 1 50
WVDP Phase 1 CSAP6.13 Determine Groundwater Flow Data Necessary for WMA 1 and WMA 2 Barrier WallDesignsA significant amount of groundwater flow parameter estimation and modeling work has beenperformed for the Final Environmental Impact Statement and DP and in support of the NorthPlateau Plume Permeable Treatment Wall that was installed in WMA 2 to address the NorthPlateau Groundwater Plume. The results of those data collection and modeling efforts will bereviewed by the contractor responsible for designing the WMA 1 and 2 barrier walls in thecontext of groundwater flow data needs. In the event that additional data are deemed necessary tosupport barrier wall design, wells or piezometers will be installed as necessary and theappropriate tests conducted to fill the data gaps.6.14 Collect Geotechnical Data Required for Barrier Wall DesignThe barrier walls that are planned for the WMA 1 and WMA 2 excavations require geotechnicaldata for proper design. CSAP data collection will provide the information required for the designof the WMA 1 and WMA 2 barrier walls. The strategy for collecting this information and thetypes of information to be collected are as follows:• Soil cores will be collected along the planned footprints of the barrier walls. In the caseof slurry walls, core spacing will be 20 m. In the case of sheet pile walls, core spacingwill be 10 m. The reason for the closer spacing along the sheet pile walls is to provide ahigher level of confidence in the contamination status of soils along the footprint. Corespacing, particularly for the slurry walls, may be modified based on the initial set ofresults. For example, a critical design parameter is the depth to the Lavery Till; if theinitial set of slurry wall core locations shows signs of significant variations in till depthbetween adjacent core locations, the spacing will be tightened.• Intact soil cores will be collected to the extent possible. Cores will include at least 1 m ofthe Lavery Till. Each core will be divided into 1-m segments.• A variety of geotechnical field data will be collected from each core location, asnecessary and required for sheet pile/slurry wall design. In addition, soil samples will beRev. 1 51
WVDP Phase 1 CSAPcollected and submitted for geotechnical analyses (e.g., grain size, Atterberg limits,triaxial strength, etc.) as required by sheet pile/slurry wall design.6.15 Identify WMA-Specific Data GapsWMA-specific data gaps are identified in the WMA-specific appendices attached to the CSAP,along with data collection to address those gaps.Rev. 1 52
WVDP Phase 1 CSAP7.0 REMEDIAL ACTION SURVEYSRemedial action surveys refer to collecting data to assist in guiding remedial activities. In thecontext of the Phase 1 soil excavation program, these surveys can include guiding the progress ofexcavation (e.g., determining how far laterally excavation should proceed to addresscontamination), supporting the segregation of soils for waste disposition, and determining whencleanup objectives have been achieved so that the exposed excavation floors and walls are readyfor Phase 1 FSS data collection. Additionally, remedial action surveys may include documentingthe contamination status of exposed soil surfaces when Phase 1 activities are complete for thoseareas where Phase 1 FSS protocols will not be applied to demonstrate closure. An example of thisis hardstand removal in areas where contamination is known to exist at depths greater than 1 m,precluding the application of the Phase 1 FSS process for surface soils.This section of the CSAP discusses remedial action surveys to guide excavation, to determinewhen cleanup objectives have been achieved, and to document the contamination status ofexposed soil surfaces after Phase 1 activities are complete for those areas that will not be includedin the Phase 1 FSS. All soils excavated as part of Phase 1 activities will be sent off-site fordisposition following the requirements of the DOE radioactive waste management program. Therequired data collection and decision-making processes for waste disposition are a function of thefacilities available to receive the various waste streams that Phase 1 activities will generate andare a function of their waste acceptance criteria and documentation requirements. Data collectionduring remediation for waste disposition purposes is outside the scope of the Phase 1 DP andCSAP; data collection to support waste disposition will not be addressed as part of this plan, butmay be addressed in a Waste Management Plan developed to support the Phase 1 remediation.The historical soil sample data indicate that Cs-137 and Sr-90 will likely be the primarycontaminants of concern from a CG w perspective in soils to be addressed by Phase 1 activities.On the basis of the historical data, there are areas of the WVDP premises where these twocontaminants exist relatively independently of each other, and there are other areas where theyare commingled. Elevated (above levels that would occur in background soils) Cs-137 activityconcentrations in soils are readily identifiable by a variety of NaI-based gross gamma detectorswhen those activity concentrations are at CG w activity concentrations; consequently, Cs-137 canbe at least partially addressed by gross gamma activity scans as part of a remedial action survey.Rev. 1 53
WVDP Phase 1 CSAPHowever, this is not the case with Sr-90. DOE is currently exploring prototype systems based ongas proportional counting detectors that may prove to be valuable for real-time screening ofexposed excavation soil surfaces for Sr-90. However, this plan assumes that in areas where eitherpre-excavation CSAP data collection or historical data sets identified Sr-90 impacts, soilsampling and analysis will be required as part of remedial action survey activities. Theexpectation for both Cs-137 and Sr-90 is that rapid turn-around analytical support will beavailable as part of remedial action survey activities, and that those methods (gammaspectroscopy for Cs-137 and liquid scintillation for Sr-90) will have sufficiently low detectionlimits to support the required decision-making at CG w activity concentrations.If pre-excavation CSAP data results determine that there are other radionuclides that are alsopotential risk drivers in addition to Cs-137 and Sr-90, the remedial action survey approachesdescribed here will be modified to address those radionuclides as well.The following sections describe remedial action survey data collection in support of specificPhase 1 activities.7.1 WMA 1 and WMA 2 Excavation SupportIn both the WMA 1 and WMA 2 excavations, initial excavation footprints will have been definedon the basis of CSAP data results and the physical requirements associated with subsurfacebuilding/lagoon infrastructure removal. The presence of slurry or sheet pile walls on all four sidesof the WMA 1 excavation and along the north, west, and east sides of the WMA 2 excavation willlimit the extent the excavations can extend laterally in response to encountering unexpectedsubsurface contamination in excavation side walls as the excavations proceed. The depth of boththe WMA 1 and WMA 2 excavations will extend a minimum of 1 ft into the Lavery Till.In the case of WMA 1, along the north, west, and south sides of the excavation, the soil surfacewill be sloped from the floor of the excavation up to land surface at an angle of approximately 45degrees. Along these sides at the land surface, the top of the excavation will be extended up to thesheet pile wall installed for water control. Along the east side of the excavation, the excavationfloor will be extended to the slurry wall.Rev. 1 54
WVDP Phase 1 CSAPIn the case of WMA 2, the southern side of the excavation will be sloped at an angle ofapproximately 45 degrees from the floor to the land surface. Along the west, north, and east sidesof the excavation, the excavation floor will extend to the slurry wall.For both WMA 1 and WMA 2, remedial support data collection will begin as the excavationsapproach their design extent (i.e., when excavation is within 2 ft of the design surface). Thereason for starting remedial support data collection at this point is to provide information on thecontamination status of soils immediately above the till. In the case of WMA 1, these data will beused to assist in determining which foundation pilings are of potential concern. In the case ofWMA 1 and WMA 2, these data are expected to provide insights into where contamination mightextend deeper into the till. The assumption is that contamination within the till would likely beoverlain by soils with much higher activity concentrations.The initial round of remedial support data collection will consist of complete coverage by scanswith a FIDLER detector for the floor of the excavations. The FIDLER has sufficient sensitivityfor identifying Cs-137 at its subsurface CG w value, is well-suited for excavation work (i.e.,relatively insensitive to shine from excavation walls or adjacent facilities), and is capable ofdetecting other low-energy gamma emitting radionuclides such as Am-241 and U-238 atrelatively low levels if they are present. Scans will be logged as they progress by using surveyinginstrumentation capable of three-dimension locational control to less than 1 ft in accuracy and theresulting data (measurements results and coordinates) recorded electronically. Scan data will berecorded in a manner that identifies the excavation surfaces to which they apply. Scan data willbe mapped and reviewed for completeness and for indications of gross activity results notconsistent with background. At its subsurface CG w value, Cs-137 will have a FIDLER responsesignificantly greater than background. However, the primary contaminant of concern at thebottom of the excavations will likely be Sr-90, which will not be detectable directly by grossgamma activity scans. It is possible, though, that Sr-90 may be commingled with other slightlyelevated radionuclides with activity concentrations detectable by a FIDLER that would flag areasas potentially of concern.Since a deep subsurface background reference area will likely not be available prior to theinitiation of WMA 1 and WMA 2 excavations, the initial round of scanning results will also beused to identify a portion of the excavation surface that appears to be at background conditions.This area will be systematically sampled with six soil samples collected across the area to a depthRev. 1 55
WVDP Phase 1 CSAPof 15 cm and analyzed for Cs-137 and Sr-90 via fast-turnaround to confirm their absence, andthen the samples will submitted for off-site analysis for all 18 ROIs. Based on the assumption thatthe analyses confirm background conditions for these soils, the scan data from this area would beused as a point of comparison for scan data collected as part of remedial action support elsewherein the excavations.When excavations have reached their design extent, a second round of remedial support surveyswill be conducted. The second round will begin with complete excavation surface coverage(floors and sloped walls) by using a FIDLER detector. If scan results for any portion of theexcavations indicate evidence of measurable impacts, either additional excavation may take placeor the area of interest will be biased sampled to a depth of 15 cm and submitted for fast turnaroundfor analyses of Cs-137 and Sr-90. If the results indicate soil activity concentrationsexceeding subsurface CG w standards, excavation in that area will continue until scans/samplingindicate the standards have been achieved or the excavation has reached its physical limits.In the case of sloped walls within the WMA 1 or 2 excavations, contamination at levels ofpotential concern may be encountered that extends beyond the practicable limits of excavation,and potentially beyond the sheet pile walls. In these instances soil sampling from the slopedsurface will take place to document the contamination status of soils adjacent to sheet pilingwithin the sloped surface. Additional subsurface soil sampling may take place outside the sheetpiling to determine and document the lateral extent of the observed contamination as part ofPhase 1 activities.If scanning of the exposed excavation surface does not indicate evidence of elevated activity thatwould be a concern and the excavation has reached its design extent, then remedial action surveysoil sampling will take place. Soil samples will be collected systematically on a random-starttriangular grid across the excavation surface (floor and sloped walls) to a depth of 15 cm at adensity of one sample per 200 m 2 . In the case of WMA 1, this will result in approximately 60samples collected from the floor and walls of the excavation. In the case of WMA 2, this willresult in approximately 90 samples from the excavation floor and walls. These samples will besubmitted for quick-turnaround analysis of Sr-90. The results from these samples will be used, inconjunction with the scan information, to determine whether additional excavation is necessary orthe excavation face is ready for FSS data collection following the FSSP protocols. If the latter, theSr-90 sample results will be used to fine-tune FSS sample numbers by providing an estimate ofRev. 1 56
WVDP Phase 1 CSAPthe lower bound of the gray region (LBGR) and variability observed. If contamination above thecleanup standards is found in the sloped soil walls of the excavation in WMA 1, the impermeablesheet piling will limit the extent to which this contamination can be pursued laterally.In the case of WMA 1, approximately 476 foundation pilings will be present that extend into thetill (and in some cases through the till). According to the Phase 1 DP, these pilings will be cut justbelow the final excavation surface. If scans identify elevated activity of potential CG exceedancesin the till material adjacent to the pilings, excavation will continue until CG exceedance concernsare no longer present. Biased soil samples with rapid Sr-90 turnaround results may be used tofurther interpret scan readings for these piles. Remedial action surveys combined with quickturnaroundSr-90 sample results will be used to segregate pilings into two groups: those thatclearly have contamination present in soils above them and those that do not. These groupingswill be used to implement Phase 1 FSS data collection protocols as described in the FSSP.7.2 HLW Transfer Trench Contamination StatusThe planned Phase 1 decommissioning activities in WMA 3 will remove the HLW transfer linesand leave behind the concrete HLW transfer trench. The assumption is that the exterior of thetrench has not been affected. Remedial action surveys will be conducted inside the empty HLWtransfer trench to establish the radiological status of the trench after removal of the transfer line.The trench is approximately 500 ft long, 6 to 20 ft wide, with a height of 6 to 9 ft.Before data collection is initiated within the trench, radiological safety surveys conducted duringthe removal of the transfer lines will be reviewed to determine whether there is any immediateevidence of elevated areas.Data collection for the trench will include two types of scans: one using an appropriately shieldedNaI detector to evaluate the potential for volumetric contamination within the concrete, and theother with a zinc sulfide (ZnS) scintillation or gas proportional detector to evaluate for thepresence of surface beta contamination. In the case of an NaI detector, shielding may be requiredto limit the field of view of the detector to the area of concrete of interest and to mitigate potentialshine effects from other portions of the trench. In both cases, surveys will be conducted toprovide 100% coverage of the trench floor and 25% coverage of the trench sides. If appropriatecoordinate/measurement logging systems are combined with the detectors, digitally recordedRev. 1 57
WVDP Phase 1 CSAPscans will be employed in a manner that captures readings and coordinates digitally. Otherwise,direct readings will be taken at a density of one reading per 1 m 2 with the results recorded in fieldnotebooks.The purpose of these scans is to document the contamination status of the transfer trench uponcompletion of planned Phase 1 activities.7.3 Removed Infrastructure Footprint Contamination StatusA number of Phase 1 activities will result in the removal of concrete pads, hardstands, and thelike outside the footprint of the WMA 1 and WMA 2 deep excavations. In each of these cases, thepresence of this infrastructure would have precluded thorough characterization of underlying soilsby the CSAP data collection prior to infrastructure removal.• In some cases, this infrastructure will exist in areas where there is known contaminationat depths greater than 1 m. At these locations, the area will not be a candidate for Phase 1FSS data collection, even if there is not a reason to believe surface soils exposed byinfrastructure removal are contaminated above surface soil CG levels. In these cases, thepurpose of remedial action survey data collection after infrastructure removal is todocument the contamination status of the exposed soils for Phase 2 planning purposes.• In other cases, the exposed soils themselves may clearly pose surface soil CG concerns.At these locations, DOE may choose to remove contaminated soils as part of Phase 1activities until surface soil CG standards have been achieved. In these cases, the purposeof remedial action surveys is to support the removal of contaminated soils and to indicatewhen surface soil CG standards have likely been achieved.• Finally, there may be cases in which there is no evidence of subsurface contamination atdepths greater than 1 m, and the exposed soils resulting from infrastructure removallikely meet surface soil CG requirements. At these locations, the purpose of the remedialaction survey data collection is to document the contamination status of the exposed soilsin preparation for Phase 1 FSS data collection, should DOE choose to perform Phase 1FSS activities.Rev. 1 58
WVDP Phase 1 CSAPIn all three of the cases described above, the following minimum remedial action survey datacollection will take place. A logged GWS will be performed consistent with the FSS protocols (asdefined in the Phase 1 FSSP). If there are indications of surface soil CG exceedances based onscan results, biased samples will be collected from those locations and submitted for quickturnaroundanalysis for Cs-137 and Sr-90. If DOE chooses to remove soils exceeding surface soilCG standards, soil removal will take place and logged GWS combined with biased soil samplingwill be repeated for the affected areas. If DOE chooses not to remove soils or scan/biasedsampling data indicate contamination levels likely meet surface soil CG requirements, one sampleper 200 m 2 area will be collected to a depth of 15 cm and submitted for quick-turnaround analysisfor Cs-137 and Sr-90.In some instances, there may be concerns about subsurface contamination beneath infrastructurethat could not be fully addressed until the infrastructure was removed. In these cases, theminimum remedial action survey data collection described above may be supplemented withvertical soil cores to an appropriate depth, with down-hole bore scans every 15 cm and selectivebiased sampling of specific vertical subsurface soil layers based on scan results. In the case ofbiased sampling, the samples will be submitted for quick-turnaround analyses of Cs-137 and Sr-90.7.4 Excavation EfficacyData will be collected to guide Phase 1 DP soil removal, to support soil segregation for wastedisposal purposes, and/or to verify that the remediation goals for that particular location or areahave been achieved. Details about data collection to support soil removal and to verify thatremediation goals have been met for the deep WMA 1 and WMA 2 excavations are described inSection 7.1. Details about data collection to verify that remediation goals have been met and/or toestablish the contamination status of remaining exposed soils are described in Section 7.3. Detailsabout data collection to support soil segregation for waste disposal purposes may be described ina Phase 1 DP Waste Management Plan developed for this purpose.Rev. 1 59
WVDP Phase 1 CSAPThis page intentionally left blank.Rev. 1 60
WVDP Phase 1 CSAP8.0 REFERENCE AREAA surface soil reference area will be established and maintained for the duration of Phase 1activities. The reference area will be approximately 2,000 m 2 and will encompass surface soiltypes and conditions similar to those expected within the WVDP premises. The reference areawill have no historical evidence of contamination from NFS or WVDP activities, and there willbe no reason to believe such impacts might exist. Once established, the perimeter of the referencearea will be clearly demarcated, the interior brushed to allow easy access for sampling and grossactivity surveying, and the area protected from intrusion or disturbance for the duration of Phase1 activities. The reference area will be used to support both CSAP and FSS activities.8.1 Gross Activity Survey Reference Data CollectionOne purpose of the reference area is to assist in the development of gross activity survey data setsthat can be used for background purposes and to evaluate background performance of variousdetectors that may be deployed on the WVDP premises in support of gamma surveys.A 100-m 2 area within the reference area will be selected and further protected through the use ofa removable cover in a manner that maintains relatively stable soil moisture conditions for thisarea. The purpose of this cover is to allow reproducible results from gross gamma scans andensure comparability among gross activity scans of this area conducted by different detectors atdifferent times.Section 11.5 contains details about the data collection required for this 100-m 2 area.8.2 Background Soil Sample Reference Data CollectionThe reference area will be sampled once, at the initiation of CSAP activities. The purpose of thissampling and analysis will be (1) to establish a background data set that can be used for WRSstatistical tests as part of the FSS process, if that proves necessary, (2) to establish backgroundactivity concentrations and their distribution for radionuclides that are naturally occurring tosupport decision-making during CSAP data collection, and (3) to establish backgroundRev. 1 61
WVDP Phase 1 CSAPperformance for the analytical methods that will be used to support Phase 1 decommissioningdata collection activities.Sampling and analysis will proceed as follows:1. The reference area will be divided into ten 200-m 2 areas. Two sets of ten soil sampleswill be collected, with two samples from each 200-m 2 area. One set of samples will berepresentative of soils from the surface to a depth of 15 cm. The second set will berepresentative of soils from 15 cm to a depth of 1 m. Sufficient soil mass will be collectedto allow analysis of all 18 ROIs and the 12 potential ROIs. Each sample will be fieldhomogenized, containerized, and labeled in a manner that clearly identifies the area fromwhich it was taken and the depth profile it represents.2. The resulting 20 samples (10 samples representing a 15 cm surface soil depth and 10samples representing the 15 cm – 1 m surface soil depth) will be submitted for analysis ofall 18 ROI and the 12 radionuclides of potential interest.Four soil cores will be obtained from within the reference area to a depth of at least 1 m into theLavery Till. The locations of the soil cores will be selected so that they are representative of fourquadrants within the reference area. The soil cores will be retrieved in a manner that allowsretrieval of intact cores and down-hole gamma scans by using a suitable detector. Down-holegamma scans will be conducted by taking a 30-second static reading at 15-cm intervals downhole.Data will be recorded in electronic spreadsheets in a fashion that clearly identifies thedetector type and identifier, the location of the core, the depth of the reading, and gross counts incounts per minute. Soil cores will also be scanned ex situ with a suitable detector. As part of thiswork, the soil type will be recorded for the length of the soil core along with soil moistureestimates.8.3 Radionuclide-Specific Background Activity ConcentrationsIn many instances, the CSAP pre-remediation decision-making process described in the attachedappendices requires a determination of whether soil sample results are consistent withbackground conditions or not. The Phase 1 DP provides an analysis of background activityconcentrations for ROIs in Section 4.2.2 and Appendix B based on historical data for surface soilsRev. 1 62
WVDP Phase 1 CSAPand sediments, and based on a combination of historical data and more recent sampling results forsubsurface soils. As part of the analysis, average and maximum results were presented.For CSAP pre-remediation decision-making, background comparisons will be based on resultsfrom the reference area surface soil sampling. The 95% UTL will be estimated for eachradionuclide that could be expected to be present in measurable quantities in background soils(i.e., naturally occurring radionuclides and those anthropogenic radionuclides present inbackground surface soils due to historical fallout) based on the 0- to 15-cm-deep sample resultsand the 15-cm to 1-m-deep sample results. The raw sample results will be used to perform thiscalculation regardless of whether sample results are considered detections or not.Background comparisons will be based on depth (i.e., 15-cm to 1-m-deep samples to 15-cm to 1-m-deep reference area sample results, 15 cm deep samples to 15 cm deep reference area sampleresults). For surface soils, a sample result will be considered inconsistent with background if theactivity concentration of one or more radionuclides exceeds its respective 95% UTL. Forsubsurface soils, the point of comparison will be to 15 cm to 1 m deep reference area sampleresults. The same rule for surface soils will apply for those radionuclides that are naturallyoccurring. In the case of the Pu-239, measurement error is expected to be significant with respectto measurable background activity concentrations. If the application of the rule described aboveresults in an unacceptably high rate of false positive “hits” for Pu-239, the comparison processmay be modified with NYSERDA concurrence to also account for measurement uncertainty.For those radionuclides that are anthropogenic and site-related, a surface or subsurface soilsample result greater than three times its reported uncertainty will be considered inconsistent withbackground conditions.For samples that fail either the 95% UTL or the three-times-uncertainty rule (whichever isapplicable), re-analyses may take place to verify that the observed result is not a product ofanalytical error alone.Sediment sample results will be compared to 15 cm deep surface soil sample results, using thesame protocol as described above for surface soils.Rev. 1 63
WVDP Phase 1 CSAPThis page intentionally left blank.Rev. 1 64
WVDP Phase 1 CSAP9.0 CIVIL SURVEYING AND COORDINATE CONTROLPhase 1 decommissioning data collection will require various levels of civil surveying support.This section identifies the various levels of civil surveying support that may be required as part ofPhase 1 activities. The information contained in this overview is based on USACE EM 1110-1-1005, Engineering and Design: Control and Topographic Surveying (USACE 2007), and onUSACE EM 1110-1-1003, NAVSTAR GPS Surveying (USACE 2003).9.1 Types of Civil SurveysThe general types of survey support potentially required by Phase 1 decommissioning activitiesgoing forward include the following:1. Reconnaissance Topographic Surveys. Reconnaissance surveys are site-mapping surveysintended to lay out general site features in support of general decision-making.Reconnaissance survey information can potentially be taken from existing aerial flyovers,hand-held differentially corrected global position system (GPS) surveys, or existingmaps. Relative feature coordinate accuracy is of importance; absolute feature coordinateaccuracy is of lesser importance. Reconnaissance surveys may be a precursor to moredetailed, accurate, and costly civil surveys. An example is a Light Detection and Ranging(LiDAR) data collection effort completed for the site in 2010.2. Detailed Topographic Surveys. Detailed surveys are the basis for detailed plans showingsite layout and facilities. Detailed topographic surveys can be completed by using a totalstation, GPS, laser scanning, plane table, and/or photogrammetric methods. In the contextof the WVDP premises, detailed surveys are also used to support environmental datacollection efforts. Detailed topographic surveys are for planning and data collectionsupport purposes and have accuracy standards that are specified suitable for the planningneeds requiring support. Accuracy standards can vary widely depending on data qualityneeds. For example, an accurate elevation measurement for a gamma reading of a soilsurface may not be necessary but, for a monitoring well, an accurate top-of-casingmeasurement is essential. A LiDAR topographic surface is available for the site based onLiDAR data collection completed in 2010.Rev. 1 65
WVDP Phase 1 CSAP3. Utility Surveys. Utility surveys typically fall into two categories: surveys of newlyinstalled utilities (see As Built Surveys) and surveys of existing utility systems, includingabove ground, ground surface, and subsurface utilities. For the WVDP premises, existingutility surveys potentially serve several very important purposes such as identifyingsubsurface areas where contamination may be present and providing informationnecessary for remedial and decommissioning design work. Additionally, the existingutility surveys are essential for safety reasons during on-site decommissioning work (safeoverhead clearance, safe digs, and so on). Section 5 of this plan describes buriedinfrastructure/utility survey requirements.4. <strong>Site</strong> Plan Engineering Drawing Surveys. <strong>Site</strong> plan engineering drawing surveys aresurveys conducted to support the conception, justification, design, and build process formaintenance, construction, decommissioning, and remediation activities. The accuracyrequirements for site engineering drawings can vary dramatically from feature to feature,depending on the significance of the feature to the ultimate design.5. As-Built Surveys. As-built surveys are intended to show actual site conditions forcompleted projects for record and/or payment purposes. As-built surveys typically haveaccuracy requirements similar to those of detailed surveys completed for planningpurposes. In the case of excavations, as-built surveys are important for costing andpayment purposes. In the case of utilities and structures, as-built surveys are an importantpart of appropriate facilities management. In all cases, as-built surveys are importantquality control checks on work that was performed to determine that requiredspecifications were met and, if there were deviations from drawn plans, to document thereasons why those deviations occurred. In the case of WVDP, as-built surveys will alsodocument Phase 1 decommissioning activities that affect the premise’s land surfaces forFSS purposes and Phase 2 planning.9.2 Accuracy Requirements of SurveysReconnaissance surveys will be conducted with accuracy sufficient to obtain accurate relativelocations of important site features. Typically in this context differentially corrected GPS issufficient.Rev. 1 66
WVDP Phase 1 CSAPIn situ field-screening data collection (e.g., gross activity scans) will be conducted with dataquality expectations as specified in related task orders. This may range from horizontal ±1 m tohorizontal ±1 cm. Vertical accuracy may range from “not pertinent” to ±1 cm. Examples ofinstances in which vertical accuracy is not important are area-wide gamma surveys of existingland surfaces. Examples of instances in which vertical accuracy is important are surveys of thefloors and walls of excavations.Fixed-point data collection (e.g., soil sample, monitoring well installation, and so on) will beconducted with data quality expectations as specified in related task orders. This may range from±10 cm to ±1 mm for both vertical and horizontal coordinates.For utility, engineering designs, and as-built surveys, accuracy requirements reference USACEEM 1110-1-1005 (USACE 2007) recommendations and generally follow recognized industrystandards. Earthwork is associated with Third Order (Class II) to Fourth Order accuracy. Utilitysurveys are typically associated with Third Order (Class II) accuracy. Engineering design and asbuiltsurveys may range up to Second Order, Class II requirements, depending on the structurecomponent.9.3 Survey DocumentationFor the sake of consistency and data integration, all data sets generated that include spatialdimensions will have, at a minimum, feature coordinates provided in State Plane feet, New YorkNAD 1983. Electronic coordinate information must be provided, and may be supplied in one ofthe following formats: ASCII text, Excel, or Environmental Systems Research Institute (ESRI)shapefile. Electronic data deliverables will be organized and submitted in a fashion consistentwith survey objectives.Electronic maps, as required by task orders, will be delivered in both AutoCAD dwg and ESRIshape file formats.The WVDP maintains a set of survey monuments for the WVDP premises suitable for horizontaland vertical control. Phase 1 data collection activities that involve the collection of surveycoordinates will use these monuments as reference points and for QC purposes.Rev. 1 67
WVDP Phase 1 CSAPField notebooks will be maintained and used to identify (at a minimum) for each round of datacollection the following: date, crew member names, survey instruments used including serialnumbers as appropriate, data collection purpose, information pertinent to the quality of coordinateinformation, and supplemental descriptive data as appropriate (e.g., descriptive text, sketches, andthe like).Data sets that include spatial coordinates will be delivered electronically in a manner that clearlylinks site features with their coordinates, that specifies the method for obtaining coordinates, thattime-stamps coordinates (as appropriate), and that describes the level of accuracy associated withthe coordinate data. All delivered data sets will include documentation that the surveyingperformance requirements as specified in associated task orders were met.A variety of surveying methods can potentially be used for determining coordinate informationfor site features. These include (but are not limited to) total stations (robotic or manuallyoperated), differentially corrected GPS, kinematic and real-time kinematic GPS, and terrestrialLight Detection and Ranging (LIDAR). The appropriate technology selection will depend on theaccuracy needs associated with specific task orders, logistical parameters (i.e., presence ofinterfering tree cover, line-of-sight issues, and so on), and cost. Surveying requirementsspecifications will be performance based with the expectation that contractors will deploy themost appropriate technology meeting those performance requirements given the context of thework to be done.Rev. 1 68
WVDP Phase 1 CSAP10.0 FIELD ACTIVITIESThis section provides additional detail regarding CSAP field activities.10.1 Soil Sampling ProtocolsSystematic and biased CSAP soil sampling, in general, will follow the protocols outlined below.Exceptions may be made for biased soil samples where the nature of the location (e.g., adjacent toinfrastructure, excavation walls, and the like) requires an adjustment. In those cases, the reasonfor the deviation and the nature of the deviation must be noted in a preservable manner (e.g., fieldnotebook dedicated to this purpose). Additional details about sampling tools and related fieldprotocols will be described in SOPs to be developed by the contractor responsible for CSAP datacollection.In general, surface soil sampling will be conducted in a manner that yields a samplerepresentative of the top 0 to 15 cm of soil and/or the top 15 cm to 1 m of soil. Where surface soilcover is present (e.g., gravel, asphalt, concrete, and the like), the top of soil is defined as theinterface between the overlying surface cover and the underlying soils. In some cases, such ashardstands, surface cover can be more than 1-m thick. For areas where surface cover and someunderlying soil is removed in support of Phase 1 decommissioning activities (e.g., building slabremoval), the exposed underlying soil surface will be considered surface soils (with the exceptionof the deep WMA 1 and WMA 2 excavations).In general, subsurface soil samples will be representative of 1-m intervals. Depending on the typeof method used to retrieve a soil core, samples may be formed from all of the soils within a 1-minterval, or they may be formed by systemically subsampling soils from a 1-m interval.In the case of all soil sampling, sufficient mass will always be collected to allow for the analysisof all 18 ROI plus the 12 potential ROIs.Rev. 1 69
WVDP Phase 1 CSAP10.2 Groundwater Sampling ProtocolsLimited groundwater sampling will occur as part of planned CSAP activities. Groundwater datacollection will primarily be focused on determining the presence/absence of groundwatercontamination for specific areas and also on contamination extent.Many of the ROIs are not particularly mobile in groundwater. The primary exception is Sr-90,which has been encountered at detectable activity concentrations in groundwater across theWVDP premises. Tritium has also historically been observed in groundwater above backgroundlevels across the WVDP premises, although tritium is not considered a Phase 1 ROI. Tritium canbe a useful indicator of groundwater contamination since its movement through the subsurface isnot constrained by soil interactions; however, in the case of the WVDP, tritium’s relatively shorthalf-life means that it may no longer be a reliable indicator for specific areas of contaminationimpacts. Approximately two to four tritium half-lives have passed since the time that mostsubsurface releases would have taken place.Accordingly, groundwater sampling and analysis will focus on Sr-90. Groundwater samples willprimarily be “grab” samples collected from specific depth intervals. Task-specific work plans andassociated SOPs will specify the methods to be used to obtain depth-specific groundwatersamples. In general, sufficient volume will be collected to allow for analysis of Sr-90;groundwater samples collected in this manner will be filtered prior to analysis. Additional detailsabout sampling tools and related field protocols will be described in SOPs to be developed by thecontractor responsible for CSAP data collection.10.3 Sample Chain-of-Custody/Documentation10.3.1 Field LogbooksAll information pertinent to field activities, including field instrument calibration data, will berecorded in field logbooks. The logbooks will be bound, and the pages will be consecutivelynumbered. Entries in the logbooks will be made in black waterproof ink and will include, at aminimum, a description of all activities, individuals involved in field activities, dates and times ofsampling, weather conditions, any problems encountered, and all field measurements. Lotnumbers, manufacturer names, and expiration dates of standards used for field instrumentRev. 1 70
WVDP Phase 1 CSAPcalibration will be recorded in the field logbooks. A summary of each day’s activities also will berecorded in the logbooks.Sufficient information will be recorded in the logbooks to permit reconstruction of all CSAP datacollection activities conducted. Information recorded on other project documents will not berepeated in the logbooks except in summary form where determined necessary. When not beingutilized during field work, all field logbooks will be kept in the possession of the appropriate fieldpersonnel or in a secure place. Upon completion of the field activities, all logbooks will becomepart of the final project records file.Entries recorded in logbooks will include, but not be limited to, the following information:• Author, date, and times of arrival to and departure from the work site;• Purpose of the CSAP field activity and summary of daily tasks;• Names and responsibilities of field crew members;• Sample collection method;• Number and volume of samples collected;• Information regarding sampling changes, scheduling modifications, and change orders;• Details of sampling locations, including a sketch map illustrating the sampling locations;• Field observations;• Types of field instruments used and purpose of use, including calibration methods andresults;• Any field measurements made that were not recorded electronically;• Sample identification number(s); and• Sample documentation information.10.3.2 PhotographsPhotographs can be an important source of supplemental information for the CSAP datacollection process. Examples of instances in which where photographs are appropriate includevisual evidence of potential contamination, evidence of obstructions that require movingsampling locations, documentation of sampling points, and anomalous conditions that mightaffect either data quality or data interpretation. Photographs taken during CSAP activities will benoted in the field logbook in accordance with the requirements of the field procedure. IfRev. 1 71
WVDP Phase 1 CSAPphotographs are taken to document sampling points to facilitate relocating the point at a laterdate, two or more permanent reference points should be included within the photograph. Inaddition to the information recorded in the field logbook, one or more site photograph referencemaps will be prepared as required.10.3.3 Sample-Numbering SystemA unique sample numbering scheme will be used to identify each sample collected for laboratoryanalysis. The purpose of this numbering scheme is to provide a tracking system for the retrievalof analytical and field data on each sample. Sample identification numbers will be used on allsample labels or tags, field data sheets and/or logbooks, chain-of-custody records, and all otherapplicable documentation used during the project.The sample-numbering scheme used for field samples will also be used for duplicate samples sothat these types of samples will not be discernible by the laboratory. Other field QC samples,however, will be numbered so that they can be readily identified.10.3.4 Sample LabelsLabels will be affixed to all sample containers during sampling activities. Information will berecorded on each sample container label at the time of sample collection. The information to berecorded on the labels will be as follows:• Sample identification number;• Sample type;• Sampled interval (e.g., 0 to 15 cm);• <strong>Site</strong> name and sampling station number;• Analysis to be performed;• Type of chemical preservative present in container;• Date and time of sample collection; and• Sampler’s name and initials.10.3.5 Cooler Receipt ChecklistThe condition of shipping coolers and enclosed sample containers will be documented uponreceipt at the analytical laboratory. This documentation will be accomplished by using the coolerRev. 1 72
WVDP Phase 1 CSAPreceipt checklist as described in the project’s QAPP. A copy of the checklist will either be placedinto each shipping cooler along with the completed chain-of-custody form or be provided to thelaboratory at the start of the project. Another copy of the checklist will be faxed to thecontractor’s field manager immediately after it has been completed by the laboratory. Theoriginal completed checklist will be transmitted with the final analytical results from thelaboratory.10.3.6 Chain-of-Custody RecordsChain-of-custody procedures implemented for the project will provide documentation of thehandling of each sample from the time of collection until completion of laboratory analysis. Thechain-of-custody form serves as a legal record of possession of the sample. A sample isconsidered to be under custody if one or more of the following criteria are met:• The sample is in the sampler’s possession;• The sample is in the sampler’s view after being in possession;• The sample was in the sampler’s possession and then was placed into a locked area toprevent tampering; and• The sample is in a designated secure area.Custody will be documented throughout the project field sampling activities by a chain-ofcustodyform initiated on each day that samples are collected. The chain-of-custody form willaccompany the samples from the project premises to the laboratory and will be returned to thelaboratory coordinator with the final analytical report. All personnel with sample custodyresponsibilities will be required to sign, date, and note the time on a chain-of-custody form whenrelinquishing samples from their immediate custody (except when samples are placed intodesignated secure areas for temporary storage prior to shipment). Bills of lading or airbills will beused as custody documentation during times when the samples are being shipped from the projectpremises to the laboratory, and they will be retained as part of the permanent sample custodydocumentation.Chain-of-custody forms will be used to document the integrity of all samples collected. Tomaintain a record of sample collection, transfer between personnel, shipment, and receipt by thelaboratory, chain-of-custody forms will be filled out for sample sets as deemed appropriate duringRev. 1 73
WVDP Phase 1 CSAPthe course of fieldwork. An example of the chain-of-custody form to be used for the project willbe provided in the project QAPP.The individual responsible for shipping the samples from the field to the laboratory will beresponsible for completing the chain-of-custody form and noting the date and time of shipment.This individual will also inspect the form for completeness and accuracy. After the form has beeninspected and determined to be satisfactorily completed, the responsible individual will sign, date,and note the time of transfer on the form. The chain-of-custody form will be sealed in a plasticbag and placed inside the cooler used for sample transport after the field copy of the form hasbeen detached. The field copy of the form will be appropriately filed and kept at the projectpremises for the duration of the activities.In addition to the chain-of-custody form, chain-of-custody seals will also be placed on eachcooler used for sample transport. These seals will consist of a tamper-proof adhesive materialplaced across the lid and body of the coolers. The chain-of-custody seals will be used to ensurethat no sample tampering occurs between the time the samples are placed into the coolers and thetime the coolers are opened for analysis at the laboratory. Cooler custody seals will be signed anddated by the individual responsible for completing the chain-of-custody form contained within thecooler.10.3.7 Receipt of Sample FormsThe contracted laboratory will document the receipt of environmental samples by acceptingcustody of the samples from the approved shipping company. In addition, the contractedlaboratory will document the condition of the environmental samples upon receipt.10.4 Documentation ProceduresThe tracking procedure to be utilized for documentation of all samples collected during theproject will involve the following series of steps.• Collect and place samples into laboratory sample containers.• Complete sample container label information.• Complete sample documentation information in the field logbook.• Complete project and sampling information sections of the chain-of-custody form(s).Rev. 1 74
WVDP Phase 1 CSAP• Complete the airbill for the cooler to be shipped.• Perform a completeness and accuracy check of the chain-of-custody form(s).• Complete the sample relinquishment section of the chain-of-custody form(s) and placethe form(s) into cooler.• Place chain-of-custody seals on the exterior of the cooler.• Package and ship the cooler to the laboratory.• Receive cooler at the laboratory, inspect contents, and fax (or scan and email) containedchain-of-custody form(s) and cooler receipt form(s), as defined in the project QAPP.• Transmit original chain-of-custody form(s) with final analytical results from thelaboratory.10.5 Corrections to DocumentationAll original information and data in field logbooks, on sample labels, on chain-of-custody forms,and on any other project-related documentation will be recorded in black waterproof ink and in acompletely legible manner. Errors made on any accountable document will be corrected bycrossing out the error and entering the correct information or data. Any error discovered on adocument will be corrected by the individual responsible for the entry. Erroneous information ordata will be corrected in a manner that will not obliterate the original entry, and all correctionswill be initialed and dated by the individual responsible for the entry.10.6 Sample Packaging and Shipping10.6.1 Sample PackagingSample containers will be packaged in thermally insulated rigid-body coolers. Sample packagingand shipping will be conducted in accordance with procedures that will be described in theproject QAPP and applicable U.S. Department of Transportation (DOT) specifications. Achecklist to be provided in the project QAPP will be used by the individual responsible forpackaging environmental samples to verify completeness of sample shipment preparations. Inaddition, the laboratory will document the condition of the environmental samples upon receipt.This documentation will be accomplished by using the cooler receipt checklist to be provided inthe project QAPP.Rev. 1 75
WVDP Phase 1 CSAP10.6.2 Additional Requirements for Samples Classified as Radioactive MaterialTransportation of radioactive materials is regulated by the DOT under 49 CFR 173.401. Samplesgenerated during project activities will be transported in accordance with procedures that ensurecompliance with regulatory requirements. The following will be performed for radioactivematerials:• The cooler must have the shipper and receiver addresses affixed to it in case the courierair bill is lost during shipping.• Samples will be screened prior to packing to determine whether they meet the definitionof a DOT class 7 (radioactive) material.• For samples that meet DOT requirements for radioactive materials:ooThe cooler will be surveyed for radiation and to ensure the package meets therequirements for limited quantity as found in 49 CFR 173.421.A notice must be enclosed on the inside of the cooler that includes the name of theconsignor and the statement, “This package conforms to the conditions andlimitations specified in 49 CFR 173.421 for radioactive material, excepted packagelimitedquantity of material, UN2910.” The outside of the inner packaging or, if thereis no inner packaging, the outside of the package itself must be labeled“Radioactive.”• The following labels will be placed on the cooler:ooAppropriate hazard class label; andIf applicable, “Cargo Aircraft Only.”• The air bill for the shipment will be completed and attached to the top of the shippingsystematic gamma scan box/cooler which will then be transferred to the courier fordelivery to the laboratory.Rev. 1 76
WVDP Phase 1 CSAP10.6.3 Sample ShippingAll environmental samples collected during the project will be shipped no later than 48 to 72hours after the time of collection. The latter time of 72 hours may be necessary if the samples arecollected on a Friday and have to be shipped on a Monday via commercial courier. During thetime period between collection and shipment, all samples will be stored in a secure area. Allcoolers containing environmental samples will be shipped overnight to the laboratory via FederalExpress, similar courier, or laboratory courier.10.7 Investigation-Derived WasteThe field activities described in this plan will generate Investigation-Derived Waste (IDW)materials. These materials generally will consist of soil, sludge, water, and spent personalprotective equipment (PPE) resulting from sampling and associated project premises activities.When accumulated, these materials must be managed appropriately to minimize the exposure andrisks to human health and the environment while adhering to applicable regulatory requirements.IDW will be managed and disposed of consistent with DOE waste management procedures. Theobjective of this section is to establish specific management practices for the handling andsubsequent disposition of these materials.The IDW includes all materials generated during project performance that cannot be effectivelyreused, recycled, or decontaminated in the field. It consists of materials that could potentiallypose a risk to human health and the environment (e.g., sampling and decontamination wastes) andalso materials that have little potential to pose risk to human health and the environment (e.g.,sanitary solid wastes). Two types of IDW will be generated during the implementation of fieldactivities: indigenous and non-indigenous. Indigenous IDW expected to be generated duringCSAP activities will primarily be soils or soil-like material. Non-indigenous IDW expected to begenerated includes decontamination fluid/water and miscellaneous trash, including PPE. Whenaccumulated, the media will be managed appropriately to minimize exposure and risks to humanhealth and the environment while adhering to applicable regulatory requirements.In some instances, it may be appropriate to return IDW to its original location; an example of thiswould be returning trenched soils to their trench after characterization work at a particularlocation is complete. In other cases, returning IDW to its original location is not an option. IDWminimization is a goal; for each field activity that is expected to generate IDW, the field samplingRev. 1 77
WVDP Phase 1 CSAPplan will identify the nature of the IDW expected to be generated and the approaches to be usedto minimize the amount of IDW that will require handling and disposal.10.8 Field DecontaminationField sampling equipment used during soil sampling will be decontaminated between samples.Equipment to be decontaminated includes stainless steel scoops, bowls, spoons, split spoonsamplers, core barrels, and hand auger barrels. Other equipment used during sampling activitiesthat does not directly contact sample materials (down-hole rods, shovels) will be cleaned by apressurized steam cleaner to remove visible soil contamination.Field decontamination will be conducted in an area near the field equipment staging area or in anarea approved by the DOE. Decontamination activities will be conducted so that all solid andliquid wastes generated can be containerized and disposed.Rev. 1 78
WVDP Phase 1 CSAP11.0 GROSS ACTIVITY SURVEYSGross gamma activity surveys are an important component of the Phase 1 CSAP data collectioneffort. An initial, site-wide gross GWS will be conducted to provide a better understanding of thecontamination status of accessible surfaces within the WVDP fence line. Gross gamma surveyswill also be used to support soil remediation activities, both as part of the large WMA 1 andWMA 2 excavations and during the removal of soils, hardstands, and building pads outside theWMA 1 and WMA 2 excavation footprints.This section describes how these surveys will be conducted. All survey data will be logged alongwith coordinate information so as to allow the preservation of results and subsequent presentationand analysis of the data collected for decision-making purposes.11.1 Surface ConditionsThe property within the WVDP fence line contains a variety of surface conditions. These include,but are not limited to, the following: vegetated soil surfaces, gravel hardstands, unpaved roads,paved roads, parking lots and sidewalks, surface impoundments, geomembrane-capped landfills,structure footprints (building slabs where buildings have been removed as well as existingstructures), marshes, and streams. Measurable radionuclide surface contamination is known toexist for portions of the WVDP premises; portions of the property are currently fenced andidentified as radiologically controlled areas because of surface soil or sediment contamination(Figure 7). Not all 165 acres of land will be accessible for the site-wide GWS. For planningpurposes it is estimated that the accessible portion of the site comprises approximately 140 acresof property. Land grubbing will be conducted as necessary to allow for access where vegetationgrowth is problematic.Areas that will not be surveyed include marshes/wetlands where soil moisture conditions orstanding water preclude GWS, the cap of the NDA, and building pads.Rev. 1 79
WVDP Phase 1 CSAPFigure 7 WVDP Radiologically Controlled AreasRev. 1 80
WVDP Phase 1 CSAP11.2 Detector TechnologiesThe Phase 1 DP identified 18 ROIs. Some of the 18 are readily detectable by gross activitygamma surveys, and others are not. Two radionuclides are known to have relatively widespreadenvironmental impacts on-site: Cs-137 and Sr-90. Cs-137 is readily detectable at its CG levels,but Sr-90 is not. There are areas of the WVDP premises where one or the other of theseradionuclides exists in isolation. Examples include the northern border of the premises wheresurface contamination is likely only Cs-137 and its progeny (associated with the Cs-137 prongthat extends to the north), and the North Plateau Groundwater Plume extending underneath WMA4, where subsurface contamination is likely only Sr-90 and its progeny. There are other areas ofthe WVDP premises where these two radionuclides are likely both present in varying ratios. Inthese instances they may also be commingled with one or more of the other 16 ROIs.Field survey instruments for soil contamination are generally limited to those that can detectphotons (gamma ray and X-ray), given the uneven terrain and conditions encountered in the field.This is in contrast to survey instruments that can be used for buildings, many of which allow forthe detection of alpha and beta contamination as well as photon emissions.Four ROIs have no or minimal photon emissions, making them impractical to detect with fieldscanning instruments. The other 14 ROIs are potentially detectable by a field NaI detector.Table 5 provides estimates of minimum detectable concentrations (MDCs) for the 14 ROIs thatare potentially detectable by a NaI detector, along with the type of NaI detector expected toprovide the lowest MDC.As indicated by Table 5, a thin-crystal NaI detector, known as a FIDLER, provides the bestperformance for the greatest number of ROIs. Consequently, all GWSs conducted as part of theCSAP will make use of a FIDLER.In the case of Cs-137, MDC performance is better with a 2 in. × 2 in. NaI detector. The FIDLERis relatively less sensitive to the high-energy Cs-137 photons; however, a FIDLER is moresensitive to the low-energy Compton scattering associated with Cs-137 soil contamination.Consequently, the expectation is that a FIDLER will also provide a sufficiently low MDC for Cs-137. To test this assumption, early in the CSAP data collection process 2 in. × 2 in. NaI detectorRev. 1 81
Table 5: Estimated Scanning Minimum Detectable Concentrations (MDCs) ofRadionuclides in SoilRadionuclide Type of Detector Scan MDC (pCi/g)Am-241 FIDLER 30C-14 NA (1) -Cm-243 2 in. × 2 in. NaI 50Cm-244 FIDLER 300Cs-137 2 in. ×2 in. NaI 7 (2)I-129 FIDLER 60Np-237 FIDLER 30Pu-238 FIDLER 100 (3)Pu-239 FIDLER 200 (3)Pu-240 FIDLER 100Pu-241 NA (1) -Sr-90 NA (1) -Tc-99 NA (1) -U-232 FIDLER 60U-233 FIDLER 500U-234 FIDLER 60U-235 FIDLER 30U-238 FIDLER 60NOTES:(1) NA = not applicable; either there are no photons associated with the radionuclide or the photonyield is too low to allow for detection by field scanning instruments.(2) A specific calculation of scanning minimum detectable count rate for Cs-137 in soil performed(3)in connection with preparation of the Phase 1 DP yielded a value equivalent to 7 pCi/g Cs-137. A comparable value of 6.4 pCi/g is given in Table 6.7 of the MARSSIM when unitsare given in pCi/g.While scan MDCs of 10 and 20 pCi/g are reported for Pu-238 and Pu-239, respectively, inAppendix H of MARSSIM, much larger values were reported elsewhere. The values givenhere are those expected to be reasonably achievable under field conditions.Rev. 1 82
WVDP Phase 1 CSAPperformance will be compared with FIDLER detector performance for an area of the premises known tohave Cs-137 surface soil contamination present. The methods for this comparison are explained in detailin Section 6.11. If the results are that the FIDLER provides sufficiently low MDC levels for Cs-137, onlya FIDLER will be deployed for the remainder of gross gamma survey work. Alternatively, if the 2 in. × 2in. detector proves capable of identifying Cs-137 at levels that would be CG w concerns and that theFIDLER cannot identify, then both a FIDLER and a 2 in. × 2 in. NaI detector will be used for GWS.Because of the range of field conditions and data collection requirements that fall under the CSAP,providing details about all potential detectors and their performance characteristics is beyond the scope ofthis document. However, for each field data collection activity conducted under the CSAP, a fieldsampling plan will be prepared. If the field work includes the collection of scanning data, the detector(s)to be used will be identified, their deployment configurations and protocols specified, their MDCsestimated, and appropriate QC details provided.11.3 BackgroundThe GWS data from the reference area will be used to evaluate the gross activity detector response forsurface soils with background conditions. Gross activity from a survey of the background area will exhibitvariability that is a product of both counting errors and the natural variability in gross activity present inbackground soils. Section 6.7.1 of MARSSIM provides a general methodology for identifying anomalousmeasurement results in the presence of background conditions. As an example, a measurement greaterthan three standard deviations above average background gross activity levels would be highly unlikelyunless either one was in an area with different background conditions or contamination was present.Because of the variety of surface cover that is present on the WVDP premises, background detectorresponses are expected to also vary significantly depending on the nature of the surface being scanned.While a surface soil reference area will be established and a background detector response developed foreach detector used on the WVDP premises (see Sections 8 and 11.5), this reference area background willbe directly applicable only to comparable areas of the WVDP premises where other types of ground coversuch as pavement or hardstand material are not present.Because of varying background conditions and because areas where contamination is present in surfacesoils may have more than one gamma-emitting radionuclide above background conditions, it will not bepossible to establish a unique field investigation level for determining when contamination is present thatRev. 1 83
WVDP Phase 1 CSAPpotentially exceeds surface soil CG levels. Instead, gamma walkover data will be mapped and reviewed toidentify spatial trends or localized anomalies that are indicative of the potential presence of contamination(i.e., gross activity results that are not consistent with presumed background conditions). This qualitativereview will be combined with the use of the field investigation level derived from reference area FIDLERdata to identify locations for biased soil sampling where FIDLER data suggest impacts inconsistent withbackground conditions.11.4 ProtocolsGross gamma activity surveys will use the following protocols:• All gross gamma activity surveys will be conducted in a manner that allows the resulting data tobe matched to coordinates and electronically logged.• In general, measurement acquisition time will be 1 second.• Surface scans will be conducted in a manner that provides at least one measurement per squaremeter.• In general, surveys will be conducted with the detector approximately 15 cm from the groundsurface.• In general, surveys will be conducted by walking parallel lines with the detector swung in aserpentine fashion.• In the event that a clearly elevated area has been identified, the field technician will collectadditional static readings in the vicinity to more clearly define the footprint of the elevated area.• In the event that shine is potentially present (see Section 11.5), steps will be taken to mitigate theeffects of the shine on survey data quality.• Scans will be electronically logged. Each measurement record will include a detector identifier, atechnician identifier, a date and time stamp, coordinate information, a qualifier indicatingcoordinate measurement quality, and the gross activity observed (either as counts per minute orRev. 1 84
WVDP Phase 1 CSAPcounts per second). Electronically logged data will be organized and files will be named in amanner that facilitates matching data files with specific areas. Different types of surface cover(e.g., exposed soils versus hardstand material versus asphalt versus compacted roads) will not bemixed in the same data file.• Soil moisture conditions for areas surveyed will be determined using an appropriate soil moisturemeasurement technique (e.g. Troxler gauge).• Areas that cannot be surveyed for whatever reason will be clearly demarcated electronically bywalking the perimeter of the inaccessible area with a coordinate logging system such as a GPSand noting the reasons for inaccessibility in field notebooks.• For each area surveyed, field notebook notations will be made. The notations will include thedate, a description of the area, the type of surface cover, the purpose of the survey, the name ofthe file(s) containing the logged data, soil moisture conditions, the name of the technician, thedetector identifier, the form of coordinate capture used, and any pertinent meteorologicalinformation. Different types of surface cover will not be mixed in the same logged file.11.5 Quality Control and Quality AssuranceThe following activities represent the minimum QC/QA requirements for gross gamma activity surveys.In several cases control charts are used to monitor detector performance. In general, control charts will bedeveloped by obtaining sequential detector readings sufficient to develop average responses and toestimate the variability associated with those responses. The variability, as measured by the standarddeviation, will be used to construct two and three standard deviation error bars for the control charts. Asdescribed in the subsequent bullets, one or more daily controlled measurements would be obtained andadded to the control charts. Daily readings that are more than two standard deviations away from themean response would require a second measurement. If the second measurement also is more than twostandard deviations away from the mean response or the initial measurement was more than threestandard deviations from the mean response, the detector would be evaluated for evidence of potentialproblems and corrective actions taken as necessary before routine use of the detector is resumed.Rev. 1 85
WVDP Phase 1 CSAP• Each detector used on the WVDP premises will undergo check source evaluations each day that itis used. The evaluations will follow a control chart developed and maintained for this purpose.The purpose of daily check source evaluations is to identify any deviations in expected detectorresponse.• A background reference area will be established and used for detector data quality evaluationpurposes (see Section 8.1). The background reference area will be surveyed with each detectorprior to the detector’s initial use on the WVDP premises. These data will be logged. A 100-m 2portion of the reference area will be covered in a manner that maintains relatively stable soilmoisture conditions (the cover will be removed prior to each survey). Data from the referencearea as a whole will be used to evaluate the range of detector background responses. Data fromthe covered area will be used to compare responses across detectors. The purpose of thesecomparisons is to allow the development of scaling factors, as necessary, to be used tostandardize gamma walkover data from different detectors. Key parameters of interest are theaverage activity concentration observed, the standard deviation (as a measure of backgroundvariability), and the 95% and 99% UTL for the background concentration.• A surface soil control point will be established and maintained through the life of Phase 1activities. Each detector used on the WVDP premises will have two 30-second measurementsmade at the control point each day it is deployed, one at the start of a day’s activities and one atthe end. These data will be recorded and a control chart developed and maintained for eachdetector. The purpose of this activity and the control chart is to identify transientsoil/meteorological conditions that may be adversely affecting detector response or trends indetector behavior that may be a concern.• Prior to surveying an area of interest, the potential for shine will be evaluated. Shine may be theresult of proximity to a building with a history of structural contamination in the case of surfacesoil scans, or it may be a product of geometry and contamination in excavation walls, as may bethe case in deep excavations. If shine is identified as a potential concern, the potential shineimpact will be assessed through the use of shielding and/or comparing results from 15-cm heightreadings with 1-m height readings. If a determination is made that shine impacts could besignificant, a mitigating strategy will be deployed. Examples of mitigating strategies wouldinclude the use of a shielded detector or the application of shine correction factors to acquiredRev. 1 86
WVDP Phase 1 CSAPdata. It is possible that some areas may be so affected by shine that a GWS is not useful. In thatevent the affected area footprint will be mapped and DOE notified of the condition.• Data that are collected as part of gross gamma activity surveys will be mapped and reviewed forcompleteness (i.e., to ensure that there are no areas that lack survey coverage) and for indicationsof data quality problems, either in coordinate information or detector response. Examples of theformer would be mapped data lines that deviate significantly from the known path or data pointsthat clearly fall outside the area being surveyed. Examples of the latter are inexplicable trends insequential readings that appear to be a function of time rather than location or lingering evidenceof shine effects.In addition, all surface soil sampling locations will have a static FIDLER reading collected from anunobstructed height of 15 cm above the location prior to sampling. Static FIDLER readings will berecorded in a fashion that allows them to be paired with the analytical results associated with the sampledlocation. These paired results will be preserved and reviewed as work progresses to allow monitoring ofFIDLER performance and determination of field MDC values for the FIDLER.Rev. 1 87
WVDP Phase 1 CSAPThis page intentionally left blank.Rev. 1 88
WVDP Phase 1 CSAP12.0 LABORATORY ANALYSESTwo levels of laboratory analyses are called for in this CSAP: rapid and standard.12.1 Rapid <strong>Laboratory</strong> AnalysesThe first level of laboratory analyses is for rapid-turnaround analyses of Cs-137 and Sr-90 for soils andgroundwater. “Rapid” is defined as results available within 48 hours of sample collection. Rapidturnaround is intended to support situations in which decisions are being made about whether to continuesampling to depth, to extend sampling laterally to bound contamination, or to continue excavation ofcontaminated soils. In these cases, subsequent field activities are contingent on sample results, and rapidavailability of those results is a requirement. “Rapid” turnaround will likely be accomplished bydeployment of on-site, dedicated analytical capabilities for Cs-137 and Sr-90, but may also beaccomplished through the use of expedited shipping and quick-turnaround analyses at an off-sitelaboratory.Although not expected, CSAP data collection activities may determine that other radionuclides are alsosignificant dose concerns and potentially significant decision-drivers for in-field decision-making. If thisoccurs, rapid-turnaround requirements may be expanded to include other radionuclides.The detection limit requirements for rapid-turnaround analyses of Cs-137 and Sr-90 are the same as thosefor standard off-site laboratory analyses. These detection limits may not be required for all samplesanalyzed on-site, but the on-site analytical capacity must exist for meeting these detection limits ifnecessary.The accuracy and precision of on-site methods will be determined and monitored through the use ofcertified standards.Other data quality parameters as described in Section 6.11 and Section 14.0 will also apply.Rev. 1 89
WVDP Phase 1 CSAP12.2 Standard <strong>Laboratory</strong> AnalysesThe second level of laboratory analyses is for off-site laboratory analyses of the ROIs. Table 6 lists the 18ROIs along with the required minimum detectable concentrations. MDC requirements are set towhichever is lower: (1) approximately 10% of the most restrictive radionuclide-specific CG, (2) 25% ofbackground for naturally occurring radionuclides, or (3) standard laboratory MDCs. All laboratoryinstrumentation will be calibrated by using <strong>National</strong> Institute of Standards and Technology- (NIST-)traceable standards. In addition, the laboratory must be capable of analyzing for the additional 12 ROIs asidentified in Table 3. For these 12 radionuclides, standard laboratory detection limit requirements apply.<strong>Laboratory</strong> methods, instruments, and sensitivities will be in accordance with New York State protocolsfor environmental analysis. Any laboratory used for environmental sample analysis will have appropriateNew York State Department of Health Environmental <strong>Laboratory</strong> Approval Program certification or theequivalent. Activity concentrations in soil will be reported in units of picocurie per gram.Groundwater/surface water sample results will be reported in units of pCi/l. Other QC activities areincorporated into specific field survey procedures.Of particular concern for both the on-site and off-site laboratories is the ability of the laboratories toadequately prepare and homogenize soil samples for analysis. Soil sample preparation protocols will bedeveloped and presented as part of the overall standard laboratory operating procedures. The goal of soilsample preparation is that the error introduced by residual within-sample heterogeneity should be no morethan the measurement error associated with the analytical procedure when activity concentrations arearound the relevant CG. Conformance with this goal will be evaluated through the use of replicatesubsampling and analysis of soil samples. The soil samples selected for replicate subsampling andanalysis will be soil samples that exhibit activity concentrations for either Cs-137 and Sr-90 within theimmediate range of the relevant surface soil CG w requirement (i.e., from one half of the surface soil CG wto three times the CG w ).Off-site laboratory analytical quality will be monitored through the use of an independent QC laboratoryand DOE data verification and validation procedures.Rev. 1 90
WVDP Phase 1 CSAPTable 6: Radionuclide Target Sensitivity for <strong>Laboratory</strong> Sample Analysis(source: Phase 1 DP, Table 9-5)NuclideInstrument/MethodTarget Sensitivity,pCi/g (1)Am-241 Alpha and/or gamma spectrometry 1 (4)C-14 Sample oxidizer and liquid scintillation 2 (4)Cm-234/244 Alpha and/or gamma spectrometry 1 (4)Cs-137 Gamma spectrometry 0.1 (4)I-129 Gamma spectrometry 0.06 (2)Np-237 Alpha and/or gamma spec 0.01 (2)Pu-238 Alpha spectrometry 1 (2)Pu-239/240 Alpha spectrometry 1 (2)Pu-241 Liquid scintillation 15 (2)Sr-90 Liquid scintillation 0.9 (2)Tc-99 Gas flow proportional counting 3 (2)U-232 Alpha spectrometry 0.5 (2)U-233/234 Alpha spectrometry 0.2 (3)U-235 (-236) Alpha spectrometry 0.1 (3)U-238 Alpha spectrometry 0.2 (3)NOTES:(1)(2)(3)(4)Dependent on sample size, counting time, and so on.Approximately 10% of the most restrictive radionuclide-specific CG identified in Table5-14.25% of background for naturally occurring radionuclides.Standard laboratory MDCs.Rev. 1 91
WVDP Phase 1 CSAPThis page intentionally left blank.Rev. 1 92
WVDP Phase 1 CSAP13.0 DOCUMENTATION AND REPORTINGA variety of data collection activities for a variety of purposes will be conducted as part of the CSAP.These activities will, in general, produce reports that summarize and analyze data and also present thedata sets themselves. The reporting and documentation activities required by particular data collectiontasks will be specified in task-specific work plans. However, the requirements are as follows.The results from task-specific data collection activities (e.g., completing a premises-wide surface GWS)will be summarized and presented in formal reports. These reports will include, at minimum, the purposeof the data collection, the methods used to collect the data, a summary of the data results, a reference towhere complete data results are available, a review of data quality indicators (DQI), and an analysis, asappropriate. of the data results in the context of task-specific decision to be made.Field notebooks will be maintained through the course of field work to capture data collection detailspertinent to data interpretation and evaluation of data quality. Field data will be entered and notebookspreserved in a manner that prevents inappropriate modification or loss of data.All environmental data will be associated with coordinates of known and reported quality, as appropriate.In the case of subsurface samples (soil or groundwater), depths in relationship to a known and accurateelevation will be provided. All environmental data will be recorded, delivered, and preserved in anappropriate electronic format to facilitate storage, retrieval, dissemination, and analysis.DOE or its contractors will maintain CSAP-related data sets in an electronic format that facilitates theirmaintenance, integration, retrieval, dissemination, and analysis through the life cycle of Phase 1decommissioning activities. These data sets will include connections to Geographical InformationSystems to facilitate mapping, spatial interpretation, and presentation of the data sets for those data setsthat have spatial coordinates.Rev. 1 93
WVDP Phase 1 CSAPThis page intentionally left blank.Rev. 1 94
WVDP Phase 1 CSAP14.0 QUALITY ASSURANCE AND QUALITY CONTROLQA/QC measures will be employed throughout the CSAP data collection process to ensure that the dataproduced are of acceptable quality. As necessary, a QAPP will be prepared to cover all project QA/QCrequirements and activities that have not already been addressed by existing QA/QC proceduresassociated with the Phase 1 decommissioning process, consistent with the Phase 1 DP. Part of the QA/QCprocess is data validation. Data validation will take place as described in the Phase 1 DP QAPP.DQI are quantitative and qualitative measures of the usability of the selected measurement methods(laboratory and field-screening) for decision-making purposes. Such indicators include, but are notnecessarily limited to, the accuracy, precision, representativeness, completeness, and comparability of thedata. Data resulting from measurement instruments and methods will be evaluated in terms of theseindicators.• Accuracy addresses the potential for bias and lack of precision in laboratory analytical results andis typically monitored through the use of standards, spikes, blanks, and control charts, asappropriate, depending on the method. The accuracy requirement for off-site laboratory analysesis a relative standard error of 10%, as measured at the CG w value, after correcting for precision.• Precision reflects measurement variability as observed in repeated measurements of the samesubsample; for radio-analytical methods the required precision is reflected by required methoddetection limits. In other words, specifying the required detection limits (see Table 6) isequivalent to specifying the required method precision. Required method detection limits are asspecified in Section 12.• Representativeness is guaranteed by appropriate sampling and analytical protocols and bycollecting sufficient samples or obtaining sufficient measurements such that uncertaintiesintroduced by the heterogeneity of contaminated media are sufficiently controlled for decisionmakingpurposes. There is no formal quantitative requirement for representativeness;representativeness is monitored by ensuring that sampling and analytical protocols are, in fact,carried out during field and laboratory work and that the quantity of data collected is sufficient toallow decision-making with the necessary level of confidence.Rev. 1 95
WVDP Phase 1 CSAP• The data completeness goal for the CSAP is 80%, consistent with the Phase 1 FSSP.Comparability refers to how well data sets generated by CSAP work pertain to the decisions thatneed to be made. Comparability (or the lack thereof) is an aggregate QA measure that reflects theoverall level of accuracy, precision, completeness,and representativeness.A QA program will be conducted during data collection. In accordance with established procedures, theQA program will specify and measure the performance of measurement methods through the collection ofan appropriate number or frequency of QC samples. Such samples could include field and laboratoryblanks, field duplicates, laboratory replicates, and spiked samples. Field measurements will be calibratedon NIST-traceable standards at a frequency prescribed in the QAPP. Twice-daily response checks will beperformed for all field instruments before use. Corrective actions will be conducted if performance fallsoutside of expected ranges. Response checks will make use of control charts as described in Section 11.5.Corrective actions can include a variety of actions depending on the nature of the problem, and mayinclude replacing a detector, re-collecting data that may be suspect because of QA concerns, modifyingdata collection protocols to mitigate data problems that may have environmental or temporal components,and so on.All surveys and sample collection that are part of the CSAP will be performed in accordance withestablished QC requirements. Replicate surveys, sample recounts, instrument performance checks, chainof custody, control of field survey data and databases, and QC investigations provide the highest level ofconfidence in the data collected to support the survey outcome.In addition, QA/QC measures will ensure that trained personnel conduct surveys with approvedprocedures and properly calibrated instruments. Procedures will cover sample documentation, chain ofcustody, field and laboratory QC measurements, and data management. The CSAP contractor will berequired to develop and supply these procedures either as appendices to this plan or as stand-alone SOPs.Rev. 1 96
WVDP Phase 1 CSAP15.0 REFERENCESDOE (U.S. Department of Energy), 1996, Draft West Valley Demonstration Project Waste ManagementEnvironmental Impact Statement, Cattaraugus County, West Valley, New York.DOE, 2009, Phase I Decommissioning Plan for the West Valley Demonstration Project, Rev 2, preparedby Washington Safety Management Solutions, URS Washington Division, Science ApplicationsInternational Corporation, prepared for DOE, December.DOE, 2010, Final Environmental Impact Statement for Decommissioning and/or Long-Term Stewardshipat the West Valley Demonstration Project and Western New York Nuclear Service Center, Vol 1,DOE/EIS-0226, January.DOE, 2011, Phase 1 Final Status Survey Plan, West Valley Demonstration Project, Revision 1, <strong>Argonne</strong><strong>National</strong> <strong>Laboratory</strong>, prepared for DOE, May 31.EPA (U.S. Environmental Protection Agency), 2006, Guidance on Systematic Planning Using the DataQuality Objectives Process EPA QA/G-4, EPA/240/B-06/001, February.USACE (U.S. Army Corps of Engineers), 2003, NAVSTAR GPS Surveying, USACE EM 1110-1-1003,January 1.USACE, 2007, Engineering and Design: Control and Topographic Surveying, USACE EM 1110-1-1005,January 1.USAGC (U.S. Army Geospatial Center), 2009, West Valley Demonstration Project Cattaraugus County,New York GIS-Based Historical Photographic Analysis, Final Report, October.Wild 2000, Estimated Radionuclide Inventory for the NRC Licensed Disposal Area at the West ValleyDemonstration Project. Wild, R. E., URS/Dames & Moore, Orchard Park, NY, August, 2000.Rev. 1 97
WVDP Phase 1 CSAPThis page intentionally left blank.Rev. 1 98
WVDP Phase 1 CSAPAPPENDICESRev. 1 99
WVDP Phase 1 CSAPThis page intentionally left blank.
WVDP Phase 1 CSAPAPPENDIX AWMA 1 PRE-REMEDIATION DATA COLLECTIONA.1 BackgroundWaste Management Area 1 (WMA 1) is approximately 4.4 acres in size (see Figures A.1 and A.2for maps). WMA 1 includes facilities associated with processing spent fuel.Descriptions of the various features of WMA 1 follow and are taken from the Phase 1 DP,Section 3.1.2:Main Plant Process Building. The Main Plant Process Building (Process Building) was builtbetween 1963 and 1966. It was used by Nuclear Fuel Services (NFS) from1966 to 1971 torecover uranium and plutonium from spent nuclear fuel. The multi-story Process Buildingstructure is approximately 130 feet by 270 feet in area and rises approximately 79 feet aboveground at its highest point (not including the main stack). Most of the structure is constructed ofreinforced concrete. The major Process Building structure rests on approximately 476 driven steelH-piles. Most of the facility was constructed above grade, with some of the cells extending belowground (i.e., below the ground surface reference elevation of 100 feet) (Figure A.3). The deepestcell, the General Purpose Cell, extends approximately 27 feet below-grade. Some portions of theProcess Building extend into the Lavery Till.Liquid waste generated during reprocessing was managed in one of two ways, depending onactivity. High-level waste was transferred from the Process Building to the Waste Tank Farm(WMA 3) via two underground transfer lines (7P-113 and 7P-120) to Tank 8D-2 and Tank 8D-4.Low-level wastewater was transferred to the Low Level Waste Treatment Facility (WMA 2) viabelow-grade transfer lines associated with the Interceptor System (WMA 2).Fuel Receiving and Storage Area. On the east side of the Process Building stands the FuelReceiving and Storage Area. This steel-framed, steel-sheathed structure contains two fuel pools:the Cask Unloading Pool and the Fuel Storage Pool. These pools were used to receive and storespent fuel received for reprocessing, and extend approximately 49 and 34 feet below grade,respectively. The floor of the deeper pool lies 45 feet below grade at its lowest point.Rev. 1 A-1
WVDP Phase 1 CSAPVitrification Facility. The Vitrification Facility, which was constructed by the WVDP, isattached to the north side of the Process Building. The Vitrification Facility is a structural steelframe and sheet metal building housing the reinforced concrete Vitrification Cell, operatingaisles, and a control room. It is approximately 91 feet wide and 150 feet long with the peak of theroof standing approximately 50 feet high. The pit in the Vitrification Cell extends 14 feet belowgrade.Load-In/Load-Out Facility. The steel-framed, steel-sheathed Load-In/Load-Out Facility connectsto the west side of the Process Building as does the concrete block Main Plant Office Building.01-14 Building. The 60-foot tall concrete and steel frame 01-14 Building stands at the southwestcorner of the Process Building.Miscellaneous Structures. On the south side of the Process Building is the concrete-block UtilityRoom, with an addition known as the Utility Room Expansion, and the Laundry. The Fire PumpHouse and a large Water Storage Tank stand south of the Process Building and an ElectricalSubstation is located on the east side.The surface area surrounding buildings within WMA 1 is mostly covered with asphalt orconcrete. The area of grass-covered soils is limited.A.2 Physical SettingWMA 1 is located on the North Plateau. It is bounded to the west by WMA 10, to the north byWMA 3, to the east by WMA 2 and WMA 6, and to the south by WMA 6.The surface of WMA 1 consists primarily of building footprints and paved surfaces and isrelatively flat.The subsurface of WMA 1 consists of a relatively permeable sand and gravel layer that overliesthe impermeable Lavery Till (Figure A.4). Because of the depth of some portions of buildingfoundations and subsurface structures, some of them were constructed into the Lavery Till. Inaddition, portions of WMA 1 structure foundations are built on foundation pilings (approximatelyRev. 1 A-2
WVDP Phase 1 CSAP476) that extend into the Lavery Till, and in some cases through the Till into the Kent RecessionalSequence.Groundwater flow is, in general, towards the northeast. Groundwater flows primarily through therelatively permeable layer above the Lavery Till. The Lavery Till is relatively impermeable togroundwater flow; groundwater that does pass vertically through the Lavery Till enters the KentRecessional Sequence.There is known to be a significant amount of buried infrastructure (piping, etc.) associated withthe WMA 1 facilities.A.3 Area HistoryThe WMA 1 area surrounding the Process Building has undergone significant reworking sincethe initiation of NFS activities.Figure A.5 shows WMA 1 in 1962 prior to NFS site development. At this time WMA 1 wasfarmed.Figure A.6 shows WMA 1 in 1966. The bulk of the initial set of NFS buildings was complete bythis time.Figure A.7 shows WMA 1 in 1968. Some additional construction has taken place in the north partof WMA 1. The area around the buildings is grass/bare earth.Figure A.8 shows WMA 1 in 1977. There is some additional construction in the southwest cornerof WMA 1.Figure A.9 shows WMA 1 in 1984. The Vitrification Facility is now present along the northernend of WMA 1. Open areas within WMA 1 still appear to be grass covered/bare earth.Figure A.10 shows WMA 1 in 1995.Figure A.11 shows WMA 1 in 2007. By this time most open areas are paved.Rev. 1 A-3
WVDP Phase 1 CSAPA.4 Known and Suspected ReleasesA.4.1Cesium ProngPotentially Affected Media:Potentially Affected WMAs:surface soil, subsurface soil, sediments1, 2, 3, 4, 5, 6, 10, 12 NorthIn 1968, a ventilation system filter in the Process Building failed, releasing contaminatedparticulate up the Process Building stack. A mixture of radionuclides was released, with Cs-137predominant. Approximately 0.33 Ci particulate gross beta radioactivity was released. Thecontaminated particulate was deposited on surface soils, resulting in a large area of contaminationaround the Process Building and to the north-northwest. Detectable deposits extend several miles,including beyond the WVDP premises. WMAs 1, 2, 3, 4, 5, 6, 10, and 12 North likely areaffected. Because Cs-137 is predominant, this area of contamination is known as “the cesiumprong” (DOE 2009 Table 2-17, DOE 2010 Section 3.11.5).As originally deposited, surface soil activity concentrations should have decreased towards thenorth, away from WMA 1. However, the surface features of many areas within the WVDPpremises have been reworked significantly since the release; as a result, the current spatial anddepth distribution of soil contamination may be significantly different than the original footprint.In addition, the surface soil contamination likely has been naturally spread by erosion and runoffinto surface drainage features; this phenomenon may have enlarged the area impacted bydeposition, although detailed data regarding this effect are not available (DOE 2010 Section3.11.5).Finally, other releases from the Process Building stack may have produced minor impacts. Theseother releases include the 1968 failure of a dissolver off-gas system filter, resulting in 0.28 Ci ofparticulate activity, and the 1968 failure of a vessel off-gas system filter, resulting in the March1968 releases to exceed the monthly allowance by 15 percent (DOE 2010 Section 3.11.5).Rev. 1 A-4
WVDP Phase 1 CSAPA.4.2North Plateau Groundwater PlumePotentially Affected Media: subsurface soil, groundwater, sedimentPotentially Affected WMAs: 1, 2, 3, 4, 5, 6Several releases have contributed to a contaminated groundwater plume originating in the area ofthe Process Building. The plume is expected to have migrated towards the northeast, and to haveremained within the WVDP premises. There likely have been groundwater seeps to drainagefeatures, resulting in sediment contamination; these sediment impacts may extend beyond theWVDP premises. WMAs 1, 2, 3, 4, 5, and 6 likely are affected. Because this area is situated onthe North Plateau, the area of contamination is known as “the North Plateau GroundwaterPlume.” The predominant mobile contaminant in this plume is Sr-90.The major contribution to the plume occurred in 1968. (Other potential contributing releases arepresented in Sections A.4.3, B.4.3, C.4.3, and E.4.3.) Radioactive acid leaked into the subsurfaceat the southwest corner of the Process Building when Line 7P-240-1-C in the Off-Gas OperatingAisle (within the Process Building) failed. The leakage drained down to the underlying Off-GasCell and the adjacent southwest stairwell, then apparently flowed through an expansion joint inthe concrete floor of the Off-Gas Cell and migrated into the underlying sand and gravel. The leakreleased an estimated 200 gallons of radioactive nitric acid with approximately 93 Ci Sr-90 (DOE2009 Table 2-17).A.4.3Other Known and Suspected ReleasesA.4.3.1Wastewater Line LeakPotentially Affected Media:Potentially Affected WMAs:surface soil, subsurface soil, groundwater1, 2, 3, 4, 5, 6 (North Plateau Groundwater Plume)In 1967, the wastewater line to Tank 7D-13 (Line 7P-160-2-C) leaked an unknown amount ofradioactive wastewater during transfer from the tank. This release occurred near the south side ofthe Process Building. In 1974, the area around Tank 7D-13 was excavated to repair a sanitarysewer line. Radioactive groundwater and soil were encountered in the excavation. An exposurerate of 200 mR/hour beta-gamma was measured in the excavation and groundwater leakage intoRev. 1 A-5
WVDP Phase 1 CSAPthe sanitary sewer line was believed responsible for elevated gross beta and Sr-90 levels observedin the sewage outfall from 1972 through 1974 (DOE 2009 Table 2-17; DOE 2010 Section 3.11.5).This release likely has contributed to the North Plateau Groundwater Plume.A.4.3.2Waste Transfer FailurePotentially Affected Media:Potentially Affected WMAs:subsurface soil, groundwater1, 2, 3, 4, 5, 6 (North Plateau Groundwater Plume)In 1967, the wastewater line to Tank 8D-2 (Line 7P-170-2A) failed during waste transfer from theProcess Building to the tank (in WMA 3). The failure resulted in approximately 555 gallons ofliquid waste entering an acid recovery sump in the southwest corner of the Process Building anddraining to the Old Interceptor (in WMA 2). Resultant activity levels at the Old Interceptor weregreater than 100 mR/hr. The waste required pump-out back to the Process Building for treatment.This event led to installation of 12 inches of concrete shielding on the Old Interceptor floor. In2003, a gamma radiation level of 408 mR/h was measured near the Old Interceptor tank floor(DOE 2009 Table 2-17; DOE 2010 Section 3.11.5). This release likely has contributed to theNorth Plateau Groundwater Plume.A.4.3.3Laundry Line LeakPotentially Affected Media:Potentially Affected WMAs:surface soil, subsurface soil, groundwater1, 2, 3, 4, 5, 6 (North Plateau Groundwater Plume)In 2003, a hole was discovered in a riser for a wastewater drain line (drain line 15-ww-569) thatconnected the Laundry (on the south side of the Process Building) to the Interceptors (in WMA2). The initial date of the breach was unknown, no specific event was identified which wouldhave caused the breach, and the line was repaired. The hole had allowed contaminated laundrywater to leak into soils adjacent to the riser (in WMA 1) at a rate of approximately 900 gallonsper day. A sample of subsurface soil near the breach identified 3,300 pCi/g Cs-137 and 87 pCi/gAm-241, though the breached line might not have been the only contaminant source (DOE 2009Table 2-18; DOE 2010 Section 3.11.5). This release likely has contributed to the North PlateauGroundwater Plume.Rev. 1 A-6
WVDP Phase 1 CSAPA.4.3.4Process Building SpillsPotentially Affected Media:Potentially Affected WMAs:surface soil, subsurface soil, groundwater1, 2, 3, 4, 5, 6 (North Plateau Groundwater Plume)Additional spills and other forms of less significant releases were likely to have occurred in theimmediate vicinity of the Process Building. An example of these includes Resin Pit spills in thearea east of the Fuel Receiving and Storage Building. These spills were associated withmaintenance of the spent nuclear fuel pool water filtration system (DOE 2009 Table 2-17). Thesereleases likely have contributed to the North Plateau Groundwater Plume.A.4.3.5Sewage Treatment System ContaminationPotentially Affected Media:Potentially Affected WMAs:subsurface soil, groundwater, sediment1, 6, 12 South (Erdman Brook)Historically, the Process Building was connected to the Old Sewage Treatment Plant (in WMA 6)via an underground wastewater line. A 1970 to 1971 investigation of unexpected tritium andgross beta contamination in Erdman Brook led to the discovery of contamination in the sanitarysewer system. It was discovered that the underground wastewater line had failed near thesouthwest side of the Process Building. The resultant leak allowed contaminated groundwater inthe area to enter the Old Sewage Treatment Plant. An estimated 0.5 Ci gross beta and 0.05 Ci ofSr-90 was released. The Old Sewage Treatment Plant and its outfall drainage were contaminatedto 1 mR/h, with effluent concentrations subsiding after the leak was repaired. Affected outfallswere located in WMA 6 with eventual discharge to Erdman Brook (in WMA 12 South)(DOE 2009 Table 2-17; DOE 2010 Section 3.11.5).In addition, during the 1960s and 1970s, the Old Sewage Treatment Plant experienced severalcontamination events, some of which were expressed as radioactivity increases in the treatedeffluent. The Old Sewage Treatment Plant outfall drainage extends approximately 650 feet southof a culvert near the Old Warehouse (also in WMA 6), and flows into the first culvert under therailroad tracks on the South Plateau (in WMA 6), and then to Erdman Brook (in WMA 6 andWMA 12 South).Rev. 1 A-7
WVDP Phase 1 CSAPA.4.3.6Interceptor System Operational ReleasesPotentially Affected Media: surface soil, subsurface soil, groundwaterPotentially Affected WMAs: 1, 2During NFS operations, several incidents such as inadvertent transfers of higher-than-intendedactivity occurred in the Interceptor system (in WMA 2), upstream of the Lagoons (also inWMA 2). Documented accounts of leakage and spills in the Interceptor area corroborate thegenerally elevated observed subsurface soil contamination in the area between Lagoon 1 and theProcess Building. Localized subsurface soil contamination can be attributed to these unintendedoperational releases.A.4.3.7Waste Tank Farm Condensate Line LeakPotentially Affected Media: subsurface soil, groundwaterPotentially Affected WMAs: 1, 3Several leaks occurred between 1968 and 1977 that were associated with a condensate line (Line8P-46-6-A5) from Tank 8D-2. The leaks occurred in the section of the line between theEquipment Shelter (in WMA 3) and the Process Building acid recovery pump room (in WMA 1).This line was maintained under vacuum. An unexpected 16,400-gallon liquid volume increase inTank 8D-2 was attributed to groundwater leaking into the line and being drawn into the tank.There is no surface evidence of out-leakage, but the possibility exists of localized groundwatereffects (DOE 2009 Table 2-17; DOE 2010 Section 3.11.5).A.4.3.8Process Building Stack ReleasePotentially Affected Media: surface soilPotentially Affected WMAs: 1, 3In 2001, airborne particulate was released in droplet form from the stack of the Process Building.Excess moisture appears to have become entrained in the ventilation system, and was emittedfrom the stack as droplets containing radioactive particulates. The release occurred over a periodof two months (September – October 2001). The radioactivity release rate was too low to result inRev. 1 A-8
WVDP Phase 1 CSAPany stack monitoring alarms. The release was discovered during routine radiation surveysconducted in November 2001 when workers found fixed radioactivity in unexpected locationsnear the Process Building stack. Total releases were less than 0.5% of the administrative releaselimits. Measurements of 4.8E-04 uCi gross beta were recorded. The fallout was confined to thearea several hundred feet from the Process Building, in WMA 1 and WMA 3. Accessible abovebackgroundspots were decontaminated (DOE 2009 Table 2-18; DOE 2010 Section 3.11.5).A.5 Existing DataExisting data sets for this area include:• In 1982, static direct exposure readings were collected across the WVDP premises(WVNSCO 1982). A portion of WMA 1 was covered by these measurements on a 10-mgrid. Figure A.12 shows these results color-coded by the exposure readings encountered.These data indicated the potential for significant surface contamination within the WMA1 boundary; their interpretation, however, is complicated by potential shine from theProcess Building.• In 1990 and 1991, a second static direct exposure measurement program was conductedacross the WVDP premises, including the accessible portions of WMA 1(WVNSCO 1992). This data collection used different instrumentation and protocols thanthe 1982 study, so the results are not quantitatively comparable. Figure A.13 shows theseresults. These data show a significant change for the western and southern portions ofWMA 1, with significantly lower measured gross activity than the 1982 study. There area couple of possible explanations for the decrease: (1) this could reflect the removal ofcontaminated surface soil associated with maintenance and construction activities aroundWMA 1; or (2) it could reflect the placement of surface material (e.g., gravel orpavement) on top of contaminated soils; or (3) it could be that the 1982 readings wereaffected by shine from Process Building and associated structures whose sources weremitigated by decommissioning activities in the intervening years.• There is some soil sampling data for WMA 1 available within ELIMS. Figure A.14shows the locations of soil cores with subsurface soil samples. There are no sediment orsurface soil results for WMA 1. The bulk of the data were collected either in 1993, 1994,Rev. 1 A-9
WVDP Phase 1 CSAP1998, or 2008, and most targeted the North Plateau Groundwater Plume source areaadjacent to and beneath the Process Building. The exception is location SNLAUB1, a soilsample collected in 2004 from an unreported depth just east of the utility room and northof the utility room expansion. Table A.1 summarizes which radionuclides have data forWMA 1.Each core from WMA 1 had at least one subsurface soil sample analyzed for Sr-90 andyielded at least one detectable Sr-90 result. The results ranged from approximately 0.1pCi/g along the southern boundary of WMA 1 (BH-20) to more than 9,000 pCi/g (GP-7608) directly beneath the center of the Process Building. Figure A.15 shows a profileview for some of these cores with their Sr-90 results.• There is a significant amount of groundwater data for WMA 1 available within ELIMSfrom historical characterization work addressing the North Plateau Groundwater Plume.These data were obtained from monitoring wells and from groundwater samples obtainedby GeoProbe. Figures A.16 and A.17 show the locations of groundwater data collectioncolor-coded by Sr-90 and tritium results, respectively. The detection limits for Sr-90 andtritium varied widely among ELIMS samples. 10 pCi/L and 500 pCi/L were selected asthresholds for Sr-90 and tritium, respectively, because based on ELIMS data resultsabove these activity concentrations were consistently above method detection limits andso indicative of contamination impacts rather than simply measurement error.Contamination was encountered throughout WMA 1 and was dominated by Sr-90, withhighest concentrations immediately down gradient of the presumed 1968 release point,and lowest concentrations along the southern boundary of WMA 1.A.6 Planned Phase 1 DP ActivitiesFor a more complete description of planned Phase 1 DP activities, see the Phase 1 DP, Section3.1 and Section 7.3.All buildings within WMA 1 are slated for demolition and removal as part of Phase 1 activities aswell as the three underground waste water tanks and the underground lines that fall within theexcavation footprint.Rev. 1 A-10
WVDP Phase 1 CSAPThe deep excavation currently planned for WMA 1 would cover approximately 3 acres. Thelateral extent of the excavation is not expected to deviate significantly from the design (FigureA.18). In fact, along its eastern and northeastern edges, the excavation will be constrained by animpermeable barrier slurry wall; and to the south, west, and northwest, the excavation will beconstrained by sheet piling that will serve as a groundwater barrier wall. In the case of theimpermeable slurry wall, the excavation floor will extend to the wall, and excavation mayactually continue into the wall to address contamination. In the case of the sheet piling,excavation will be sloped up to the sheet piling at an angle of 45 degrees to provide stability.Figure A.18 shows a plan view and cross section of the planned excavation. The slurry wall willremain in place after the WMA 1 excavation is complete and backfilled; however the sheet pilingwalls will be removed after backfilling is complete.Excavation will continue vertically into the Lavery Till at least one foot until cleanup goals havebeen achieved. The Phase 1 DP has specified cleanup goals to be achieved prior to excavationhalting.Beneath the Process Building there are about 476 foundation pilings that extend into, and in somecases through, the Lavery Till. These will be cut below the final excavation grade and left inplace (Figure A.19).A.7 <strong>Conceptual</strong> <strong>Site</strong> <strong>Model</strong>Based on the available information, the conceptual site model (CSM) for WMA 1 is as follows. Anumber of releases within the WMA 1 footprint are known to have occurred, or may haveoccurred, and likely impacted surface and subsurface soils and groundwater. The most significantof these were the 1968 stack release that produced the cesium prong and the 1968 subsurfacerelease that produced the North Plateau Groundwater Plume. In addition to these two majorreleases, there were several known or suspect releases associated with building infrastructure andprocesses that likely contributed to surface soil, subsurface soil, and groundwater contaminationand that may have resulted in more localized contamination at significant levels.After initiation of the WVDP, portions of the surface of WMA 1 underwent significantreworking. This reworking occurred primarily along the western and northern portions of WMA 1and included the construction of the Vitrification Facility. This reworking may have coveredRev. 1 A-11
WVDP Phase 1 CSAPcontaminated surface soils with clean cover, removed contaminated surface soils for dispositionelsewhere, and/or re-used contaminated soils as backfill for building foundations or buriedinfrastructure. The sharp change in direct gamma reading results within WMA 1 between 1982and 1991 indicates that there may have been a significant change in contamination status of theimmediate WMA 1 surface.Groundwater flow underneath WMA 1 is expected to be, in general, towards the northeast. Thecore of the North Plateau Groundwater Plume has been steadily migrating in aneasterly/northeasterly direction. There likely are high activity concentrations of less mobileradionculides such as Cs-137 sorbed to soils in the immediate vicinity of the original release. TheLavery Till is expected to have acted as a barrier to vertical Sr-90 migration. Limited soil coresthat include samples from the top of the Lavery Till have confirmed this is the case.There are concerns that the foundation pilings beneath the Process Building may providepreferential flow pathways for vertical migration of contaminated groundwater into andpotentially through the Lavery Till. Presently these pilings are inaccessible for characterization,but as part of the planned decommissioning activities these pilings will be exposed and thepossibility of vertical contaminant migration into the Lavery Till will be evaluated at that time.Figure A.20 shows the current CSM for surface soils. The assumption is that all surface soils inWMA 1 area to a depth of one meter possibly contain contamination above CG w standards.Figure A.21 shows the CSM for soils deeper than 1 m. The assumption is that there is thepotential across WMA 1 for subsurface soils to have impacts greater than background conditions.Figure A.22 shows the CSM for contaminated groundwater beneath WMA 1. The assumption isthat groundwater across WMA 1 has the potential for contamination above background levels.A.8 WMA 1-Specific Characterization Goals• Develop an inventory of buried infrastructure• Evaluate appropriateness of the current list of ROI• Verify absence of additional ROI• Determine level and extent of surface contamination• Identify the presence/absence of subsurface soil contamination• Identify soil waste stream characteristicsRev. 1 A-12
WVDP Phase 1 CSAP• Define required extent of WMA 1 excavation• Obtain data to support Phase 2 planning• Obtain geotechnical data required for barrier wall designA.9 CSAP Pre-Remediation Data Collection and Associated Decision-MakingCSAP pre-remediation data collection will consist of a number of components described in moredetail below.A.9.1Buried InfrastructureThe footprint of buried infrastructure will be identified and mapped with a focus on areas outsidethe planned excavation and infrastructure that crosses into the planned excavation. A significantamount of buried infrastructure is believed to exist within WMA 1, and in particular in thewestern portion of WMA 1. This infrastructure would include waste and wastewater lines as wellas other buried utilities. [required]A.9.2Gamma Walkover Survey DataThe purpose of performing a gamma walkover survey of the WMA 1 area is to identify the leveland extent of surface contamination. This includes both general trends in average activityconcentrations pertinent to the surface soil CG w requirement, as well as the identification ofisolated, more-elevated anomalies that might be indicative of discrete releases and/or surface soilCG emc concerns.A complete (100%) logged gamma walkover survey (GWS) will be conducted for accessibleareas within WMA 1. Examples of areas that would not be accessible are existing buildingfootprints and building pads. Based on the GWS results, surface soil within WMA 1 will bedivided into four categories: (1) surface soils where GWS data indicate contamination above CG wrequirements; (2) surface soils where GWS data indicate contamination, but it is not clear ifcontamination exceeds surface soil CG w requirement; (3) surface soils where GWS indicateimpacts, but those impacts are not expected to exceed surface soil CG w standards; and (4) surfacesoils where there is no indication of impacts above background conditions. The purpose of thisRev. 1 A-13
WVDP Phase 1 CSAPdata collection is to provide insights into the spatial distribution of surface contamination, and toguide subsequent soil sampling. [required]A.9.3Surface Soil SamplingSurface soil sampling will be used to address areas inaccessible to GWS data collection, toresolve hot spots identified by the GWS data, and to evaluate the presence, absence, and/or extentof surface contamination above surface soil CG w requirements based on GWS results.• Hot Spots. If GWS data indicate the presence of contamination that possibly exceeds“hot spot” (CG emc ) standards or an isolated elevated area is identified that appearsindicative of a discrete release, the location of concern will be sampled with a biasedsample. Within WMA 1, hot spots will be biased sampled if they are outside the plannedWMA 1 deep excavation footprint. If biased samples are collected from a particularlocation, they will be collected from two depth intervals: 0 – 15 cm, and 15 cm – 1 m.The 0–15 cm samples will be analyzed for the 12 radionuclides of potential interest inaddition to the 18 ROI. One down-hole gamma scan will be conducted from each biasedlocation. The purpose of these samples is to resolve GWS anomalies, evaluate theappropriateness of the current ROI list, and verify the absence of additional ROI.[contingent]• CG w Sampling. Surface soil sampling may be conducted after the GWS to further clarifyresults, with the level and nature of sampling dependent on GWS results. For WMA 1,surface soil CG w sampling in response to GWS results will primarily focus on areas thatare currently not paved and that are not within the planned WMA 1 excavation footprint.oIf GWS results indicate contamination impacts above background levels but thatsurface soil contaminant levels exceeding surface soil CG w requirements are unlikely,the area of interest will be systematically sampled using a triangular grid with adensity of one sample per 400 m 2 . One sample will be collected from each locationrepresentative of a 0-15 cm depth interval. The purpose is to document the maximumactivity concentrations present in surface soils within WMA 1. [contingent]Rev. 1 A-14
WVDP Phase 1 CSAPoIf GWS results indicate surface soil contaminant levels exceeding surface soil CG wrequirements likely exist, one sampling location will be selected at the highest grossactivity level to confirm surface soil CG w exceedances and another set of samplinglocations will be identified to spatially bound the extent of contamination (i.e., alongthe boundary of what is considered likely above surface soil CG w requirements) ifthis is not obvious from the GWS data. Two samples will be collected from thelocation targeting high gross activity levels, one representative of a 0 – 15 cm depthinterval, and one representative of a 15 cm – 1 m depth interval. One sample will becollected from each location intended to laterally bound contamination,representative of a 0-15 cm depth interval. In addition, the location targeting highgross activity levels will have a down-hole gamma scan conducted with staticmeasurements taken every 15 cm. The purpose is to document surface soil CG wrequirement exceedances and bound the lateral extent of contamination. [contingent]oIf GWS results indicate areas with surface soil contamination impacts but it is unclearwhether surface soil CG w requirement exceedances are present, at most five samplinglocations will be selected that systematically cover the areas of interest. One samplewill be collected from each location representative of a 0-15 cm depth interval. Thepurpose is to resolve the question of whether surface soil CG w requirementexceedances exist for areas where GWS results are ambiguous. [contingent]oIf any 0-15 cm interval yields a sample result indicating a surface soil CG wrequirements exceedance and that sample location is not laterally bounded either byexisting sampling locations with results less than surface soil CG w requirements or byGWS data that clearly indicate contamination is not a concern, additional samplinglocations will be selected so that the contamination encountered is spatially bounded.The purpose is to laterally bound contamination that is above CG w requirements.[contingent]In addition, because of the pavement/surface cover present for much of WMA 1 and thesignificant amount of surface soil reworking that occurred historically, contamination inthe top 1 m of soils may be covered by clean material/pavement and may not be readilydetectable by GWS scans. Areas of WMA 1 that are outside the planned excavationfootprint will be systematically sampled to a depth of 1m. Systematic sampling locationsRev. 1 A-15
WVDP Phase 1 CSAParranged on a triangular grid with a 20-m grid spacing will be used to evaluate thecontamination status of the top 1m of soil. Approximately 15 sampling locations will berequired. Each location will have one sample collected to a depth of 1 m. In addition,each will have a down-hole gross activity scan with one measurement taken each 15 cm.[required]A.9.4Subsurface Soil SamplingSubsurface soil sampling within WMA 1 has three purposes: (1) to determine presence andvertical extent of contamination impacts above background levels for WMA 1 areas along theedge of and outside the planned deep excavation, (2) to estimate waste stream volumes in supportof the planned WMA 1 deep excavation, and (3) to provide geotechnical and contamination statusinformation for the footprints of the slurry and sheet walls.• WMA 1 Waste Characterization. Subsurface soil cores will be obtained within thefootprint of the planned WMA 1 excavation to address contaminated soil volumeestimation needs. Of the three acre excavation footprint, only approximately 1.2 acreswould likely be readily accessible for intrusive subsurface sampling. This 1.2 acres isabout evenly divided between the western edge of the excavation, the northeastern cornerof the excavation, and the southeastern corner of the excavation. Sixteen core locationswill be placed within these accessible areas to a depth of 1 m into the Lavery Till. Thecores will be located to provide systematic coverage of the accessible areas(approximately one core per 300 m 2 ). Each one meter interval of each core will be subsampledin a fashion to obtain a representative sample, and those samples submitted forquick turn-around analysis of Sr-90 and Cs-137. With an average expected depth-to-tillof 35 feet, approximately 192 samples will be collected and analyzed. These data will beused to estimate waste stream volumes resulting from the excavation of WMA 1.[required]• Sheet Piling Footprint Characterization. Subsurface soil coring, scanning, andsampling will take place along the western and southern boundaries of the plannedexcavation, as well as the portions of the northern boundary associated with the sheetpiling footprint, to confirm the contamination status of adjacent surface and subsurfacesoils. An initial set of approximately 30 locations will be sampled; these locations will beRev. 1 A-16
WVDP Phase 1 CSAPseparated by 10 m (Figure A.23). At each location, one core that extends 1 m into theLavery Till will be retrieved. A down-hole scan will be conducted to the extent possibleat each location with a static measurement every 30 cm. Each core will be divided into 1m segments.oA variety of geotechnical field data will be collected from each core location, asnecessary and required for sheet piling/slurry wall design. In addition soil sampleswill be collected and submitted for geotechnical analyses (e.g., grain size, Atterberglimits, triaxial strength, etc.) as required by sheet piling/slurry wall design.[required]oAt minimum, the following soil core segments will be submitted for laboratoryradiological analysis: the top meter (representative of surface soils), the meterdirectly above the Lavery Till, the top meter of Lavery Till, and the meter straddlingthe water table. In addition, if the bore/core scan identifies an elevated zone notincluded in one of these three, the meter interval containing the elevated zone will besubmitted for laboratory radiological analysis. [required]oFrom each location three groundwater samples will be collected: one from the watertable, one from immediately above the Lavery Till, and one midway between thesetwo, if possible. [required]oIf any interval other than the top 1 m identifies contaminants above backgroundlevels, then additional soil core locations will be placed on a triangular grid with aseparation of 10 m to from the location(s) of concern in a manner that bounds theoriginal contamination as the terrain allows and sampled as described above. Thisprocess will continue until the lateral extent of subsurface contamination is boundedoutside the planned excavation footprint. If extensive subsurface contamination isencountered a field decision may be made to increase the separation distance betweenthe original set of core locations and the next set of bounding core locations. Theultimate intent is to spatially bound subsurface contamination to the south, west, andnorth of the planned WMA 1 excavation. This sampling may extend into WMA 3,10, and 6 as necessary. In the case of WMA 3, sampling will not extend beyond theplanned slurry wall footprint. [contingent]Rev. 1 A-17
WVDP Phase 1 CSAP• Slurry Wall Footprint Characterization. Subsurface soil coring and scanning will takeplace following the planned impermeable slurry wall footprint along the northern andeastern portion of the WMA 1 excavation. These cores will be separated by 20 m (FigureA.23). Approximately 13 cores will be required (two of these are shared with sheet pilingfootprint characterization locations). At each core location, one core will be retrieved thatextends one meter into the Lavery Till. A down-hole scan will be conducted to the extentpossible at each location with a static measurement every 30 cm. Each core will bedivided into one meter segments.oSubsurface soil sampling, groundwater sampling, and core scanning protocols will bethe same for soil cores from the slurry wall footprints as for sheet piling footprints.[required]oA variety of geotechnical field data will be collected from each core location, asnecessary and required for sheet piling/slurry wall design. In addition soil sampleswill be collected and submitted for geotechnical analyses (e.g., grain size, Atterberglimits, triaxial strength, etc.) as required by sheet piling/slurry wall design.[required]:• Additional Contingencies.oIf any 0-15 cm surface soil sample result indicates contamination impacts abovebackground levels and there was not a 15 cm – 1 m sample collected from thatlocation, a 15 cm – 1 m sample will be collected from that location following theprotocols used for the original 0-15 cm surface soil sample. In addition, each soillocation will have one down-hole gamma scan conducted at the center of the locationwith static measurements taken every 15 cm. [contingent]oIf a 15 cm - 1 m sample result exceeds background levels, then an additional samplefrom a depth of 1–2 m will be collected and analyzed from that location. In addition,down-hole gamma data will be collected from the location with static measurementscollected for every 15-cm depth interval. If that sample has contamination abovebackground conditions, then the next deeper 1-m interval will be sampled andRev. 1 A-18
WVDP Phase 1 CSAPanalyzed and a down-hole gamma scan performed. This process will continue untilbackground conditions are reached. [contingent]oIf systematic subsurface sampling identified contamination that appears to extendlaterally beyond the boundaries of WMA 1, such as into WMA 3, WMA 6, orWMA 10, then the grid will be extended and additional sampling conducted until thelateral extent of contamination has been bounded. In the case of WMA 3, samplingwill not extend beyond the planned slurry wall footprint. [contingent]A.9.5Buried Infrastructure Soil SamplingSoils associated with buried infrastructure of potential concern within WMA 1 will be sampled todetermine their contamination status. Buried infrastructure that is of potential concern in WMA 1is defined to be buried infrastructure that either carried contaminated waste/wastewater or wasinstalled after 1968.• Two locations along each piece of buried infrastructure that is of concern within WMA 1will be trenched. These locations will be selected to maximize the possibility thatcontamination will be encountered (e.g., locations where historical or current GWS dataindicate surface contamination exists). For infrastructure that crosses the planned WMA 1excavation boundary, one of these locations will be at the boundary. Trenching will nottake place within the planned WMA 1 excavation footprint. During excavation, exposedsoils will be monitored by scans for evidence of elevated gross activity. The purpose ofthis sampling is to evaluate the presence of contaminated soils associated with buriedinfrastructure. [required]oIf elevated readings are encountered below a depth of 1 m, soils exhibiting thehighest levels of gross activity will be sampled and analyzed.oIf elevated readings are not encountered below a depth of 1 m, a samplerepresentative of soils deeper than 1 m will be collected. In the case of infrastructurethat did not carry waste or wastewater, the sample will be from soils immediatelyabove the line. In the case of infrastructure that did carry waste or wastewater, thesample will be from soils immediately beneath the line.Rev. 1 A-19
WVDP Phase 1 CSAP• If contamination above background conditions is encountered at any selected location,trenching will continue to depth until background conditions are observed. An additionalsample will be collected from the base of the trench to verify background conditions. Thepurpose is to vertically bound observed contamination. [contingent]• If buried infrastructure soil sampling identifies contamination impacts greater thanbackground, biased sampling will continue following the line until at least twoconsecutive locations yield soil samples below surface soil CG w requirements. Locationspacing will be based on engineering judgment, including the geometry of the line, thelevel of contamination encountered, and surface evidence of contamination. Buriedinfrastructure characterization will not extend into the planned WMA 1 deep excavationfootprint. The purpose of this sampling is to bound the extent of contamination associatedwith buried infrastructure, as necessary. [contingent]A.9.6Additional ContingenciesSampling and/or GWS data may indicate that contamination exists or extends beneath surfacescurrently covered by existing structures, concrete, asphalt, or hardstand material. In this case,“surface soil” will be defined as soil immediately beneath the cover. If sampling or GWS dataindicate that contamination may exist beneath existing structures (e.g., existing buildings andbuilding pads), then sampling locations will be offset along the foundation edge to determinecontamination extent. The purpose of the offset is to allow safe acquisition of data. Datacollection through building pads and hardstands in WMA 1 will not be required as part of thiseffort.A.9.7Required <strong>Laboratory</strong> AnalysesAll samples will be submitted for analysis of all 18 ROI.A select portion of the samples as described above may be analyzed for the additional12 radionuclides of potential interest. In addition, ten percent of soil samples collected outside theWMA 1 excavation footprint will also be analyzed for the 12 radionuclides of potential interest. Ifthese sample results indicate the presence of the one or more of those radionuclides at levels ofRev. 1 A-20
WVDP Phase 1 CSAPpotential significance, then the balance of samples from WMA 1 will also be analyzed for theadditional radionuclides that were identified.Table A.2 summarizes the required sample numbers and the estimated number of contingencysamples for WMA 1.This sampling plan assumes that quick turn-around analyses are available for Sr-90 and Cs-137and that soil samples will be screened for Sr-90 and Cs-137 prior to being analyzed for thebalance of the ROI. Contingency sampling requirements as described above may be initiatedbased on these screening data.A.9.8Decision-Making SummaryA summary of decision-making based on the WMA 1 data is as follows:• If GWS data indicate anomalies are present outside the planned excavation footprint,biased samples will be selected to target those anomalies.• If sample results from biased or systematic surface samples for the 15 cm – 1 m depthinterval indicate contamination above CG requirements, an additional sample from thatlocation representing the depth interval 1–2 m will be collected and this process will berepeated until contamination is vertically bounded.• If scans of soil cores along the WMA 1 excavation boundary or slurry wall indicateintervals with elevated activity, the interval with the highest activity will be targeted foranalysis.• If one or more soil cores along the WMA 1 excavation boundary encounter soilcontamination at depths greater than 1 m, additional locations will be selected further tothe outside of the WMA 1 excavation boundary to laterally bound contamination.• For each set of buried infrastructure that is identified as a potential concern, at least twotrenches that uncover the infrastructure will be scanned and sampled. If contaminationRev. 1 A-21
WVDP Phase 1 CSAPappears to extend laterally along the line of the infrastructure, additional sampling willtake place until contamination is bounded.A.10 ReferencesDOE 2009. Phase I Decommissioning Plan for the West Valley Demonstration Project, Rev 2,prepared by Washington Safety Management Solutions, URS Washington Division,Science Applications International Corporation, prepared for DOE, December 2009.DOE 2010. Final Environmental Impact Statement for Decommissioning and/or Long-TermStewardship at the West Valley Demonstration Project and Western New York NuclearService Center, Vol 1, DOE/EIS-0226, January 2010.Rev. 1 A-22
WVDP Phase 1 CSAPTable A.1 Historical Data AnalysesNuclide# of SurfaceSoilLocations# ofSubsurfaceSoilLocations# of SedimentLocationsAm-241 0 21 0C-14 0 20 0Cm-243 0 14 0Cm-244 0 14 0Cs-137 0 25 2I-129 0 20 0Np-237 0 13 0Pu-238 0 21 0Pu-239 0 21 0Pu-240 0 21 0Pu-241 0 22 0Sr-90 0 24 0Tc-99 0 21 0U-232 0 19 0U-233 0 18 0U-234 0 18 0U-235 0 18 0U-238 0 19 0Rev. 1 A-23
WVDP Phase 1 CSAPTable A.2 Sample Number EstimatesRequired Contingent TotalSystematic Sediment Samples0 0 0(0-15 cm)Systematic Sediment Samples (150 0 0cm - 1 m)Contingent Surface Soil Samples0 10 10to Clarify GWS ResultsSystematic Surface Soil Samples15 0 15(0-15 cm)Systematic Surface Soil Samples20 0 20(15 cm - 1 m)Biased Surface Soil Samples0 3 3(0-15 cm)Biased Surface Soil Samples (150 3 3cm - 1 m)Systematic Subsurface Soil332 58 390Samples (1-m intervals)Biased Subsurface Soil Samples0 5 5(1-m intervals)Buried Infrastructure Soil18 12 30SamplesGroundwater Samples 90 36 126Total: 475 127 602Rev. 1 A-24
WVDP Phase 1 CSAPFigure A.1 WMA 1 Facilities (from Phase 1 DP, Figure 3-10)Rev. 1 A-25
WVDP Phase 1 CSAPFigure A.2 WMA 1 with TopographyRev. 1 A-26
WVDP Phase 1 CSAPFigure A.3 Process Building Subsurface Structures (from Phase 1 DP, Figure 7-5)Rev. 1 A-27
WVDP Phase 1 CSAPFigure A.4 North Plateau Cross-Section (from Phase 1 DP, Figure 3-6)Rev. 1 A-28
WVDP Phase 1 CSAPFigure A.5 WMA 1 Aerial Photograph from 1962Rev. 1 A-29
WVDP Phase 1 CSAPFigure A.6 WMA 1 Aerial Photograph from 1966Rev. 1 A-30
WVDP Phase 1 CSAPFigure A.7 WMA 1 Aerial Photograph from 1968Rev. 1 A-31
WVDP Phase 1 CSAPFigure A.8 WMA 1 Aerial Photograph from 1977Rev. 1 A-32
WVDP Phase 1 CSAPFigure A.9 WMA 1 Aerial Photograph from 1984Rev. 1 A-33
WVDP Phase 1 CSAPFigure A.10 WMA 1 Aerial Photograph from 1995Rev. 1 A-34
WVDP Phase 1 CSAPFigure A.11 WMA 1 Aerial Photograph from 2007Rev. 1 A-35
WVDP Phase 1 CSAPFigure A.12 WMA 1 1982 Direct Gamma Measurement ResultsRev. 1 A-36
WVDP Phase 1 CSAPFigure A.13 WMA 1 1990-1991 Direct Gamma Measurement ResultsRev. 1 A-37
WVDP Phase 1 CSAPGP-10108GP-10308BH-21AGP-78GP-7808GP-10808GP-83GP-8308GP-86GP-73GP-72GP-7208GP-10408GP-7508GP-7608GP-10008GP-75GP-30GP-3008GP-8008GP-77GP-80SNLAUB1BH-18BH-20Figure A.14 WMA 1 Historical Sampling LocationsRev. 1 A-38
WVDP Phase 1 CSAPFigure A.15 Profile View of Cores with Sr-90 Results (pCi/g)Rev. 1 A-39
WVDP Phase 1 CSAPFigure A.16 WMA 1 Sr-90 Groundwater ResultsRev. 1 A-40
WVDP Phase 1 CSAPFigure A.17 WMA 1 Tritium Groundwater ResultsRev. 1 A-41
WVDP Phase 1 CSAPFigure A.18 Phase 1 WMA Excavation with A-A’ Cross-Section (taken from Phase 1 DP,Figure 7-6 and Figure 7-7)Rev. 1 A-42
WVDP Phase 1 CSAPFigure A.19 Foundation Piling LocationsRev. 1 A-43
WVDP Phase 1 CSAPFigure A.20 Initial WMA 1 Surface Soil CSMRev. 1 A-44
WVDP Phase 1 CSAPFigure A.21 Initial WMA 1 Subsurface Soil CSMRev. 1 A-45
WVDP Phase 1 CSAPFigure A.22 Initial WMA 1 Groundwater CSMRev. 1 A-46
WVDP Phase 1 CSAPFigure A.23 Example Soil Core LocationsRev. 1 A-47
WVDP Phase 1 CSAPThis page intentionally left blank.Rev. 1 A-48
WVDP Phase 1 CSAPAPPENDIX BWMA 2 PRE-REMEDIATION DATA COLLECTIONB.1 BackgroundWaste Management Area 2 (WMA 2) is approximately 14 acres in size (see Figures B.1 and B.2for maps). WMA 2 includes facilities historically used for managing low-level radioactivewastewater generated on site.Descriptions of the various features of WMA 2 follow, and are taken from the Phase 1 DP,Section 3.1.2:Low-Level Wastewater Building. The Low-Level Wastewater (LLW2) Building is locatedtowards the center of WMA 2, southwest of Lagoon 4. This pre-engineered, single-story, metalsidedbuilding rests on a concrete wall foundation, measuring 40 feet by 60 feet. The buildinghouses two skid-mounted process equipment modules that are used to treat wastewater fromWMA 1 and WMA 2, and radiologically contaminated groundwater from the WMA 7 NDAInterceptor Trench, groundwater collected from within the tank farm in WMA-3, andgroundwater collected from the North Plateau Groundwater Recovery System. The LLW2Building was built in 1998 to replace the adjacent O2 Building. The O2 Building was the originallow-level wastewater treatment facility that was built by NFS in 1971, decommissioned in the1990s, and demolished to slab in 2006 (see discussion of O2 Building below).Lagoons. From 1965 to 1971, low-level wastewater was routed from the Old and/or NewInterceptors through Lagoons 1, 2, and 3 in series before discharge to Erdman Brook. In 1971, thelow-level waste treatment facility system was installed; this system initially consisted of the O2Building and Lagoons 4 and 5, and now consists of the LLW2 Building and Lagoons 4 and 5.Between 1971 and 1982, low-level wastewater was routed sequentially from the Interceptorsthrough Lagoon 1, Lagoon 2, and the O2 Building for treatment, then to Lagoon 4 or 5, andfinally to Lagoon 3 before discharge to Erdman Brook. Lagoon 1 was closed in 1984; from 1984to the present, low-level wastewater has been routed sequentially through Lagoon 2, the O2Building or LLW2 Building for treatment, Lagoon 4 or 5, and finally to Lagoon 3 beforedischarge to Erdman Brook through a permitted outfall (SPDES WNSP001).Rev. 1 B-1
WVDP Phase 1 CSAP• Lagoon 1 was an unlined basin excavated into the sand and gravel unit. It measuredapproximately 80 feet long on each side and 5 feet deep. It had a storage capacity of morethan 200,000 gallons. Lagoon 1 was fed directly from the Old Interceptor and the NewInterceptors. It was removed from service in 1984. Most of the contaminated sediment wastransferred to Lagoon 2. Lagoon 1 was filled with contaminated debris from the OldHardstand (WMA 5), including contaminated asphalt, soil, and vegetation, and then cappedwith clay and topsoil.• Lagoon 2 is an unlined basin excavated in the un-weathered Lavery Till. It measuresapproximately 200 feet long by 100 feet wide and 17 feet deep. It has a storage capacity of2.4 million gallons. Historically, Lagoon 2 was fed directly by Lagoon 1; therefore it containscontaminated sediments from the 1984 Lagoon 1 closure. Currently, Lagoon 2 is fed directlyfrom the New Interceptors, the NDA interceptor trench, the tank farm and at times the NorthPlateau Groundwater Recovery System; it is part of the Low-Level Water Treatment Facility.• Lagoon 3 is an unlined basin excavated in the un-weathered Lavery Till. It measuresapproximately 230 feet long by 130 feet wide and 24 feet deep. It has a storage capacity of3.3 million gallons. Lagoon 3 receives treated water from Lagoons 4 and 5. Lagoon 3 isperiodically batch discharged to Erdman Brook through a State Pollutant DischargeElimination System (SPDES) permitted discharge; it is part of the Low-Level WaterTreatment Facility.• Lagoon 4 is a lined basin constructed in the sand and gravel unit on the North Plateau. Itmeasures approximately 100 feet long by 90 feet wide. It has a storage capacity of 204,000gallons. It receives only treated water from the LLW2 Building and discharges to Lagoon 3.Lagoon 4 was originally lined with reworked glacial tills. In 1974, a synthetic membraneliner was installed after NFS identified that Lagoons 4 and 5 were potential sources of tritiumto groundwater in the sand and gravel unit. In the late 1990s, the synthetic membrane linerswere removed and replaced with concrete grout and a XR-5 liner, which is an ethylene interpolymeralloy membrane.• Lagoon 5 is very similar in form and function to Lagoon 4, and shares the same history. It isa lined basin constructed in the sand and gravel unit on the North Plateau. It measuresRev. 1 B-2
WVDP Phase 1 CSAPapproximately 90 feet long by 80 feet wide. It has a storage capacity of 166,000 gallons. Itreceives only treated water from the LLW2 Building and discharges to Lagoon 3. Lagoon 5was originally lined with reworked glacial tills, was later relined with a synthetic membraneliner, and finally was lined with concrete grout and a XR-5 liner.French Drain. In 1965, a French drain was installed on the northwest sides of Lagoons 2 and 3and the northeast side of Lagoon 3 to prevent groundwater from flowing into Lagoons 2 and 3.The French drain discharged to Erdman Brook. The French drain was capped in 2001 and nolonger discharges into Erdman Brook.Neutralization Pit. The Neutralization Pit is a nine feet by seven feet by 5.5 feet deep concretetank constructed with six-inch thick concrete walls and floor that are lined with stainless steel.The pit receives low-level radioactive wastewater from WVDP process areas. This liquid issubsequently transferred to the Interceptors. Between about 1965 and 1988 NaOH was added inthe Neutralization Pit to neutralize slightly acidic wastewaters.Old Interceptor. The Old Interceptor is a liquid waste storage tank. It is an unlined concrete tank,located below-grade, with a steel roof. It measures 40 feet by 25 feet by 11.5 feet deep. The flooris 24 inches thick and the walls are 12 inches thick. The Old Interceptor received low-level liquidwastewater generated at the Process Building. The wastewater was collected and sampled, thendischarged to Lagoons 1 or 2. It was in use from the time of initial plant operation until 1967,when the Old Interceptor was replaced by the New Interceptors. The Old Interceptor is currentlyused for temporary storage of radiologically contaminated liquids that exceed the effluent releasecriterion of 0.005 μCi/mL gross beta activity. After verification of acceptable radiologicalcontamination concentrations, the contents are transferred by steam jet to the New Interceptors.New Interceptors. The New Interceptors are twin liquid waste storage tanks. Each is an open-top,lined concrete tank, located below-grade, with a steel roof. Each measures 22 feet by 20 feet by11.5 feet deep. The walls and floor are 14 inches thick, and are lined with stainless steel. TheNew Interceptors were built in 1967 to replace the Old Interceptor, which had high levels ofradioactivity. As with the Old Interceptor, the New Interceptors receive wastewater and are usedto collect and sample the wastewater before transfer to Lagoon 2.Rev. 1 B-3
WVDP Phase 1 CSAPSolvent Dike. The Solvent Dike is located approximately 300 feet east of the Process Building. Itwas an unlined basin excavated in the sand and gravel layer. It measured 30 feet by 30 feet. TheSolvent Dike received rainwater runoff from the Solvent Storage Terrace, which housed an acidstorage tank and three storage tanks containing a mixture of used n-dodecane and tributylphosphate. In 1987 the sediment was removed and the area was backfilled, but the Solvent Dikestill contains radiologically contaminated soil.Maintenance Shop Leach Field. The Maintenance Shop Leach Field is located directly northeastof where the Maintenance Shop stood. It consists of three septic tanks, a distribution box, a tiledrain field, and associated piping. It occupies an area of approximately 1500 square feet. Theleach field was used until 1988; all three tanks are now out of service and filled with sand.Because it is located within the area of the North Plateau Groundwater Plume, low levels ofcontamination may be present.Groundwater Recovery System. The Groundwater Recovery System is located in the northwestcorner of WMA 2. It was installed in 1995. The groundwater recovery system includes 3 wellsalthough most of the time water is pumped from two recovery wells at the western lobe of theNorth Plateau Groundwater Plume. Groundwater is pumped from the wells to the LLW2 Buildingfor treatment by ion exchange to remove Sr-90 contaminants. Like all discharge from the LLW2Building, the treated groundwater is pumped to Lagoon 4 or Lagoon 5, then to Lagoon 3, and,eventually, discharged into Erdman Brook through the permitted outfall.Pilot Scale Permeable Treatment Wall. The Pilot Scale Permeable Treatment Wall is locatednorthwest of Lagoon 5. It was installed in 1999. This treatment wall is approximately 30 feetwide, seven feet thick, and 25 feet deep, extending into the Lavery Till. It is filled withclinoptilolite, a natural zeolite material, and covered with soil. Its purpose was to evaluate theeffectiveness of such systems in treating groundwater contaminated with Sr-90.O2 Building. The O2 Building was located southwest of the Low Level Wastewater Building. Itwas a two-story, steel-framed concrete block structure, measuring 27 feet wide, 39 feet long, and30 feet high. It contained a 16 feet deep stainless steel-lined sump. The O2 Building once housedfilters, ion exchangers and other equipment used by NFS and the WVDP to treat low-levelwastewater before transfer to Lagoon 3. The O2 Building was built in 1971 and operated untilRev. 1 B-4
WVDP Phase 1 CSAP1998, when it was replaced by the LLW2 Building. It was demolished down to its concrete floorslab at grade in October 2006.Test and Storage Building. The Test and Storage Building was located northeast of the ProcessBuilding. It was a timber frame and metal sided building, measuring 80 feet by 120 feet by 22feet high. It contained office spaces, a tool crib, and garage space. A concrete block additionhoused radiation and safety operations; it measured 18 feet by 26 feet by 12 feet high. The Testand Storage Building and its addition were demolished down to its concrete floor slab at grade inJune 2007.Maintenance Shop. The Maintenance Shop was located adjacent to the east end of the Test andStorage Building. It was a metal building with steel supports, measuring 60 feet by 100 feet by 28feet high. It housed locker rooms, lavatories, instrument shops, work areas, and a finished officearea. The Maintenance Shop was demolished down to its concrete floor slab at grade in June2007.Full Scale Permeable Treatment Wall. A full-scale permeable treatment wall was installed in2010 to address the further migration of the North Plateau Groundwater Plume. This zeolite-filledwall runs in a U-shape from the eastern end of the Lag storage buildings in WMA 5 to thenorthern end of Lagoon 3, and is tied to the underlying Lavery Till.Underground Pipelines. Approximately 50 underground wastewater pipelines totaling more than4,000 linear feet lie within WMA 2. Some of these pipelines run from the Process Building area(WMA 1) and the Waste Tank Farm (WMA 3) to the WMA 2 Neutralization Pit and Interceptors.They also connect the Interceptors to Lagoon 2; connect Lagoon 2 to the O2 Building and theLLW2 Building; connect these treatment facilities to Lagoons 4 and 5; connect Lagoons 2, 3, 4,and 5 to each other; and discharge treated wastewater from Lagoon 3 to Erdman Book throughthe permitted outfall. When Lagoon 1 was taken out of service in 1984, piping to Lagoon 1 fromthe New Interceptors was realigned to Lagoon 2.• The wastewater pipelines are Duriron pipes. They range from two to six inches in diameterand typically are buried eight to 12 feet below grade.Rev. 1 B-5
WVDP Phase 1 CSAP• An exception to Duriron piping is the leachate transfer pipeline that runs from the NDA(WMA 7) to Lagoon 1 and Lagoon 2. This is a two inch polyvinylchloride pipeline, buriedapproximately five feet below grade. It runs for approximately 400 feet within WMA 2. Theleachate transfer pipeline originally delivered water that collected in SDA lagoons (WMA 8)to the lagoons in WMA 2. The leachate transfer pipeline currently transfers liquids collectedin the NDA Interceptor Trench to Lagoon 2 for treatment.• All underground wastewater pipelines within WMA 2 are known to be radioactivelycontaminated. The leachate transfer pipeline has been determined to contain an insignificantamount of residual radioactivity.Certain facilities that were located in WMA 2 have been removed during deactivation work toachieve the EIS starting point. These facilities include the O2 Building, the Test and StorageBuilding, the Vitrification Test Facility, the Maintenance Shop, the Vehicle Maintenance Shop,the Maintenance Storage Area, miscellaneous "O" series office trailers, and a group of storagetrailers. Of these facilities, only the O2 Building was radioactively contaminated. Concrete floorslabs and foundations associated with these facilities, except for the trailers, remain in place.B.2 Physical SettingWMA 2 is located on the North Plateau. It is bounded to the west by WMA 1, WMA 3, WMA 5,and WMA 6, to the north by WMA 5 and WMA 4, to the east by WMA 12 South, and to thesouth by WMA 6 and WMA 12 South.The surface of WMA 2 consists of building footprints, parking lots/hardstands, waste lagoons,and vegetated soils. WMA 2 has a complex topography, reflecting the significant reworking ofsoils over the years to install and decommission various waste lagoons and supportinginfrastructure. In general, surfaces slope from the west towards the east. Surface runoff dischargesto ditches that run along the northern and southern boundaries of WMA 2. The northern ditchjoins the Swamp Ditch (WMA 4), which discharges to Franks Creek to the east of the WVDPpremises. The southern ditch feeds Erdman Brook (in WMA 12 South), which also joins FranksCreek.Rev. 1 B-6
WVDP Phase 1 CSAPThe subsurface of WMA 2 consists of a relatively permeable sand and gravel layer that overliesthe impermeable Lavery Till (Figure B.3). Some of the lagoons extend into the Lavery Till.Groundwater generally flows from west to east; however, there are some deviations from this rulein the northern and southern parts of WMA 2. In the northern part of WMA 2, some groundwaterflows north to discharge into the Swamp Ditch, which is a drainage feature that runs west-to-eastalong the north side of the CDDL (WMA 4). Along the southern boundary of WMA 2,groundwater likely has a southern component, leading to discharge into Erdman Brook. Further,Lagoons 2 and 3, near the eastern boundary, are unlined.There is known to be a significant amount of buried infrastructure (piping, etc.) associated withthe WMA 2 facilities.B.3 Area HistoryThe WMA 2 area (and in particular surface soils) has undergone significant reworking since theinitiation of NFS activities.Figure B.4 shows WMA 2 in 1962 prior to site development. At this time WMA 2 was farmed.Figure B.5 shows WMA 2 in 1966. The surface of WMA 2 shows surface scarring over almost itsentirety, with scarring extending from Lagoon 2 to the southeast into WMA 12 South. Lagoons 1,2, and 3 are clearly visible.Figure B.6 shows WMA 2 in 1968. Re-vegetation has occurred over much of the site. Dischargepoints from Lagoons 2 and 3 are clearly visible. The neutralization pit, solvent dike, and Test andStorage Building are also clearly visible along the western edge of WMA 2.Figure B.7 shows WMA 2 in 1977. A significant amount of additional construction has takenplace in WMA 2 since 1968. In particular, Lagoons 4 and 5 have been added, as well as a numberof additional structures in the western portion of WMA 2. Note that these activities would haveresulted in a potentially significant displacement of surface soils that would have beencontaminated by the 1968 Process Building stack releases.Rev. 1 B-7
WVDP Phase 1 CSAPFigure B.8 shows WMA 2 in 1984. The area is basically unchanged since 1977. The footprint ofthe French Drain is visible in this photograph.Figure B.9 shows WMA 2 in 1995. Lagoon 1 had been filled and covered in this photograph.There also is a significant surface disturbance in the northeast corner of WMA 2, adjacent toLagoon 3 which later became a hardstand area.Figure B.10 shows WMA 2 in 2007.Figure B.11 shows a 1982 oblique aerial photograph of the WMA 2 area taken from the east.B.4 Known and Suspected ReleasesB.4.1Cesium ProngPotentially Affected Media:Potentially Affected WMAs:surface soil, subsurface soil, sediments1, 2, 3, 4, 5, 6, 10, 12 NorthIn 1968, a ventilation system filter in the Process Building (in WMA 1) failed, releasingcontaminated particulate up the Process Building stack. A mixture of radionuclides was released,with Cs-137 predominant. Approximately 0.33 Ci particulate gross beta radioactivity wasreleased. The contaminated particulate was deposited on surface soils, resulting in a large area ofcontamination around the Process Building and to the north-northwest. Detectable depositsextend several miles, including beyond the WVDP premises. WMAs 1, 2, 3, 4, 5, 6, 10, and12 North likely are affected. Because Cs-137 is predominant, this area of contamination is knownas “the cesium prong” (DOE 2009 Table 2-17, DOE 2010 Section 3.11.5).As originally deposited, surface soil activity concentrations should have decreased towards thenorth, away from WMA 1. However, the surface features of many areas within the WVDPpremises have been reworked significantly since the release; as a result, the current spatial anddepth distribution of soil contamination may be significantly different than the original footprint.In addition, the surface soil contamination likely has been naturally spread by erosion and runoffinto surface drainage features; this phenomenon may have enlarged the area impacted byRev. 1 B-8
WVDP Phase 1 CSAPdeposition, although detailed data regarding this effect are not available (DOE 2010Section 3.11.5).Finally, other releases from the Process Building stack may have produced minor impacts. Theseother releases include the 1968 failure of a dissolver off-gas system filter, resulting in 0.28 Ci ofparticulate activity, and the 1968 failure of a vessel off-gas system filter, resulting in the March1968 releases to exceed the monthly allowance by 15 percent (DOE 2010 Section 3.11.5).B.4.2North Plateau Groundwater PlumePotentially Affected Media: subsurface soil, groundwater, sedimentPotentially Affected WMAs: 1, 2, 3, 4, 5, 6Several releases have contributed to a contaminated groundwater plume originating in the area ofthe Process Building (in WMA 1). The plume is expected to have migrated towards the northeast,and to have remained within the WVDP premises. There likely have been groundwater seeps todrainage features, resulting in sediment contamination; these sediment impacts may extendbeyond the WVDP premises. WMAs 1, 2, 3, 4, 5, and 6 likely are affected. Because this area issituated on the North Plateau, the area of contamination is known as “the North PlateauGroundwater Plume.” The predominant mobile contaminant in this plume is Sr-90.The major contribution to the plume occurred in 1968. (Other potential contributing releases arepresented in Sections A.4.3, B.4.3, C.4.3, and E.4.3.) Radioactive acid leaked into the subsurfaceat the southwest corner of the Process Building when Line 7P-240-1-C in the Off-Gas OperatingAisle (within the Process Building) failed. The leakage drained down to the underlying Off-GasCell and the adjacent southwest stairwell, then apparently flowed through an expansion joint inthe concrete floor of the Off-Gas Cell and migrated into the underlying sand and gravel. The leakreleased an estimated 200 gallons of radioactive nitric acid with approximately 93 Ci Sr-90(DOE 2009 Table 2-17).B.4.3Other Known and Suspected ReleasesRev. 1 B-9
WVDP Phase 1 CSAPB.4.3.1Wastewater Treatment OperationsPotentially Affected Media:Potentially Affected WMAs:surface soil, subsurface soil, groundwater, sediments1, 2, 3, 4, 5, 6 (North Plateau Groundwater Plume),12 South (Erdman Brook)All operational units used to treat radioactive wastewater are expected to contain residualradioactivity. These operational units are: the Low-Level Wastewater Building, the Lagoons(particularly Lagoons 1 and 2, and primarily in the sediment), the French Drain, theNeutralization Pit, the Old Interceptor, the New Interceptors, and all associated undergroundpipelines.Further, the design of some of these units allowed contaminated water to infiltrate groundwaterand/or surface water (Erdman Brook) as part of standard operation:• Lagoon 1 allowed liquid to seep from the lagoon into the surrounding sand/gravel layer,while retaining sediment. Specifically, tritiated water (originally containing about 6,000curies of tritium in leachate pumped from the SDA (WMA 8) for treatment) was allowed toseep from Lagoon 1 and infiltrate areas of the North Plateau groundwater during the mid-1970s. These conditions resulted in an extensive investigation by NFS, extending through thetransfer of operational control to DOE in 1982. Consequently, Lagoon 1 was closed in 1984(DOE 2010 Section 3.11.5).• Similarly, Lagoons 2 and 3 historically may have discharged to groundwater. Currently, theselagoons are operated such that their water levels are maintained below the interface betweenthe sand and gravel layer and the Lavery Till. As such, they should not contributecontaminated water to groundwater in the sand and gravel layer, though they may contributesmall amounts of water to the Lavery Till. They likely act as local drains for groundwater inthe sand and gravel. Historically, however, the water levels could have been elevated, andwould have allowed discharge of contaminated water to the sand and gravel layer. Whilecontamination levels in the discharged water would have been relatively low, soil sorptionwould likely have led to an accumulation of contamination in subsurface soils adjacent tothese lagoons.Rev. 1 B-10
WVDP Phase 1 CSAP• In addition, Lagoon 3 periodically has discharged effluent to Erdman Brook through theLagoon 3 SPDES permitted outfall. Of particular historical note were the relatively largereleases that took place during NFS operations, such as in 1969 when 108 curies of gross betaactivity were released (WVDP-EIS-006). Between 1966 and 1972, a yearly average of0.7 Ci of alpha emitters, 65 Ci of beta emitters, and 3,500 Ci of tritium were released.Subsequent radioactive discharges from Lagoon 3 were related to treatment of SDA leachate(1975 – 1981) and from NFS and WVDP facility operations (1972 – present). Several of thedischarged radionuclides have an affinity to become chemically sorbed to silt, whichaccumulates in stream beds (DOE 2008 Section 2.12.3).These operational units are in the vicinity of the North Plateau Groundwater Plume, and likelyhave contributed to the plume. Based on their specific construction (e.g., depth) and locations,groundwater contamination also is likely to have migrated south from some of these units,through the sand/gravel layer, towards Erdman Brook.Finally, in 2004 two radiologically contaminated bees’ nests were found when a walkway wasremoved between the Vitrification Test Facility and a nearby trailer in WMA 2. Experienceindicated that the nests likely were built with mud from one of the lagoons. This incident isrepresentative of cases where low-level contamination has been found to be spread by insects orsmall animals (DOE 2010 Section 3.11.5).B.4.3.2Lagoons 4 and 5 OverflowPotentially Affected Media:Potentially Affected WMAs:surface soil, subsurface soil, groundwater1, 2, 3, 4, 5, 6 (North Plateau Groundwater Plume)In 1974, Lagoons 4 and 5 overflowed due to loss of capacity at Lagoon 3; this resulted inunplanned treated water released to local soil and groundwater northeast of the O2 Building.Treated water activity concentrations likely were close to surface water free release levels(DOE 2009 Table 2-17). This release likely has contributed to the North Plateau GroundwaterPlume.Rev. 1 B-11
WVDP Phase 1 CSAPB.4.3.3Neutralization Pit OverflowPotentially Affected Media:Potentially Affected WMAs:surface soil, subsurface soil, groundwater1, 2, 3, 4, 5, 6 (North Plateau Groundwater Plume)In 1987, the Neutralization Pit overflowed due to a malfunctioning drain valve. The overflowwent to the ground near the New Interceptors and Lagoon 1. The flow was stopped when notedby an operator. Approximately 5,000 gallons of wastewater were spilled, with approximately 5E-05 uCi/mL gross beta (DOE 2009 Table 2-18). This release likely has contributed to the NorthPlateau Groundwater Plume.B.4.3.4Interceptor Drain Line LeakPotentially Affected Media:Potentially Affected WMAs:subsurface soil, groundwater1, 2, 3, 4, 5, 6 (North Plateau Groundwater Plume)In 1967, contaminated groundwater was encountered during construction of the New Interceptor,which was being constructed south of the Old Interceptor. This contamination indicated leakageor a release associated with the Old Interceptor drain line (DOE 2009 Table 2-17). This releaselikely has contributed to the North Plateau Groundwater Plume.B.4.3.5Waste Transfer FailurePotentially Affected Media:Potentially Affected WMAs:subsurface soil, groundwater1, 2, 3, 4, 5, 6 (North Plateau Groundwater Plume)In 1967, the wastewater line to Tank 8D-2 (Line 7P-170-2A) failed during waste transfer from theProcess Building (in WMA 1) to the tank (in WMA 3). The failure resulted in approximately 555gallons of liquid waste entering an acid recovery sump in the southwest corner of the ProcessBuilding and draining to the Old Interceptor. Resultant activity levels at the Old Interceptor weregreater than 100 mR/hr. The waste required pump-out back to the Process Building for treatment.This event led to installation of 12 inches of concrete shielding on the Old Interceptor floor. In2003, a gamma radiation level of 408 mR/h was measured near the Old Interceptor tank floorRev. 1 B-12
WVDP Phase 1 CSAP(DOE 2009 Table 2-17; DOE 2010 Section 3.11.5). This release likely has contributed to theNorth Plateau Groundwater Plume.B.4.3.6Old Hardstand ReleasePotentially Affected Media: surface soil, subsurface soil, groundwaterPotentially Affected WMAs: 1, 2, 3, 4, and 5In 1982 and 1983, evidence of a significant release of radioactivity was discovered at the OldHardstand in WMA 5. This release was apparently associated with outdoor storage ofcontaminated equipment and radioactive waste by NFS. Leakage from that equipmentcontaminated the hardstand’s asphalt surface and the adjacent soil and drainage ditch. Gammaradiation levels as high as 1,500 mR/hr were measured two inches above the ground surface. In1983, aboveground portions of contaminated trees were removed. In 1984, approximately 1,700cubic yards of materials (asphalt, soil, vegetation) were removed from the area and placed in thedecommissioned Lagoon 1. (Waste from Lagoon 1 had previously been transferred to Lagoon 2;both lagoons are in WMA 2.) Lagoon 1 was then capped with a clay cover. A 1995 estimate ofthe activity in the debris placed in Lagoon 1 totaled approximately 18 Ci (DOE 2009 Table 2-17;DOE 2010 Section 3.11.5). This release likely has contributed to the North Plateau GroundwaterPlume.B.4.3.7Waste Tank Farm Valve Pit SpillPotentially Affected Media: surface soil, subsurface soil, groundwaterPotentially Affected WMAs: 1, 2, 3, 4, and 5In 1985, a spill of radioactive water occurred in a valve pit located in WMA 3, northwest of Tank8D-2. A condensate line failed at its flanged valve bolts. Approximately 500 gallons werereleased at 4.6 E-02 uCi/mL gross beta and 4E-03 uCi/mL tritium. Some condensate flowed outof the valve pit into the drainage ditch extending towards the Old Hardstand in WMA 5 and/ortowards WMA 2. The radioactive condensate reached the point in the drainage ditch where theditch turns to the northeast, near the corner of the New/Old Hardstand. At this point, the ditch wasblocked to prevent further downstream flow. The release primarily impacted surface soil in WMARev. 1 B-13
WVDP Phase 1 CSAP3. Contaminated soil was removed (DOE 2009 Table 2-18; DOE 2010 Section 3.11.5). Thisrelease likely has contributed to the North Plateau Groundwater Plume.B.4.3.8Interceptor System Operational ReleasesPotentially Affected Media: surface soil, subsurface soil, groundwaterPotentially Affected WMAs: 1, 2During NFS operations, several incidents such as inadvertent transfers of higher-than-intendedactivity occurred in the Interceptor system, upstream of the Lagoons. Documented accounts ofleakage and spills in the Interceptor area corroborate the generally elevated observed subsurfacesoil contamination in the area between Lagoon 1 and the Process Building (WMA 1). Localizedsubsurface soil contamination can be attributed to these unintended operational releases.B.4.3.9Lagoons 5 Area Soil ContaminationPotentially Affected Media: surface soil, subsurface soilPotentially Affected WMAs: 2In 1997, a small spot of relatively high-activity, previously unidentified soil contamination wasfound in WMA 2, north of Lagoon 5. This contamination was identified during a radiologicalsurvey near environmental characterization activities (DOE 2010 Section 3.11.5).B.5 Existing DataExisting data sets for this area include:• In 1982 static direct exposure readings were collected across the WVDP premises(WVNSCO 1982). A portion of WMA 2 was covered by these measurements on a 10-mgrid. Figure B.12 shows these results color-code by the exposure readings encountered.These data indicated potentially significant surface contamination within the WMA 2boundary, with activity levels in general falling as one moves from west to east;interpretation of these data is complicated by the possibility of shine effects from theProcess Building and other facilities.Rev. 1 B-14
WVDP Phase 1 CSAP• In 1990 and 1991 a second static direct exposure measurement program was conducted(WVNSCO 1992). In the case of WMA 2, this effort provided systematic coverage for allof the WMA 2 area on a 10-m grid. This data collection used different instrumentationand protocols than the 1982 study, so the results are not quantitatively comparable.Figure B.13 shows these results. These data also indicated potentially significant surfacecontamination within the WMA 2 boundary, with the same general pattern of fallingactivity levels as one moves from west to east; interpretation of these data is complicatedby the possibility of shine effects from the Process Building and other facilities. Inaddition, the 1990/1991 survey identified more localized elevated areas immediatelyadjacent to Lagoons 2, 3, 4, and 5.• There are some soil sampling data for WMA 2 available within ELIMS. Figure B.14shows the locations of surface soil samples, sediment samples and soil cores withsubsurface soil samples. The bulk of the data was either collected as part of the 1993 sitewidecharacterization effort, or as part of the 2008 North Plateau Groundwater Plumecharacterization work. The exception is NP5, which was completed in 1994. Table B.1summarizes which radionuclides have data for WMA 2. Figure B.14 also shows surfacesoil Cs-137 and Sr-90 activity concentrations where those were available.There are very limited surface soil data available within ELIMS. In general these datashow higher activity concentrations in the western portion of WMA 2 and lower activityconcentrations to the east, as one would expect. Subsurface data identified elevatedactivity concentrations throughout WMA 2 to depth. The mix of radionuclides presentand the depth where maximum concentrations are encountered varies depending onlocation. For contamination associated with the North Plateau Groundwater Plumeoriginating from a subsurface release beneath the Process Building, Sr-90 is the onlyradionuclide significantly elevated above background levels in soils. For contaminationassociated with discrete releases within WMA 2, such as leaching from Lagoon 1 orreleases in the western portion of the site, Cs-137 often dominates. Figure B.18 providesa cross-sectional view that includes several soil core locations along with their samplingresults in the lagoon area of WMA 2.Rev. 1 B-15
WVDP Phase 1 CSAP• There is a significant amount of groundwater data for WMA 2 available within ELIMSfrom historical characterization work addressing the North Plateau Groundwater Plume.These data were obtained from monitoring wells and from groundwater samples obtainedby GeoProbe. Figures B.15 and B.16 show the locations of groundwater data collectioncolor-coded by Sr-90 and tritium results, respectively. The detection limits for Sr-90 andtritium varied widely among ELIMS samples. 10 pCi/L and 500 pCi/L were selected asthresholds for Sr-90 and tritium, respectively, because based on ELIMS data resultsabove these activity concentrations were consistently above method detection limits andso indicative of contamination impacts rather than simply measurement error.Groundwater contamination was encountered throughout WMA 2.B.6 Planned Phase 1 DP ActivitiesFor a more complete description of planned Phase 1 DP activities, see the Phase 1 DP, Section3.1 and Section 7.4.In WMA 2, the five lagoons, the Interceptors, the Neutralization Pit, the LLW2 Building, theSolvent Dike, the Maintenance Shop Leach Field, the remaining concrete slabs and foundations,and the underground wastewater lines within the large excavation will all be removed as part ofPhase 1 decommissioning activities. Figures B.17 and B.18 show the location of the largeexcavation and provide a cross-sectional view of the planned excavation, respectively. The largeexcavation is intended to address the bulk of discrete releases and heavy subsurfacecontamination within WMA 2 associated with the lagoons and lagoon support facilities, but notthe deep North Plateau Groundwater Plume that originated from a release underneath the ProcessBuilding and that has migrated into WMA 2’s subsurface.The DP Phase 1 activities will not include the North Plateau Pump and Treat System, the PilotScale Permeable Treatment Wall, the Full-Scale Permeable Treatment Wall, and undergroundlines not within the excavated areas.B.7 <strong>Conceptual</strong> <strong>Site</strong> <strong>Model</strong>Based on the limited available information, the conceptual site model (CSM) for WMA 2 is asfollows. A number of potential releases within the WMA 2 footprint are known to have occurred,Rev. 1 B-16
WVDP Phase 1 CSAPor may have occurred that likely impacted surface and subsurface soils and groundwater. Inaddition, environmental media within WMA 2 have likely been affected to some degree byreleases elsewhere at the WVDP site. These include air deposition contamination on surface soilsand subsurface contamination resulting from contaminant migration via groundwater from theProcess Building.During NFS operations, portions of the surface of WMA 2 underwent significant reworking. Thisreworking occurred in the western portion of WMA 2 and included the installation of Lagoons 4and 5 as well as additional facilities. This reworking may have covered contaminated surfacesoils with clean cover, contaminated surface soils may have been removed for dispositionelsewhere, and/or contaminated soils may have been re-used as backfill for building foundationsor buried infrastructure.Groundwater flow underneath WMA 2 is expected to be, in general, from west to east. The coreof the North Plateau Groundwater Plume has been steadily migrating in an easterly/northeasterlydirection. Groundwater flow also includes some northerly components along the west end of theCDDL, where discharge to the Swamp Ditch takes place, and also likely includes some southerlycomponents along the southern boundary of WMA 2, with discharge to Erdman Brook. Impactsto groundwater include the original Sr-90 release from beneath the Process Building in WMA 1,from leaching from Lagoon 1, from lagoon overflows (Lagoons 4 and 5), from seepage fromLagoons 2 and 3, and from various discrete releases associated with activities/infrastructure in thesouthwestern end of WMA 2.Figure B.19 shows the current CSM for surface soils. Figure B.20 shows the CSM for soilsdeeper than 1 m. Figure B.21 shows the CSM for contaminated groundwater beneath WMA 2.B.8 WMA 2-Specific Characterization Goals• Develop an inventory of buried infrastructure• Evaluate appropriateness of the current list of ROI• Verify absence of additional ROI• Determine extent of surface contamination• Identify the presence/absence of subsurface soil contamination• Identify soil waste stream characteristicsRev. 1 B-17
WVDP Phase 1 CSAP• Define required extent of WMA 2 excavation• Obtain data to support Phase 2 planning• Obtain geotechnical data required for barrier wall designB.9 CSAP Pre-Remediation Data Collection and Associated Decision-MakingCSAP pre-remediation data collection will consist of a number of components described in moredetail below.B.9.1Buried InfrastructureThe footprint of buried infrastructure will be identified and mapped. A significant amount ofburied infrastructure is believed to exist within WMA 2, and in particular in the western portionof WMA 2. This infrastructure would include wastewater lines as well as buried utilities.[required]B.9.2Gamma Walkover Survey DataThe purpose of performing a gamma walkover survey of the WMA 2 area is to identify the leveland extent of surface contamination. This includes both general trends in average activityconcentrations pertinent to the surface soil CG w requirement, as well as the identification ofisolated, more-elevated anomalies that might be indicative of discrete releases and/or surface soilCG emc concerns.A complete (100%) logged gamma walkover survey (GWS) will be conducted for accessibleareas within WMA 2. Examples of areas that would not be accessible are areas where standingwater is present in wetlands, existing building footprints, building pads, and lagoons. Based onthe GWS results, surface soil within WMA 2 will be divided into four categories: (1) surface soilswhere GWS data indicate contamination above CG w requirements; (2) surface soils where GWSdata indicate contamination, but it is not clear if contamination exceeds surface soil CG wrequirement; (3) surface soils where GWS indicate impacts, but those impacts are not expected toexceed surface soil CG w standards; and (4) surface soils where there is no indication of impactsabove background conditions. The purpose of this data collection is to provide insights into thespatial distribution of surface contamination, and to guide subsequent soil sampling. [required]Rev. 1 B-18
WVDP Phase 1 CSAPB.9.3Surface Soil SamplingSurface soil sampling will be used to address areas inaccessible to GWS data collection, toresolve hot spots identified by the GWS data, to evaluate the presence, absence, and/or extent ofsurface contamination above surface soil CG w requirements based on GWS results, and toevaluate contamination in the 0-1 m interval for areas where surface soils have been disturbed.• Wetlands. It is possible that standing water will be present in wetlands that prevent GWSdata collection from those areas. Soil sampling will be required for wetland footprints andfor any other areas where standing water prevents the collection of GWS data. WithinWMA 2, this is most likely to occur in the eastern portion of the WMA.For every area where standing water or saturated soil conditions prevent GWS datacollection and that is outside the planned WMA 2 excavation, systematic soil samplingwill take place. For wetland areas less than 200 m 2 in size, one sample will be collected.For areas between 200 and 1,000 m 2 in size, one sample per 200 m 2 will be collected. Forareas between 1,000 and 2,500 m 2 in size, five samples will be collected. For areasexceeding 2,500 m 2 in size, at minimum one sample will be collected per 500-m 2 area.One sample will be collected from each location representative of a 0-15 cm depthinterval. In the case where an area has more than one location, locations will be selectedto provide systematic coverage of the area of interest. [contingent]• Hot Spots. If GWS data indicate the presence of contamination that possibly exceeds“hot spot” (CG emc ) standards or an isolated elevated area is identified that appearsindicative of a discrete release, the location of concern will be sampled with a biasedsample. Within WMA 2, hot spots will be biased sampled if they are outside the plannedWMA 2 deep excavation footprint. If biased samples are collected from a particularlocation, they will be collected from two depth intervals: 0-15 cm, and 15 cm-1 m. The0-15 cm samples will be analyzed for the 12 radionuclides of potential interest in additionto the 18 ROI. One down-hole gamma scan will be conducted from each biased location.The purpose of these samples is to resolve GWS anomalies, evaluate the appropriatenessof the current ROI list, and verify the absence of additional ROI. [contingent]Rev. 1 B-19
WVDP Phase 1 CSAP• CG w Sampling. Surface soil sampling may be conducted after the GWS to further clarifyresults, with the level and nature of sampling dependent on GWS results. For WMA 2,surface soil CG w sampling in response to GWS results will primarily focus on areas thatare currently not paved and that are not within the planned WMA 2 excavation footprint.oIf GWS results indicate contamination impacts above background levels but thatsurface soil contaminant levels exceeding surface soil CG w requirements are unlikely,the area of interest will be systematically sampled using a triangular grid with adensity of one sample per 400 m 2 . One sample will be collected from each locationrepresentative of a 0-15 cm depth interval. Locations will be selected to providesystematic coverage of the area of interest. The purpose is to document the activityconcentrations present in surface soils within WMA 2. [contingent]oIf GWS results indicate surface soil contaminant levels exceeding surface soil CG wrequirements likely exist, one sampling location will be selected at the highest grossactivity level to confirm surface soil CG w exceedances and another set of samplinglocations will be identified to spatially bound the extent of contamination (i.e., alongthe boundary of what is considered likely above surface soil CG w requirements) ifthis is not obvious from the GWS data. Two samples will be collected from thelocation targeting high gross activity levels, one representative of a 0-15 cm depthinterval, and one representative of a 15 cm-1 m depth interval. One sample will becollected from each location intended to laterally bound contamination,representative of a 0-15 cm depth interval. In addition, the location targeting highgross activity levels will have one down-hole gamma scan conducted at the center ofthe location with static measurements taken every 15 cm. The purpose is to documentsurface soil CG w requirement exceedances and bound the lateral extent ofcontamination. [contingent]oIf GWS results indicate areas with surface soil contamination impacts but it is unclearwhether surface soil CG w requirement exceedances are present, at most five samplinglocations will be selected that systematically cover the areas of interest. One samplewill be collected from each location representative of a 0-15 cm depth interval.Locations will be selected to provide systematic coverage of the area of interest. TheRev. 1 B-20
WVDP Phase 1 CSAPpurpose is to resolve the question of whether surface soil CG w requirementexceedances exist for areas where GWS results are ambiguous. [contingent]oIf any 0-15 cm interval yields a sample result indicating a surface soil CG wrequirements exceedance and that sample location is not laterally bounded either byexisting sampling locations with results less than surface soil CG w requirements or byGWS data that clearly indicate contamination is not a concern, additional samplinglocations will be selected so that the contamination encountered is spatially bounded.The purpose is to laterally bound contamination that is above CG w requirements.[contingent]• Central Western Area of WMA 2. The assumption is that because of surface coveradded to the site as part of WVDP activities, surface contamination that pre-dated theWVDP may now be covered by clean material and may not readily detectable by GWSscans. Figure B.22 shows the area of WMA 2 where this is a concern. (Note that thecontamination status of soils beneath building slabs will be addressed by remedialsupport surveys after slabs have been removed.) This area is approximately 1.7 acres insize. Systematic sampling locations arranged on a triangular grid with a 20-m gridspacing will be used to evaluate the contamination status of soils beneath the existingground cover. Approximately 20 sampling locations will be required. Each location willhave one sample collected to a depth of 1-m. In addition, each will have a down-holegross activity scan with one measurement taken each 15 cm. [required]B.9.4Subsurface Soil SamplingSubsurface soil sampling within WMA 2 has three purposes: (1) to determine presence andvertical extent of contamination impacts above background levels in WMA 2 along the edge ofand outside the planned deep excavation, (2) to estimate waste stream volumes in support of theplanned WMA 2 deep excavation, and (3) to provide geotechnical and contamination statusinformation for the footprints of the slurry and sheet walls.Much of the WMA subsurface has been impacted by the North Plateau Groundwater Plume tovarying degrees. A significant amount of historical data collection has already taken place toRev. 1 B-21
WVDP Phase 1 CSAPcharacterize the nature and extent of that plume; additional characterization of the North PlateauGroundwater Plume is outside the scope of the CSAP.• WMA 2 Waste Characterization. Subsurface soil cores will be obtained within thefootprint of the planned WMA 2 excavation to address contaminated soil volumeestimation needs. Sixteen core locations will be placed within the excavation footprint(excluding the footprints of Lagoons 1, 2, and 3) to a depth of 1 m into the Lavery Till.The cores will be located to provide systematic coverage of the area (approximately onecore per 1,000 m 2 ). Each one meter interval of each core will be sub-sampled in a fashionto obtain a representative sample, and those samples submitted for quick turn-aroundanalysis of Sr-90 and Cs-137. With an average expected depth-to-till of 20 feet,approximately 100 samples will be collected and analyzed. These data will be used toestimate waste stream volumes resulting from the excavation of WMA 2. [required]• Lagoon 2 Sediment Characterization. Because of the placement of highlycontaminated Lagoon 1 sediments into Lagoon 2, there is the potential for TRUcontaminatedsediments to be present in Lagoon 2 sediments. Five locations will besystemically identified across Lagoon 2’s surface, and sediment cores retrievedrepresenting the top one meter of sediments/soils. These samples will be analyzed for the12 potential radionuclides of interest, in addition to the 18 ROI. [required]• Southern WMA 2 Excavation Boundary. Subsurface soil coring, scanning, andsampling will take place along the southern boundary of the planned excavation todetermine the contamination status of surface and subsurface soils adjacent to thesouthern edge of the planned WMA 2 excavation. An initial set of 30 sampling locationsseparated by 10 m starting from the southwestern corner of the WMA 2 excavation andrunning east along planned excavation boundary will be sampled (Figure B.23). At eachlocation, one core will be retrieved that extends one meter into the Lavery Till. A downholescan will be conducted to the extent possible at each location with a staticmeasurement every 30 cm. Each core will be divided into one meter segments.oAt minimum, the following soil core segments will be submitted for analysis: the topmeter (representative of surface soils), the meter directly above the Lavery Till, thetop meter of Lavery Till, and the meter straddling the water table. In addition, if theRev. 1 B-22
WVDP Phase 1 CSAPbore/core scan identifies an elevated zone not included in one of these three, themeter interval containing the elevated zone will be submitted for laboratoryradiological analysis. Towards the eastern end of the planned excavation, theoverlying sand/gravel unit may pinch out; in this case there may be less than foursamples submitted for analysis if the depth to till is less than four meters. [required]oFrom each location three groundwater samples will be collected: one from the watertable, one from immediately above the Lavery Till, and one midway between thesetwo, if possible. In areas where the overlying sand/gravel unit pinches out, thenumber of groundwater samples may be reduced accordingly. [required]oIf any interval other than the top 1 m identifies contaminants above backgroundlevels, then additional soil core locations will be placed on a triangular grid with aseparation of 10 meters to the south of the location(s) of concern in a manner thatbounds the original contamination as the terrain allows and sampled as describedabove. This process will continue until the southern extent of subsurfacecontamination is bounded. If extensive subsurface contamination is encountered afield decision may be made to increase the separation distance between the originalset of core locations and the next set of bounding core locations. The ultimate intentis to spatially bound subsurface contamination to the south of the planned WMA 2excavation. This sampling may extend into WMA 12. [contingent]• Slurry Wall Footprint Characterization. Subsurface soil coring and scanning will takeplace following the planned slurry wall footprint along the western, northern, and easternportion of the WMA 2 excavation. These core locations will be separated by 20 m.Approximately 20 cores will be required. At each location, one core will be retrieved thatextends one meter into the Lavery Till. A down-hole scan will be conducted to the extentpossible at each location with a static measurement every 30 cm. Each core will bedivided into one meter segments.oSubsurface soil sampling, groundwater sampling, and core scanning protocols will bethe same for soil cores from the slurry wall footprints as for the southern boundary ofthe WMA 2 excavation. [required]Rev. 1 B-23
WVDP Phase 1 CSAPoA variety of geotechnical field data will be collected from each core location, asnecessary and required for sheet piling/slurry wall design. In addition soil sampleswill be collected and submitted for geotechnical analyses (e.g., grain size, Atterberglimits, triaxial strength, etc.) as required by sheet piling/slurry wall design.[required]• Additional Contingencies.oIf any 0-15 cm surface soil sample result indicates contamination impacts abovebackground levels and there was not a 15 cm-1 m sample collected from thatlocation, a 15 cm – 1 m sample will be collected from that location following theprotocols used for the original 0-15 cm surface soil sample. In addition, each soillocation will have one down-hole gamma scan conducted at the center of the locationwith static measurements taken every 15 cm. [contingent]oIf a 15 cm - 1 m sample result exceeds background levels, then an additional samplefrom a depth of 1–2 m will be collected and analyzed from that location. In addition,down-hole gamma data will be collected from the location with static measurementscollected for every 15 cm depth interval. If that sample has contamination abovebackground conditions, then the next deeper 1 m interval will be sampled andanalyzed and a down-hole gamma scan performed. This process will continue untilbackground conditions are reached. [contingent]oIf systematic subsurface sampling identified contamination that appears to extendlaterally beyond the grid boundaries in WMA 2, such as into WMA 4 or WMA 12,then the grid will be extended and additional sampling conducted until the lateralextent of contamination has been bounded. [contingent]B.9.5Drainage Feature SamplingWMA 2 contains one primary drainage feature outside the planned WMA 2 deep excavation thatruns along the WMA 2 boundary with WMA 4. For drainage features within WMA 2, the surfacesoil CG w requirements apply. Surface drainage feature sampling will be conducted to determineRev. 1 B-24
WVDP Phase 1 CSAPditch sediment contamination status relative to surface soil CG w requirements. Surface drainagefeatures will be sampled as follows:• Samples representing a 0-15 cm depth interval will be collected from ditch sediments. InWMA 2, the primary drainage feature has a length of approximately 210 m. Samples willbe systematically located using a random start, separated by 30 m. [required]• If any 0-15 cm sample result indicates contamination impacts above background levelsand a 15 cm-1 m sample was not also collected, a 15 cm-1 m sample will be collectedfrom that location following the protocols used for the original 0-15 cm sample.[contingent]• If a sample indicates contamination impacts above background levels for the 15 cm-1 mdepth interval, an additional sample from a depth of 1–2 m will be collected and analyzedfrom that location. This will be repeated, as necessary, until the vertical extent ofcontamination impact is bounded at that location. [contingent]B.9.6Buried Infrastructure Soil SamplingSoils associated with buried infrastructure of potential concern within WMA 2 will be sampled todetermine their contamination status. Buried infrastructure that is of potential concern in WMA 2is defined to be buried infrastructure that either carried contaminated waste/wastewater or wasinstalled after 1968.• Three locations along each piece of buried infrastructure that is of concern within WMA2 will be trenched. These locations will be selected to maximize the possibility thatcontamination will be encountered (e.g., locations where historical or current GWS dataindicate surface contamination exists). For infrastructure that crosses the planned WMA 2excavation boundary, one of these locations will be at the boundary. Trenching will notoccur within the planned WMA 2 excavation footprint. During excavation, exposed soilswill be monitored by scans for evidence of elevated gross activity. The purpose of thissampling is to evaluate the presence of contaminated soils associated with buriedinfrastructure. [required]Rev. 1 B-25
WVDP Phase 1 CSAPoIf elevated readings are encountered below a depth of 1 m, soils exhibiting thehighest levels of gross activity will be sampled and analyzed.oIf elevated readings are not encountered below a depth of 1 m, a samplerepresentative of soils deeper than 1 m will be collected. In the case of infrastructurethat did not carry waste or wastewater, the sample will be from soils immediatelyabove the line. In the case of infrastructure that did carry waste or wastewater, thesample will be from soils immediately beneath the line.• If contamination above background conditions is encountered at any selected location,trenching will continue to depth until background conditions are observed. An additionalsample will be collected from the base of the trench to verify background conditions. Thepurpose is to vertically bound observed contamination. [contingent]• If buried infrastructure soil sampling identifies contamination impacts greater thanbackground, biased sampling will continue following the line until at least twoconsecutive locations yield soil samples below surface soil CG w requirements. Locationspacing will be based on engineering judgment, including the geometry of the line, thelevel of contamination encountered, and surface evidence of contamination. Buriedinfrastructure characterization will not extend into the planned WMA 2 deep excavationfootprint. The purpose of this sampling is to bound the extent of contamination associatedwith buried infrastructure, as necessary. [contingent]B.9.7Additional ContingenciesSampling and/or GWS data may indicate that contamination exists or extends beneath surfacescurrently covered by existing structures, concrete, asphalt, or hardstand material. In this case,“surface soil” will be defined as soil immediately beneath the cover. If sampling or GWS dataindicate that contamination may exist beneath existing structures (e.g., existing buildings andbuilding pads), then sampling locations will be offset along the foundation edge to determinecontamination extent. The purpose of the offset is to allow safe acquisition of data. Datacollection through building pads and hardstands in WMA 2 will not be required as part of thiseffort.Rev. 1 B-26
WVDP Phase 1 CSAPB.9.8Required <strong>Laboratory</strong> AnalysesAll samples will be submitted for analysis of all 18 ROI.A select portion of the samples as described above may be analyzed for the additional 12radionuclides of potential interest. In addition, ten percent of soil samples collected outside theWMA 2 excavation footprint will also be analyzed for the 12 radionculides of potential interest. Ifthese sample results indicate the presence of the one or more of those radionuclides at levels ofpotential significance, then the balance of samples from WMA 2 will also be analyzed for theadditional radionuclides that were identified.Table B.2 summarizes the required sample numbers and the estimated number of contingencysamples for WMA 2.This sampling plan assumes that quick turn-around analyses are available for Sr-90 and Cs-137and that soil samples will be screened for Sr-90 and Cs-137 prior to being analyzed for thebalance of the ROI. Contingency sampling requirements as described above may be undertakenbased on these screening data.B.9.9Decision-Making SummaryA summary of decision-making based on the WMA 2 data is as follows:• If GWS indicate anomalies are present, biased samples will be selected to target thoseanomalies.• If the GWS data identify areas likely exceeding CG requirements, one sample will beplaced to verify contamination and another set of surface soil samples used to laterallybound contamination. Additional locations may be selected, as necessary, to laterallybound contamination extent.• If sample results from biased or systematic surface samples for the 15 cm–1 m depthinterval indicate contamination above CG requirements, an additional sample from thatRev. 1 B-27
WVDP Phase 1 CSAPlocation representing the depth interval 1–2 m will be collected and this process repeateduntil contamination is vertically bounded.• If scans of soil bores/cores along the WMA boundary indicate intervals with elevatedactivity, the interval with the highest activity will be targeted for analysis.• If one or more soil cores locations along the southern WMA 2 excavation boundaryencounter either soil or groundwater contamination at depths greater than one meter,additional locations will be selected further to the south into WMA 12 to laterally boundcontamination.• For each set of buried infrastructure that is identified as a potential concern at least threetrenches that uncover the infrastructure will be scanned and sampled. If contaminationappears to extend laterally along the line of the infrastructure, additional sampling willtake place until contamination is bounded.B.10 ReferencesDOE 2008. Western New York Nuclear Service Center, Facility Description and MethodologyTechnical Report, Rev 0, prepared by URS Washington Division for DOE, WSMS-WV-08-0001, November 2008.DOE 2009. Phase I Decommissioning Plan for the West Valley Demonstration Project, Rev 2,prepared by Washington Safety Management Solutions, URS Washington Division,Science Applications International Corporation, prepared for DOE, December 2009.DOE 2010. Final Environmental Impact Statement for Decommissioning and/or Long-TermStewardship at the West Valley Demonstration Project and Western New York NuclearService Center, Vol 1, DOE/EIS-0226, January 2010.Rev. 1 B-28
WVDP Phase 1 CSAPTable B.1 Historical Data AnalysesNuclide# of SurfaceSoilLocations# ofSubsurfaceSoil Locations# of SedimentLocationsAm-241 0 18 1C-14 0 5 0Cm-243 0 5 0Cm-244 0 5 0Cs-137 13 22 2I-129 0 5 0Np-237 0 5 0Pu-238 0 18 1Pu-239 0 18 1Pu-240 0 18 1Pu-241 0 18 1Sr-90 13 31 2Tc-99 0 5 0U-232 0 18 1U-233 0 18 1U-234 0 18 1U-235 0 13 1U-238 0 18 1Rev. 1 B-29
WVDP Phase 1 CSAPTable B.2 Sample Number EstimatesRequired Contingent TotalSystematic Sediment Samples7 0 7(0-15 cm)Systematic Sediment Samples0 5 5(15 cm-1 m)Systematic Surface Soil20 0 20Samples (0-5 cm)Systematic Surface Soil0 20 20Samples (15 cm-1 m)Biased Surface Soil Samples0 3 3(0-15 cm)Biased Surface Soil Samples0 3 3(15 cm-1 m)Systematic Subsurface Soil305 34 339Samples (1-m intervals)Biased Subsurface Soil0 5 5Samples (1-m intervals)Buried Infrastructure Soil18 12 30SamplesGroundwater Samples 150 18 168Total: 500 100 600Rev. 1 B-30
WVDP Phase 1 CSAPFigure B.1 WMA 2 Facilities (from Phase 1 DP, Figure 3-24)Rev. 1 B-31
WVDP Phase 1 CSAPFigure B.2 WMA 2 with TopographyRev. 1 B-32
WVDP Phase 1 CSAPFigure B.3 North Plateau Cross-Section (from Phase 1 DP, Figure 3-6)Rev. 1 B-33
WVDP Phase 1 CSAPFigure B.4 WMA 2 Aerial Photograph from 1962Rev. 1 B-34
WVDP Phase 1 CSAPFigure B.5 WMA 2 Aerial Photograph from 1966Rev. 1 B-35
WVDP Phase 1 CSAPFigure B.6 WMA 2 Aerial Photograph from 1968Rev. 1 B-36
WVDP Phase 1 CSAPFigure B.7 WMA 2 Aerial Photograph from 1977Rev. 1 B-37
WVDP Phase 1 CSAPFigure B.8 WMA 2 Aerial Photograph from 1984Rev. 1 B-38
WVDP Phase 1 CSAPFigure B.9 WMA 2 Aerial Photograph from 1995Rev. 1 B-39
WVDP Phase 1 CSAPFigure B.10 WMA 2 Aerial Photograph from 2007Rev. 1 B-40
WVDP Phase 1 CSAPFigure B.11 WMA 2 1982 Oblique Aerial Photograph (from Phase 1 DP, Figure 3-25)Rev. 1 B-41
WVDP Phase 1 CSAPFigure B.12 WMA 2 1982 Direct Gamma Measurement ResultsRev. 1 B-42
WVDP Phase 1 CSAPFigure B.13 WMA 2 1990 - 1991 Direct Gamma Measurement ResultsRev. 1 B-43
WVDP Phase 1 CSAPFigure B.14 WMA 2 Historical Sampling LocationsRev. 1 B-44
WVDP Phase 1 CSAPFigure B.15 WMA 2 Sr-90 Groundwater ResultsRev. 1 B-45
WVDP Phase 1 CSAPFigure B.16 WMA 2 Tritium Groundwater ResultsRev. 1 B-46
WVDP Phase 1 CSAPFigure B.17 Phase 1 Subsurface Hydraulic Barrier Wall Placementand Excavation LocationRev. 1 B-47
WVDP Phase 1 CSAPFigure B.18 WMA 2 Excavation and Cross-Section(from Phase 1 DP, Figures 7-11 and 7-12)Rev. 1 B-48
WVDP Phase 1 CSAPFigure B.19 Initial WMA 2 Surface Soil CSMRev. 1 B-49
WVDP Phase 1 CSAPFigure B.20 Initial WMA 2 Subsurface Soil CSMRev. 1 B-50
WVDP Phase 1 CSAPFigure B.21 Initial WMA 2 Groundwater CSMRev. 1 B-51
WVDP Phase 1 CSAPFigure B.22 WMA 2 Area with Potential Subsurface Soil Contamination ConcernsRev. 1 B-52
WVDP Phase 1 CSAPFigure B.23 Example Soil Core LocationsRev. 1 B-53
WVDP Phase 1 CSAPThis page intentionally left blank.Rev. 1 B-54
WVDP Phase 1 CSAPAPPENDIX CWMA 3 PRE-REMEDIATION DATA COLLECTIONC.1 BackgroundWaste Management Area 3 (WMA 3) is approximately 2.3 acres in size and contains the fourunderground waste storage tanks (8D-1, 8D-2, 8D-3, and 8D-4) and their associated supportingfacilities and infrastructure (see Figures C.1 and C.2 for maps).Descriptions of the various features of WMA 3 follow, and are taken from the Phase 1 DP,Section 3.1.2. A description of planned Phase 1 DP activities in WMA 3 can be found in SectionC.6.Waste Storage Tanks. The waste storage tanks were built to store the liquid high level wastegenerated during the NFS spent nuclear fuel reprocessing operations. The WVDP subsequentlymodified these tanks to support treatment and vitrification of the HLW. Modifications includedconstructing a fabricated steel truss system over tanks 8D-1 and 8D-2 to carry the weight ofsludge mobilization and transfer pumps and installation of treatment equipment in Tank 8D-1.Tanks 8D-1 and 8D-2 are identical in size and construction, with each tank housed within its owncylindrical concrete vault. Each tank is 27 feet high by 70 feet in diameter, with a storagecapacity of 750,000 gallons. The tanks were constructed with reinforced carbon steel plateranging in thickness from 0.4375 inch for the roofs and walls to 0.656 inch for the floors. Theroof of each tank is supported internally by 45 eight-inch diameter vertical pipe columns that reston a horizontal gridwork of wide flange beams and cross members in the bottom two feet of eachtank. Each tank rests on two six-inch-thick layers of perlite blocks that rest on a three inch layerof pea gravel. The tank, perlite blocks, and pea gravel are contained within a carbon steel panwhich rests on a three-inch layer of pea gravel that separates the pan from the floor of the vault.Each tank and its associated pan are housed within a cylindrical reinforced concrete vault that hasan outside diameter of 78.6 feet. The walls of each vault are 18 inches thick and extend nearly 36feet above the floor of the vaults. The floor of each vault is 27 inches thick, except under the six30-inch diameter vertical concrete columns that support the vault roof. These columns passupward from the floor of the vault through the tanks and are encased in steel pipes 48 inches inRev. 1 C-1
WVDP Phase 1 CSAPdiameter that are welded to the top and bottom of each tank. The columns are locatedapproximately 16 feet from the center of the tank. The floor of each vault is underlain by a fourfeet thick bed of gravel. The concrete vault roof is two feet thick and is supported by the sixconcrete columns. The top of the vaults are six to eight feet below grade. Despite their robustconstruction, the tank vaults have not proven to be watertight. Groundwater seeps into both vaultsand has to be regularly pumped out.Tanks 8D-3 and 8D-4 are identical in size and construction, and both are housed within a singlereinforced concrete vault. Each tank is 12 feet in diameter and 15.67 feet high, with a nominalvolume of 15,000 gallons. The shell of each tank is 0.313 to 0.375 inch thick; both the tanks andtheir associated piping were constructed from 304L stainless steel. The concrete vault that housesthe tanks is approximately 32-feet long, 19-feet wide, and 25-feet tall. The walls, floor, and roofof the vault are 21-inches thick. The bottom of the vault is lined with stainless steel to a height of18 inches above the floor. The floor contains a stainless-steel-lined sump. The top of the vault issix to eight feet below grade.High-Level Waste Transfer Trench. The HLW transfer trench is a long concrete vault containingpiping that conveyed waste between the Waste Tank Farm and the Vitrification Facility.Approximately 500 feet long, the trench extends from the Tank 8D-3/Tank 8D-4 vault along thenorth side of Tank 8D-1 and Tank 8D-2 at ground level, before turning to the southwest andentering the north side of the Vitrification Facility. It is six to 20 feet wide and its height rangesfrom six to nine feet. The trench was constructed with reinforced concrete walls and floors, withpre-cast concrete covers. Stainless steel-lined concrete pump pits that house the upper sections ofHLW transfer pumps are located on top of each of the tank vaults. The walls and floors of thepump pits are reinforced concrete, with pre-cast concrete covers forming the roof. There are sixpiping runs in the trench, two of which are unused spares, comprising approximately 3000 linearfeet of double-walled stainless steel pipe. The trench also contains associated valves and jumpers.The pump pits each contain the upper part of the HLW transfer pump and flow monitoringequipment. Pump Pit 8Q-2 over Tank 8D-2 also contains grinding equipment used to size reducezeolite.Permanent Ventilation System Building. The Permanent Ventilation System Building is locatedapproximately 50 feet north of Tank 8D-2. This steel framed and sided building is 40 feet wide,75 feet long, and 16 feet tall and is attached to a 12 inch thick concrete floor slab supported byRev. 1 C-2
WVDP Phase 1 CSAPconcrete footings. The building has a sheet metal roof which supports the Permanent VentilationSystem discharge stack. The Permanent Ventilation System was designed to provide ventilationto the Supernatant Treatment System Support Building, the Supernatant Treatment System valveaisle, the Supernatant Treatment System pipeway, and the HLW tanks. A skid-mounted,Permanent Ventilation System Stack Monitoring Building is located near the east end of thebuilding.Equipment Shelter and Condensers. The Equipment Shelter is a one-story concrete blockbuilding lies immediately north of the Vitrification Facility. It is 40 feet long, 18 feet wide, and12 feet high and has a concrete floor six inches thick, with a small extension on the west side.This structure houses the Waste Tank Farm ventilation system that was formerly used to ventilatethe four waste storage tanks and the Supernatant Treatment System vessels in HLW Tank 8D-1.The condensers are located immediately west of the Equipment Shelter. They were designed tocondense the overheads from Tanks 8D-1 and 8D-2, which were originally designed to be in aself-boiling condition during NFS operations.Con-Ed Building. The Con-Ed Building is a concrete block building located on top of theconcrete vault containing Tank 8D-3 and Tank 8D-4. This building, which is 10 feet wide, 13 feetlong, and 11 feet high, houses the instrumentation and valves used to monitor and control theoperation of Tanks 8D-3 and 8D-4.Supernatant Treatment System Support Building. This building is located adjacent to and aboveTank 8D-1. It is a two-story structure that contains equipment and auxiliary support systemsneeded to operate the Supernatant Treatment System. The upper level is a steel frameworkstructure covered with steel siding. The lower level of the building was constructed withreinforced concrete walls, floors, and ceilings. This building contains a control room; heating,ventilation and air conditioning equipment; utilities; and storage tanks for fresh water and freshzeolite to support Supernatant Treatment System operations. A shielded valve aisle is located onthe lower level of the support building, adjacent to Tank 8D-1. The Supernatant TreatmentSystem pipeway is located on top of the Tank 8D-1 vault. This concrete and steel structurecontains the Supernatant Treatment System piping and structural members that support theSupernatant Treatment System equipment located in Tank 8D-1.Rev. 1 C-3
WVDP Phase 1 CSAPC.2 Physical SettingWMA 3 is located on the North Plateau. It is bounded to the west by WMA 10 and WMA 5, tothe north by WMA 5, to the east by WMA 5, and to the south by WMA 1.The surface of WMA 3 consists of building footprints and compacted surface cover with noappreciable vegetation. WMA 3 is relatively flat and is drained by storm sewer lines.The four waste storage tanks contained within WMA 3 are buried and extend to a depth of 50 to60 feet below grade, including foundations and footer material. This depth is well below thewater table and extends into the Lavery Till.WMA 3 is underlain by the sand and gravel unit, a relatively permeable layer. In generalgroundwater beneath WMA 3 flows to the east and northeast, following surface topography.Underneath the sand and gravel unit is the Lavery Till, a relatively impermeable layer that is apartial barrier to vertical groundwater flow. A limited amount of groundwater does flow verticallydownward through this unit, recharging the underlying Kent Recessional Sequence.There is believed to be a significant amount of buried infrastructure (piping, etc.) associated withthe WMA 3 facilities.C.3 Area HistoryThe WMA 3 area (and in particular its surface soils) has undergone significant reworking sincethe initiation of NFS activities.Figure C.3 shows WMA 3 in 1962 prior to WVDP site development. At this time WMA 3 wasfarmed.Figure C.4 shows WMA 3 in 1966. The footprints of waste tanks 8D-1 and 8D-2 are visible inthis photograph along with the condenser and equipment shelter footprints. The surface of WMA3 appears to be predominately exposed soils.Rev. 1 C-4
WVDP Phase 1 CSAPFigure C.5 shows WMA 3 in 1968. Vegetative cover appears to be returning to the WMA 3surface in this photograph.Figure C.6 shows WMA 3 in 1977. There are no significant changes from 1968.Figure C.7 shows WMA 3 in 1984. There are no significant changes from 1977. As is clear fromthis photograph, the majority of the WMA 3 surface is vegetated or exposed soils.Figure C.8 shows WMA 3 in 1995. Significant surface changes have occurred since 1984, withthe construction of numerous new facilities and above-ground infrastructure.Figure C.9 shows WMA 3 in 2007. There are no significant changes since 1995.Figure C.10 shows a recent oblique aerial photograph of the WMA 3 area taken from thenorthwest. As is clear from this photo, the ground surface has been covered by paving materialwith little evidence of vegetation remaining. Based on historic aerial photographs, the groundsurface was paved sometime after 1984.C.4 Known and Suspected ReleasesC.4.1Cesium ProngPotentially Affected Media:Potentially Affected WMAs:surface soil, subsurface soil, sediments1, 2, 3, 4, 5, 6, 10, 12 NorthIn 1968, a ventilation system filter in the Process Building (in WMA 1) failed, releasingcontaminated particulate up the Process Building stack. A mixture of radionuclides was released,with Cs-137 predominant. Approximately 0.33 Ci particulate gross beta radioactivity wasreleased. The contaminated particulate was deposited on surface soils, resulting in a large area ofcontamination around the Process Building and to the north-northwest. Detectable depositsextend several miles, including beyond the WVDP premises. WMAs 1, 2, 3, 4, 5, 6, 10, and 12North likely are affected. Because Cs-137 is predominant, this area of contamination is known as“the cesium prong” (DOE 2009 Table 2-17, DOE 2010 Section 3.11.5).Rev. 1 C-5
WVDP Phase 1 CSAPAs originally deposited, surface soil activity concentrations should have decreased towards thenorth, away from WMA 1. However, the surface features of many areas within the WVDPpremises have been reworked significantly since the release; as a result, the current spatial anddepth distribution of soil contamination may be significantly different than the original footprint.In addition, the surface soil contamination likely has been naturally spread by erosion and runoffinto surface drainage features; this phenomenon may have enlarged the area impacted bydeposition, although detailed data regarding this effect are not available (DOE 2010Section 3.11.5).Finally, other releases from the Process Building stack may have produced minor impacts. Theseother releases include the 1968 failure of a dissolver off-gas system filter, resulting in 0.28 Ci ofparticulate activity, and the 1968 failure of a vessel off-gas system filter, resulting in the March1968 releases to exceed the monthly allowance by 15 percent (DOE 2010 Section 3.11.5).C.4.2North Plateau Groundwater PlumePotentially Affected Media: subsurface soil, groundwater, sedimentPotentially Affected WMAs: 1, 2, 3, 4, 5, 6Several releases have contributed to a contaminated groundwater plume originating in the area ofthe Process Building (in WMA 1). The plume is expected to have migrated towards the northeast,and to have remained within the WVDP premises. There likely have been groundwater seeps todrainage features, resulting in sediment contamination; these sediment impacts may extendbeyond the WVDP premises. WMAs 1, 2, 3, 4, 5, and 6 likely are affected. Because this area issituated on the North Plateau, the area of contamination is known as “the North PlateauGroundwater Plume.” The predominant mobile contaminant in this plume is Sr-90.The major contribution to the plume occurred in 1968. (Other potential contributing releases arepresented in Sections A.4.3, B.4.3, C.4.3, and E.4.3.) Radioactive acid leaked into the subsurfaceat the southwest corner of the Process Building when Line 7P-240-1-C in the Off-Gas OperatingAisle (within the Process Building) failed. The leakage drained down to the underlying Off-GasCell and the adjacent southwest stairwell, then apparently flowed through an expansion joint inthe concrete floor of the Off-Gas Cell and migrated into the underlying sand and gravel. The leakRev. 1 C-6
WVDP Phase 1 CSAPreleased an estimated 200 gallons of radioactive nitric acid with approximately 93 Ci Sr-90(DOE 2009 Table 2-17).C.4.3Other Known and Suspected ReleasesC.4.3.1Waste Tank Farm OperationsPotentially Affected Media: subsurface soil, groundwaterPotentially Affected WMAs: 3The Waste Tank Farm system is expected to contain residual radioactivity. The total activity inthe 40 underground lines in the immediate vicinity of the Waste Tank Farm has been estimated tobe approximately 117 curies in 2004, with more than 99 percent of this activity associated withCs-137 and Sr-90. The integrity of these lines is not known. There is no evidence that any of thefour waste storage tanks themselves have ever leaked.C.4.3.2Waste Tank Farm Valve Pit SpillPotentially Affected Media:Potentially Affected WMAs:surface soil, subsurface soil, groundwater1, 2, 3, 4, 5, 6 (North Plateau Groundwater Plume)In 1985, a spill of radioactive water occurred in a valve pit located northwest of Tank 8D-2,between Tank 8D-1 and Tank 8D-2. A condensate line failed at its flanged valve bolts.Approximately 500 gallons were released at 4.6 E-02 uCi/mL gross beta and 4E-03 uCi/mL H-3.Some condensate flowed out of the valve pit into the drainage ditch extending towards the OldHardstand in WMA 5 and/or towards WMA 2. The radioactive condensate reached the point inthe drainage ditch where the ditch turns to the northeast, near the corner of the New/OldHardstand. At this point, the ditch was blocked to prevent further downstream flow. The releaseprimarily impacted surface soil in WMA 3. Contaminated soil was removed and placed intocontainers (DOE 2004 Section 4.4.2; DOE 2009 Table 2-18; DOE 2010 Section 3.11.5). Thisrelease likely has contributed to the North Plateau Groundwater Plume.Rev. 1 C-7
WVDP Phase 1 CSAPC.4.3.3Waste Tank Farm Condensate Line LeakPotentially Affected Media: subsurface soil, groundwaterPotentially Affected WMAs: 1, 3Several leaks occurred between 1968 and 1977 that were associated with a condensate line (8P-46-6-A5) from Tank 8D-2. The leaks occurred in the section of the line between the EquipmentShelter (in WMA 3) and the Process Building acid recovery pump room (in WMA 1). This linewas maintained under vacuum. An unexpected 16,400-gallon liquid volume increase in Tank 8D-2 was attributed to groundwater leaking into the line and being drawn into the tank. There is nosurface evidence of out-leakage, but the possibility exists of localized groundwater effects(DOE 2009 Table 2-17; DOE 2010 Section 3.11.5).C.4.3.4Waste Tank Farm Condensate SpillPotentially Affected Media: subsurface soil, groundwaterPotentially Affected WMAs: 3In 1987, condensate from the housing of a portable ventilation unit spilled near Tank 8D-2. Theportable ventilation unit was being disassembled and the condensate spilled onto the gravel abovethe tank. Less than ten gallons of condensate was spilled; no soil or water contamination wasnoted in samples collected (DOE 2009 Table 2-18).C.4.3.5Process Building Stack ReleasePotentially Affected Media: surface soilPotentially Affected WMAs: 1, 3In 2001, airborne particulate was released in droplet form from the stack of the Process Building(in WMA 1). Excess moisture appears to have become entrained in the ventilation system, andwas emitted from the stack as droplets containing radioactive particulates. The release occurredover a period of two months (September – October 2001). The radioactivity release rate was toolow to result in any stack monitoring alarms. The release was discovered during routine radiationsurveys conducted in November 2001 when workers found fixed radioactivity in unexpectedRev. 1 C-8
WVDP Phase 1 CSAPlocations near the Process Building stack. Total releases were less than 0.5% of the administrativerelease limits. Measurements of 4.8E-04 uCi gross beta were recorded. The fallout was confinedto the area several hundred feet from the Process Building, in WMA 1 and WMA 3. Accessibleabove-background spots were decontaminated (DOE 2009 Table 2-18; DOE 2010Section 3.11.5).C.5 Existing DataExisting data sets for this area include:• In 1982, static direct gamma exposure readings were collected across the WVDPpremises (WVNSCO 1982). A portion of WMA 3 was covered by these measurementson a 10-m grid. Figure C.11 shows these results color-coded by the exposure readingsencountered. These data indicated the potential for significant surface contaminationwithin the WMA 3 boundary; however, the interpretation of these data is complicated bythe possibility of shine from the Process Building and other facilities.• In 1990 and 1991, a second static direct gamma exposure measurement program wasconducted across the WVDP premises (WVNSCO 1992). In the case of WMA 3, thiseffort provided systematic coverage for the entire WMA 3 area on a 10-m grid. This datacollection used different instrumentation and protocols than the 1982 study, so the resultsare not quantitatively comparable. Figure C.12 shows these results. These data alsoindicated the potential for significant surface contamination within the WMA 3boundary; however, like the 1982 data sets, the interpretation of these data is complicatedby the possibility of shine from the Process Building and other facilities.• There is no soil sampling data from within the footprint of WMA 3 available withELIMS.• There is limited groundwater data for WMA 3 available within ELIMS from a GeoProbecore and a monitoring well, both located in the southeast corner of the WMA 3 footprint.Figures C.13 and C.14 show the locations of groundwater data collection in the vicinityof WMA 3 (including some from WMA 5) color-coded by Sr-90 and tritium results,respectively. The detection limits for Sr-90 and tritium varied widely among ELIMSRev. 1 C-9
WVDP Phase 1 CSAPsamples. 10 pCi/L and 500 pCi/L were selected as thresholds for Sr-90 and tritium,respectively, because based on ELIMS data results above these activity concentrationswere consistently above method detection limits and so indicative of contaminationimpacts rather than simply measurement error. Contamination was encountered at bothlocations. It is not clear if this contamination represented releases from WMA 3activities, or originated from releases associated with the main processing facility’sactivities.C.6 Planned Phase 1 DP ActivitiesFor a more complete description of planned Phase 1 DP activities, see the Phase 1 DP, Section3.1 and Section 7.5.The waste tank mobilization and transfer pumps, the Con-Ed Building, the Equipment Shelter andcondensers, and the piping and equipment in the HLW transfer trench are slated for removal aspart of Phase 1.Phase 1 does not include the four underground waste tanks, the Permanent Ventilation SystemBuilding, the Supernatant Treatment System Support Building, the high level waste transfertrench itself, or the underground infrastructure.Some Phase 1 activities planned for WMA 1 affect WMA 3. These include a temporary sheetpiling wall that will run along a portion of the WMA 1 and WMA 3 boundary, and a permanentslurry wall that will extend into WMA 3 (Figure C.15). Depending on the outcome of CSAP datacollection work, the planned excavation in WMA 1 may be revised in a way that extends intoWMA 3.C.7 <strong>Conceptual</strong> <strong>Site</strong> <strong>Model</strong>Based on the limited available information, the conceptual site model (CSM) for WMA 3 is asfollows. A number of potential releases within the WMA 3 footprint are known to have occurred,or may have occurred that likely impacted surface and subsurface soils and groundwater. Inaddition, environmental media within WMA 3 have likely been affected to some degree byreleases elsewhere at the WVDP site. These include air deposition contamination on surface soilsRev. 1 C-10
WVDP Phase 1 CSAPand subsurface contamination resulting from contaminant migration via groundwater from theProcess Building.After initiation of the WVDP, the surface of WMA 3 underwent significant reworking. Thisreworking may have covered contaminated soils with clean cover, removed contaminated surfacesoils for disposition elsewhere, and/or re-used contaminated soils as backfill for buildingfoundations or buried infrastructure.Groundwater flow underneath WMA 3 is expected to be, in general, towards the northeast.Consequently one would expect a greater likelihood for groundwater contamination as one movesfrom west to east (assuming releases within the WMA 3 footprint) and from south to north(assuming impacts from contaminated groundwater originating with Process Building activities).Figure C.16 shows the current CSM for surface soils. Figure C.17 shows the CSM for soilsdeeper than 1 m. Figure C.18 shows the CSM for contaminated groundwater beneath WMA 3.C.8 WMA 3-Specific Characterization Goals• Develop an inventory of buried infrastructure• Evaluate appropriateness of the current list of Radionuclides of Interest (ROI)• Verify absence of additional ROI• Determine level and extent of surface contamination• Identify the presence/absence of subsurface soil contamination• Identify soil waste stream characteristics• Define required extent of WMA 1 excavation• Obtain data to support Phase 2 planningC.9 CSAP Pre-Remediation Data Collection and Associated Decision-MakingCSAP pre-remediation data collection will consist of a number of components described in moredetail below.Rev. 1 C-11
WVDP Phase 1 CSAPC.9.1Buried InfrastructureThe footprint of buried infrastructure will be identified and mapped. There is believed to be asignificant quantity of buried infrastructure within the WMA 3 area that would be of potentialinterest. [required]C.9.2Gamma Walkover Survey DataThe purpose of performing a gamma walkover survey of the WMA 3 area is to identify the leveland extent of surface contamination. This includes both general trends in average activityconcentrations pertinent to the surface soil CG w requirement, as well as the identification ofisolated, more-elevated anomalies that might be indicative of discrete releases and/or surface soilCG emc concerns.A complete (100%) logged gamma walkover survey (GWS) will be conducted for accessibleareas within WMA 3. Examples of areas that would not be accessible are areas where there areexisting building footprints and building pads. Based on the GWS results, surface soil withinWMA 3 will be divided into four categories: (1) surface soils where GWS data indicatecontamination above CG w requirements; (2) surface soils where GWS data indicatecontamination, but it is not clear if contamination exceeds surface soil CG w requirement; (3)surface soils where GWS indicate impacts, but those impacts are not expected to exceed surfacesoil CG w standards; and (4) surface soils where there is no indication of impacts abovebackground conditions. The purpose of this data collection is to provide insights into the spatialdistribution of surface contamination, and to guide subsequent soil sampling. Because of theexisting surface cover within the WMA 3 area, the area that can be confidently assessed forsurface contamination by GWS may be limited. [required]C.9.3Surface Soil SamplingBecause of the existing surface cover which is expected to be found over the majority of theWMA 3 area, GWS data collection will be supplemented with systematic surface soil sampling,in addition to biased surface soil sampling that will be conducted in response to elevated GWSdata that might be indicative of hot spots.Rev. 1 C-12
WVDP Phase 1 CSAP• Hot Spots. If GWS data indicate the presence of contamination that possibly exceeds“hot spot” (CG emc ) standards or an isolated elevated area is identified that appearsindicative of a discrete release, the location of concern will be sampled with a biasedsample. If biased samples are collected from a particular location, they will be collectedfrom two depth intervals: 0-15 cm, and 15 cm-1 m. The 0-15 cm samples will beanalyzed for the 12 radionuclides of potential interest in addition to the 18 ROI. Onedown-hole gamma scan will be conducted from each biased location. The purpose ofthese samples is to resolve GWS anomalies, evaluate the appropriateness of the currentROI list, and verify the absence of additional ROI. [contingent]• CG w Sampling. Accessible WMA 3 areas will undergo systematic sampling for surfacecontamination concerns. Sampling locations will be arranged on a systematic, triangulargrid with a grid separation of 20 m. Two samples will be collected from each location,one representative of a 0–15 cm depth and one representative of a 15 cm–1 m depth.Depth will be measured from the interface of cover material and soils. Down-hole gammadata will be collected from each location with static measurements collected for every 15cm depth interval. An estimated 20 locations will undergo this data collection. [required]• If systematic surface soil sampling identifies contamination that appears to extendbeyond the boundaries of WMA 3 into either WMA 5 or WMA 10 and has not beenlaterally bounded by sampling activities in those WMAs, the sampling grid will beextended and sampling continue following the protocols described above until theencountered contamination is laterally bounded. [contingent]C.9.4Subsurface Soil SamplingThe purpose of subsurface soil sampling within WMA 3 is to determine presence and verticalextent of contamination impacts above background levels. The whole of the WMA 3 area isconsidered as potentially having subsurface contamination at depths greater than 1 m. Note thatburied infrastructure concerns may, in some instances, prevent vertically bounding subsurfacesoil contamination that is encountered.• If a 15 cm–1 m sample result exceeds background levels, then an additional sample froma depth of 1–2 m will be collected and analyzed from that location. In addition, down-Rev. 1 C-13
WVDP Phase 1 CSAPhole gamma data will be collected from the location with static measurements collectedfor every 15 cm depth interval. If that sample has contamination above backgroundconditions, then the next deeper 1 m interval will be sampled and analyzed and a downholegamma scan performed. This process will continue until background conditions arereached. [contingent]• If systematic subsurface sampling identified contamination that appears to extendlaterally beyond the grid boundaries in WMA 3, then the grid will be extended andadditional sampling conducted until the lateral extent of contamination has been bounded.[contingent]C.9.5Buried Infrastructure Soil SamplingSoils associated with buried infrastructure within WMA 3 will be sampled to determine theircontamination status. Because of the likely complexity and amount of subsurface infrastructurefeatures within the WMA 3 area, these efforts will focus on infrastructure considered of greatestconcern, such as waste or wastewater lines and buried infrastructure footprints installed after1968 that potentially carried several different buried utility lines.• Three locations along each piece of buried infrastructure that is of concern within WMA3 will be trenched. These locations will be selected to maximize the possibility thatcontamination will be encountered (e.g., locations where historical or current GWS dataindicate surface contamination exists). For infrastructure that crosses the boundarybetween WMA 1 and 3 or that intersects the planned footprint of the WMA 1 slurry wall,one of these locations will be at the boundary/slurry wall intersection. During excavation,exposed soils will be monitored by scans for evidence of elevated gross activity. Thepurpose of this sampling is to evaluate the presence of contaminated soils associated withburied infrastructure. [required]oIf elevated readings are encountered below a depth of 1 m, soils exhibiting thehighest levels of gross activity will be sampled and analyzed.oIf elevated readings are not encountered below a depth of 1 m, a samplerepresentative of soils deeper than 1 m will be collected. In the case ofRev. 1 C-14
WVDP Phase 1 CSAPinfrastructure that did not carry waste or wastewater, the sample will be fromsoils immediately above the line. In the case of infrastructure that did carry wasteor wastewater, the sample will be from soils immediately beneath the line.• If contamination above background conditions is encountered at any selected location,trenching will continue to depth until background conditions are observed. An additionalsample will be collected from the base of the trench to verify background conditions. Thepurpose is to vertically bound observed contamination. [contingent]• If buried infrastructure soil sampling identifies contamination impacts greater thanbackground, biased sampling will continue following the line until at least twoconsecutive locations yield soil samples below surface soil CG w requirements. Locationspacing will be based on engineering judgment, including the geometry of the line, thelevel of contamination encountered, and surface evidence of contamination. The purposeof this sampling is to bound the extent of contamination associated with buriedinfrastructure, as necessary. [contingent]C.9.6Additional ContingenciesSampling and/or GWS data may indicate that contamination exists or extends beneath surfacescurrently covered by existing structures, concrete, asphalt, or hardstands. In this case, “surfacesoil” will be defined as soil immediately beneath the cover. If sampling or GWS data indicate thatcontamination may exist beneath existing structures (e.g., existing buildings and building pads),then sampling locations will be offset along the foundation edge to determine contaminationextent. The purpose of the offset is to allow safe acquisition of data. Data collection throughbuilding pads in WMA 3 will not be required as part of this effort.C.9.7Required <strong>Laboratory</strong> AnalysesAll samples will be submitted for analysis of all 18 ROI.A select portion of the samples as described above may be analyzed for the additional12 radionuclides of potential interest. In addition, 10% of the surface soil samples submitted foranalysis will be analyzed for the 12 radionuclides of potential interest in addition to the 18 ROI. IfRev. 1 C-15
WVDP Phase 1 CSAPthese sample results indicate the presence of the one or more of those radionuclides at levels ofpotential significance, then the balance of samples from WMA 3 will also be analyzed for theadditional radionuclides that were identified.Table C.1 summarizes the required sample numbers and the estimated number of contingencysamples for WMA 3.This sampling plan assumes that quick turn-around analyses are available for Sr-90 and Cs-137and that soil samples will be screened for Sr-90 and Cs-137 prior to being analyzed for thebalance of the ROI. Contingency sampling requirements as described above may be undertakenbased on these screening data.C.9.9Decision-Making SummaryA summary of decision-making based on the WMA 3 data is as follows:• If GWS data indicate anomalies are present, biased samples will be selected to targetthose anomalies.• If sample results from biased or systematic surface samples for the 15 cm–1 m depthinterval indicate contamination above CG requirements, an additional sample from thatlocation representing the depth interval 1–2 m will be collected and this process repeateduntil contamination is vertically bounded.• For each set of buried infrastructure that is identified as a potential concern, at least threetrenches that uncover the infrastructure will be scanned and sampled. If contaminationappears to extend laterally along the line of the infrastructure, additional sampling willtake place until contamination is bounded.C.10 ReferencesDOE 2004. Solid Waste Management Unit Assessment and Description of Current ConditionsReport, West Valley Demonstration Project, prepared by West Valley Nuclear Services,Co. and URS Group, Inc., prepared for DOE, Ohio Field Office, November 2004.Rev. 1 C-16
WVDP Phase 1 CSAPDOE 2009. Phase I Decommissioning Plan for the West Valley Demonstration Project, Rev 2,prepared by Washington Safety Management Solutions, URS Washington Division,Science Applications International Corporation, prepared for DOE, December 2009.DOE 2010. Final Environmental Impact Statement for Decommissioning and/or Long-TermStewardship at the West Valley Demonstration Project and Western New York NuclearService Center, Vol 1, DOE/EIS-0226, January 2010.Rev. 1 C-17
WVDP Phase 1 CSAPTable C.1 Sample Number EstimatesRequired Contingent TotalSystematic Surface Soil20 0 20Samples (0-15 cm)Systematic Surface Soil20 0 20Samples (15 cm-1 m)Biased Surface Soil Samples0 3 3(0-15 cm)Biased Surface Soil Samples0 3 3(15 cm-1 m)Systematic Subsurface Soil0 6 6Samples (1-m intervals)Biased Subsurface Soil0 5 5Samples (1-m intervals)Buried Infrastructure Soil18 12 30SamplesTotal: 58 29 87Rev. 1 C-18
WVDP Phase 1 CSAPFigure C.1 WMA 3Rev. 1 C-19
WVDP Phase 1 CSAPFigure C.2 WMA 3 Facilities (from Phase 1 DP, Figure 3-29)Rev. 1 C-20
WVDP Phase 1 CSAPFigure C.3 WMA 3 Aerial Photograph from 1962Rev. 1 C-21
WVDP Phase 1 CSAPFigure C.4 WMA 3 Aerial Photograph from 1966Rev. 1 C-22
WVDP Phase 1 CSAPFigure C.5 WMA 3 Aerial Photograph from 1968Rev. 1 C-23
WVDP Phase 1 CSAPFigure C.6 WMA 3 Aerial Photograph from 1977Rev. 1 C-24
WVDP Phase 1 CSAPFigure C.7 WMA 3 Aerial Photograph from 1984Rev. 1 C-25
WVDP Phase 1 CSAPFigure C.8 WMA 3 Aerial Photograph from 1995Rev. 1 C-26
WVDP Phase 1 CSAPFigure C.9 WMA 3 Aerial Photograph from 2007Rev. 1 C-27
WVDP Phase 1 CSAP1Figure C.10 WMA 3 Oblique Aerial Photograph (from Phase 1 DP, Figure 3-30)Rev. 1 C-28
WVDP Phase 1 CSAPFigure C.11 WMA 3 1982 Direct Gamma Measurement ResultsRev. 1 C-29
WVDP Phase 1 CSAPFigure C.12 WMA 3 1990 - 1991 Direct Gamma Measurement ResultsRev. 1 C-30
WVDP Phase 1 CSAPFigure C.13 WMA 3 Sr-90 Groundwater ResultsRev. 1 C-31
WVDP Phase 1 CSAPFigure C.14 WMA 3 Tritium Groundwater ResultsRev. 1 C-32
WVDP Phase 1 CSAPFigure C.15 Phase 1 Subsurface Wall PlacementRev. 1 C-33
WVDP Phase 1 CSAPFigure C.16 Initial WMA 3 Surface Soil CSMRev. 1 C-34
WVDP Phase 1 CSAPFigure C.17 Initial WMA 3 Subsurface Soil CSMRev. 1 C-35
WVDP Phase 1 CSAPFigure C.18 Initial WMA 3 Groundwater CSMRev. 1 C-36
WVDP Phase 1 CSAPAPPENDIX DWMA 4 PRE-REMEDIATION DATA COLLECTIOND.1 BackgroundWaste Management Area 4 (WMA 4) is approximately 10 acres in size. The only WVDP facilitywithin WMA 4 is the Construction and Demolition Debris Landfill (CDDL) (see Figure D.1 formap). Disposal operations at the CDDL began as early as 1963 and continued through 1981 underNuclear Fuel Services and 1984 under the WVDP.D.2 Physical SettingWMA 4 is located on the North Plateau. It is bounded to the east by the WVDP fence line, to thenorth by WMA 12 North, to the west by WMA 5, and to the south by WMA 2.WMA 4 is vegetated. It is relatively flat, sloping towards the north and east. It is drainedprimarily by the Swamp Ditch which runs through WMA 4, along the north side of the CDDL.The Swamp Ditch and associated contributing ditches have been identified as radiological controlareas because of the discharge of contaminated groundwater from the North Plateau GroundwaterPlume. North of the CDDL there are several wetland areas where groundwater discharges beforeflowing off the WVDP project premises.WMA 4 is underlain by the sand and gravel unit which overlies the Lavery Till. The sand andgravel unit has been subdivided into the Thick Bedded Unit (TBU) and the underlying SlackWater Sequence (SWS), both of which are present beneath WMA 4. Groundwater in the sand andgravel unit flows to the northeast across the North Plateau, discharging to surface drainagefeatures such as the wetlands and Swamp Ditch, and to seeps off-premises along Franks Creekand Quarry Creek. The Lavery Till has low permeability but groundwater does flow verticallydownward through this unit recharging the underlying Kent Recessional Sequence.Rev. 1 D-1
WVDP Phase 1 CSAPD.3 Area HistoryWMA 4 was not used for any structural purposes during the lifespan of the NFS reprocessingactivities on-site or for any WVDP-related activities other than solid waste disposal in the CDDL.The surface drainage features have been reworked over time to accommodate the CDDL.Figure D.2 shows WMA 4 in 1962 prior to site development. At this time WMA 4 was grasslandand woodland with a marsh or pond in the vicinity of what is now the southwestern corner of theCDDL.Figure D.3 shows WMA 4 in 1966. Development of WMA 5 and WMA 2 is visible. Apart fromsome surface scarring in what is now the eastern end of the CDDL that potentially indicateslimited disposal operations, there are no visible impacts in WMA 4.Figure D.4 shows WMA 4 in 1968. There is no visible change from 1966.Figure D.5 shows WMA 4 in 1977. Additional development of the CDDL area is visible. Inparticular there is some surface scarring, and what appears to be a trench or linear drain installedfrom southwest to northeast across what is now the CDDL footprint, presumably to improvedrainage of the area, and a similar parallel feature to the north of the present CDDL footprint.Figure D.6 shows WMA 4 in 1984. In this photograph, the CDDL has significantly expanded,with placement of material visible. In the eastern end of the CDDL footprint, flowinggroundwater discharge is visible.Figure D.7 shows WMA 4 in 1995. Disposal operations in the CDDL were terminated inDecember 1984 and the closure of the landfill was certified complete by NYSDEC in 1986. Thecurrent configuration of the Swamp Ditch is visible. The Lag Storage additions in WMA 5 havealso been completed adjacent to WMA 4.Figure D.8 shows WMA 4 in 2007. There is no visible change in WMA 4 since 1995.Rev. 1 D-2
WVDP Phase 1 CSAPD.4 Known and Suspected ReleasesD.4.1Cesium ProngPotentially Affected Media:Potentially Affected WMAs:surface soil, subsurface soil, sediments1, 2, 3, 4, 5, 6, 10, 12 (northern portion)In 1968, a ventilation system filter in the Process Building (in WMA 1) failed, releasingcontaminated particulate up the Process Building stack. A mixture of radionuclides was released,with Cs-137 predominant. Approximately 0.33 Ci particulate gross beta radioactivity wasreleased. The contaminated particulate was deposited on surface soils, resulting in a large area ofcontamination around the Process Building and to the north-northwest. Detectable depositsextend several miles, including beyond the WVDP premises. WMAs 1, 2, 3, 4, 5, 6, 10, and 12North likely are affected. Because Cs-137 is predominant, this area of contamination is known as“the cesium prong” (DOE 2009 Table 2-17, DOE 2010 Section 3.11.5).As originally deposited, surface soil activity concentrations should have decreased towards thenorth, away from WMA 1. However, the surface features of many areas within the WVDPpremises have been reworked significantly since the release; as a result, the current spatial anddepth distribution of soil contamination may be significantly different than the original footprint.In addition, the surface soil contamination likely has been naturally spread by erosion and runoffinto surface drainage features; this phenomenon may have enlarged the area impacted bydeposition, although detailed data regarding this effect are not available (DOE 2010Section 3.11.5).Finally, other releases from the Process Building stack may have produced minor impacts. Theseother releases include the 1968 failure of a dissolver off-gas system filter, resulting in 0.28 Ci ofparticulate activity, and the 1968 failure of a vessel off-gas system filter, resulting in the March1968 releases to exceed the monthly allowance by 15 percent (DOE 2010 Section 3.11.5).Rev. 1 D-3
WVDP Phase 1 CSAPD.4.2North Plateau Groundwater PlumePotentially Affected Media: subsurface soil, groundwater, sedimentPotentially Affected WMAs: 1, 2, 3, 4, 5, 6Several releases have contributed to a contaminated groundwater plume originating in the area ofthe Process Building (in WMA 1). The plume is expected to have migrated towards the northeast,and to have remained within the WVDP premises. There likely have been groundwater seeps todrainage features, resulting in sediment contamination; these sediment impacts may extendbeyond the WVDP premises. WMAs 1, 2, 3, 4, 5, and 6 likely are affected. Because this area issituated on the North Plateau, the area of contamination is known as “the North PlateauGroundwater Plume.” The predominant mobile contaminant in this plume is Sr-90.The major contribution to the plume occurred in 1968. (Other potential contributing releases arepresented in Sections A.4.3, B.4.3, C.4.3, and E.4.3.) Radioactive acid leaked into the subsurfaceat the southwest corner of the Process Building when Line 7P-240-1-C in the Off-Gas OperatingAisle (within the Process Building) failed. The leakage drained down to the underlying Off-GasCell and the adjacent southwest stairwell, then apparently flowed through an expansion joint inthe concrete floor of the Off-Gas Cell and migrated into the underlying sand and gravel. The leakreleased an estimated 200 gallons of radioactive nitric acid with approximately 93 Ci Sr-90 (DOE2009 Table 2-17).D.4.3Other Known and Suspected ReleasesThere are no known or suspected releases that originated within WMA 4. Debris and wasteplaced in the CDDL was supposed to have been free of radioactive contaminants.D.5 Existing DataExisting data sets for this area include:• In 1982 static direct exposure readings were collected across the WVDP premises(WVNSCO 1982). Figure D.9 shows these data. At the time, the greatest WMA 4impacts were apparent along the western and southern portions of WMA 4.Rev. 1 D-4
WVDP Phase 1 CSAP• In 1990 and 1991 a second static direct exposure measurement program was conductedacross the WVDP premises (WVNSCO 1992). In the case of WMA 4, this effortprovided systematic coverage of its area on a 10-m grid. It used differentinstrumentation/protocols than the 1982 study, so the results are not quantitativelycomparable. However, the 1990-1991 data collection effort did provide insights intosurface soil contamination across WMA 4 (Figure D.10). Impacts were more pronouncedand widespread across WMA 4 in this data set, indicating additional impacts may haveoccurred since the prior 1982 survey.• There have been several historical soil/sediment sampling activities in WMA 4.Environmental monitoring via soil/sediment sampling has taken place since 1991 to thepresent at location SNSWAMP (Figure D.1). Soil and sediment samples were alsocollected in 1993 as part of the RFI. Finally, in 2008, a fairly intensive sampling programwas conducted in the ditch portions of WMA 4 to support planned remediation activitiesfor the North Plateau Groundwater Plume. Table D.1 summarizes the amount of soil dataavailable for the 18 Radionuclides of Interest (ROI).Figure D.11 shows soil/sediment sampling locations and provides surface Cs-137 and Sr-90 results for those locations with surface soil samples or sediment samples. The bulk ofhistorical data collection has focused on ditches and so provides little information aboutthe contamination status of soils in the rest of the WMA 4 area. The historical samplingdid find Cs-137 and Sr-90 contamination in most samples that included some well abovesurface soil CG w standards in surface sediments/soils associated with the ditches. Theobserved Cs-137 is likely due to a combination of surficial deposition and consolidationof contamination within ditch sediments through erosional processes. The observed Sr-90contamination is likely tied to contaminated groundwater discharges to the ditches. TheSS/SB-PRB series samples from the ditch along the west side of the CDDL onlymeasured gross alpha and gross beta; for many of these samples gross beta activity wassignificantly elevated above background indicating likely Sr-90 contamination.• There is a significant amount of groundwater data collection from the southern portion ofthe WMA 4 area, linked to historical efforts to characterize Sr-90 contamination ingroundwater in that area. Figure D.12 shows the locations of groundwater data collectionRev. 1 D-5
WVDP Phase 1 CSAPcolor-coded by Sr-90 results. Figure D.13 shows the locations of groundwater datacollection color-coded by tritium results. These locations are a mixture of GeoProbelocations where groundwater samples were collected at a specific point in time,monitoring wells with a limited duration of sampling events, and monitoring wells withextensive sampling histories, all from the sand and gravel unit overlying the Lavery Till.The detection limits for Sr-90 and tritium varied widely among ELIMS samples. 10pCi/L and 500 pCi/L were selected as thresholds for Sr-90 and tritium, respectively,because based on ELIMS data results above these activity concentrations wereconsistently above method detection limits and so indicative of contamination impactsrather than simply measurement error.In general, Sr-90 and tritium groundwater impacts are present in the southern portion ofWMA 4. The Sr-90 and tritium activity concentrations, in general, decrease as one movesto the east and north. However, there is insufficient groundwater data from the northernportion of the WMA 4 to definitively state that groundwater impacts do not exist in thatportion of WMA 4.D.6 Planned Phase 1 DP ActivitiesThere are no planned Phase 1 decommissioning remediation activities for WMA 4.As a separate activity, DOE has installed a permeable treatment wall to address the North PlateauGroundwater Plume south of the CDDL, in WMA 2. The North Plateau Groundwater Plume andthis treatment wall are discussed in more detail in Appendix B.D.7 <strong>Conceptual</strong> <strong>Site</strong> <strong>Model</strong>Based on the available information, the conceptual site model (CSM) for WMA 4 is as follows.No environmental releases of radioactive contamination within WMA 4 are believed to haveoccurred. However, environmental media within WMA 4 have been affected to some degree byreleases elsewhere at the WVDP site. These impacts include air deposition contamination onsurface soils at least along the western and southern portions of WMA 4, contamination in ditchesresulting from erosion and sedimentation from other contaminated portions of the site and fromthe discharge of contaminated groundwater, and groundwater contamination beneath at least theRev. 1 D-6
WVDP Phase 1 CSAPsouthern portion of WMA 4. In particular, significant ditch soil and sediment contaminationexists that exceeds Phase 1 surface soil CG w standards.Wastes placed in the CDDL were reportedly un-impacted by radionuclide contamination.However, given the fact that contaminated groundwater is moving through the contents of theCDDL, the working assumption is that currently CDDL contents likely have low-levelradioactive contamination present (DOE 2009 Section 2.4.3).Figure D.14 shows the current CSM for surface soils. Figure D.15 shows the CSM for soilsdeeper than 1 m. Subsurface soil contamination is assumed to be the result of and coincide withgroundwater contamination, although detectable groundwater contamination may exist in areaswhere soil contamination levels would not be detectable or differentiable from background.Figure D.16 shows where measurable groundwater impacts likely exist based on existinginformation.D.8 WMA 4-Specific Characterization Goals• Evaluate appropriateness of the current list of ROI• Determine level and extent of surface contamination• Identify soil waste stream characteristics• Obtain data to support Phase 2 planningA significant portion of the WMA 4 subsurface is known to be impacted by contaminatedgroundwater. In this portion of the WVDP premises, contaminated groundwater movement is ongoing,with the North Plateau Groundwater Plume growing as time progresses. A permeabletreatment wall has been deployed to address this contamination, and will likely alter the futurefate and transport of Sr-90 in this area. Additional characterization and enhanced monitoring arepart of the wall’s remedial design. Further characterization of subsurface contamination (soil andgroundwater) in WMA 4 is not within the current scope of the CSAP, beyond potentiallyvertically bounding the extent of surface contamination.Rev. 1 D-7
WVDP Phase 1 CSAPD.9 CSAP Pre-Remediation Data Collection and Associated Decision-MakingCSAP pre-remediation data collection will consist of a number of components described in moredetail below.D.9.1Gamma Walkover Survey DataThe purpose of performing a gamma walkover survey of the WMA 4 area is to identify the leveland extent of surface contamination. This includes both general trends in average activityconcentrations pertinent to the surface soil CG w requirement, as well as the identification ofisolated, more-elevated anomalies that might be indicative of discrete releases and/or surface soilCG emc concerns.A complete (100%) logged gamma walkover survey (GWS) will be conducted for accessibleareas within WMA 4. Examples of areas within WMA 4 that would not be accessible are areaswhere standing water is present in wetlands. Based on the GWS results, surface soil within WMA4 will be divided into four categories: (1) surface soils where GWS data indicate contaminationabove CG w requirements; (2) surface soils where GWS data indicate contamination, but it is notclear if contamination exceeds surface soil CG w requirement; (3) surface soils where GWSindicate impacts, but those impacts are not expected to exceed surface soil CG w standards; and (4)surface soils where there is no indication of impacts above background conditions. The purposeof this data collection is to provide insights into the spatial distribution of surface contamination,and to guide subsequent soil sampling. [required]D.9.2Surface Soil SamplingSurface soil sampling will be used to address areas inaccessible to GWS data collection, toresolve hot spots identified by the GWS data, and to evaluate the presence, absence, and/or extentof surface contamination above surface soil CG w requirements based on GWS results.• Wetlands. It is possible that standing water will be present in wetlands that prevent GWSdata collection from those areas. Soil sampling will be required for wetland footprints andfor any other areas where standing water prevents the collection of GWS data. WithinRev. 1 D-8
WVDP Phase 1 CSAPWMA 4, this is most likely to occur in the northern and northwestern portion of theWMA.For every area where standing water or saturated soil conditions prevent GWS datacollection, systematic soil sampling will take place. For wetland areas less than 200 m 2 insize, one sample will be collected. For areas between 200 and 1,000 m 2 in size, onesample per 200 m 2 will be collected. For areas between 1,000 and 2,500 m 2 in size, fivesamples will be collected. For areas exceeding 2,500 m 2 in size, at minimum one samplewill be collected per 500-m 2 area. One sample will be collected from each locationrepresentative of a 0–15 cm depth interval. In the case where an area has more than onelocation, locations will be selected so that each representative area does not overlap andprovides systematic coverage of the area of interest. [contingent]• Hot Spots. If GWS data indicate the presence of contamination that possibly exceeds“hot spot” (CG emc ) standards or an isolated elevated area is identified that appearsindicative of a discrete release, the location of concern will be sampled with a biasedsample. If biased samples are collected from a particular location, they will be collectedfrom two depth intervals: 0-15 cm, and 15 cm-1 m. The 0–15 cm samples will beanalyzed for the 12 radionuclides of potential interest in addition to the 18 ROI. Onedown-hole gamma scan will be conducted from each biased location. The purpose ofthese samples is to resolve GWS anomalies, evaluate the appropriateness of the currentROI list, and verify the absence of additional ROI. [contingent]• CG w Sampling. Surface soil sampling may be conducted after the GWS to further clarifyresults, with the level and nature of sampling dependent on GWS results.oIf GWS results indicate contamination impacts above background levels but thatsurface soil contaminant levels exceeding surface soil CG w requirements areunlikely, the area of interest will be systematically sampled using a triangulargrid with a density of one sample per 400 m 2 . One sample will be collected fromeach location representative of a 0–15 cm depth interval. Locations will beselected to provide systematic coverage of the areas. The purpose is to documentthe activity concentrations present in surface soils within WMA 4. [contingent]Rev. 1 D-9
WVDP Phase 1 CSAPoIf GWS results indicate surface soil contaminant levels exceeding surface soilCG w requirements likely exist, one sampling location will be selected at thehighest gross activity level to confirm surface soil CG w exceedances and anotherset of sampling locations will be identified to spatially bound the extent ofcontamination (i.e., along the boundary of what is considered likely abovesurface soil CG w requirements) if this is not obvious from the GWS data. Twosamples will be collected from the location targeting high gross activity levels,one representative of a 0–15 cm depth interval, and one representative of a 15cm-1 m depth interval. One sample will be collected from each location intendedto laterally bound contamination, representative of a 0-15 cm depth interval. Inaddition, the location targeting high gross activity levels will have one down-holegamma scan conducted at the center of the location with static measurementstaken every 15 cm. The purpose is to document surface soil CG w requirementexceedances and bound the lateral extent of contamination. [contingent]oIf GWS results indicate areas with surface soil contamination impacts but it isunclear whether surface soil CG w requirement exceedances are present, at mostfive sampling locations will be selected that systematically cover the areas ofinterest. One sample will be collected from each location representative of a 0-15cm depth interval. Locations will be selected to provide systematic coverage ofthe area of interest. The purpose is to resolve the question of whether surface soilCG w requirement exceedances exist for areas where GWS results are ambiguous.[contingent]oIf any 0-15 cm interval yields a sample result indicating a surface soil CG wrequirements exceedance and that sample location is not laterally bounded eitherby existing sampling locations with results less than surface soil CG wrequirements or by GWS data that clearly indicate contamination is not aconcern, additional sampling locations will be selected so that the contaminationencountered is spatially bounded. The purpose is to laterally boundcontamination that is above CG w requirements. [contingent]Rev. 1 D-10
WVDP Phase 1 CSAPD.9.3Subsurface Soil SamplingThe purpose of subsurface soil sampling within WMA 4 is to determine presence and verticalextent of contamination impacts above background levels. Much of the WMA 4 subsurface ispotentially impacted by contamination associated with the North Plateau Groundwater Plume.Significant historical data collection has been dedicated to characterizing the extent and level ofthis plume. The sampling described by this section is not intended to further characterize theNorth Plateau Groundwater Plume. It is intended to characterize surface contamination thatextends to depths greater than a meter outside the known North Plateau Groundwater Plumefootprint and/or contamination overlain by a thin layer of clean soil.• If any 0-15 cm surface soil sample result indicates contamination impacts abovebackground levels and there was not a 15 cm-1 m sample collected from that location, a15 cm-1 m sample will be collected from that location following the protocols used forthe original 0-15 cm surface soil sample. In addition, each soil location will have onedown-hole gamma scan conducted at the center of the location with static measurementstaken every 15 cm. [contingent]• If a 15cm -1 m sample result exceeds background levels, then an additional sample froma depth of 1-2 m will be collected and analyzed from that location. In addition, downholegamma data will be collected from the location with static measurements collectedfor every 15 cm depth interval. If that sample has contamination above backgroundconditions, then the next deeper 1 m interval will be sampled and analyzed and a downholegamma scan performed. This process will continue until background conditions arereached. [contingent]D.9.4Drainage Feature SamplingWMA 4 contains two primary drainage features. The first runs from the northwestern corner ofWMA 4 towards the east, along the CDDL, discharging on the east side of WMA 4 at the WVDPfence line. This feature is known as the Swamp Ditch. The portion of the Swamp Ditch that runsalong the north side of the CDDL is carried by a buried pipe. The second drainage feature runseast along the southern edge of the CDDL before turning north and connecting with the SwampDitch. For drainage features within WMA 4, the surface soil CG w requirements apply. SurfaceRev. 1 D-11
WVDP Phase 1 CSAPdrainage feature sampling will be conducted to determine ditch sediment contamination statusrelative to surface soil CG w requirements. Surface drainage features will be sampled as follows:• Samples representing a 0-15 cm depth interval will be collected from ditch sediments. InWMA 4, the primary drainage features have a combined length of approximately 450 m.Samples will be systematic located using a random start, separated by 30 m. Thissampling will not address the buried portion of the Swamp Ditch along the north side ofthe CDDL. [required]• If any 0-15 cm sample result indicates contamination impacts above background levelsand a 15 cm-1 m sample was not also collected, a 15 cm-1 m sample will be collectedfrom that location following the protocols used for the original 0-15 cm sample.[contingent]• If a sample indicates contamination impacts above background levels for the 15 cm -1 mdepth interval, an additional sample from a depth of 1-2 m will be collected and analyzedfrom that location. This will be repeated, as necessary, until the vertical extent ofcontamination impact is bounded at that location. [contingent]D.9.5Additional ContingenciesSampling and/or GWS data may indicate that contamination exists or extends beneath surfacescurrently covered by existing structures, concrete, asphalt, or gravel. In this case, “surface soil”will be defined as soil immediately beneath the cover. If sampling or GWS data indicate thatcontamination may exist beneath existing structures (e.g., the CDDL), then sampling locationswill be offset along the foundation edge to determine contamination extent. The purpose of theoffset is to allow safe acquisition of data. Data collection through the CDDL in WMA 4 will notbe required as part of this effort.D.9.6Required <strong>Laboratory</strong> AnalysesAll samples will be submitted for analysis of all 18 ROI.Rev. 1 D-12
WVDP Phase 1 CSAPA select portion of the samples as described above may be analyzed for the additional12 radionuclides of potential interest. If these sample results indicate the presence of the one ormore of those radionuclides at levels of potential significance, then the balance of samples fromWMA 4 will also be analyzed for the additional radionuclides that were identified.Table D.2 summarizes the required sample numbers and the estimated number of contingencysamples for WMA 4.This sampling plan assumes that quick turn-around analyses are available for Sr-90 and Cs-137and that soil samples will be screened for Sr-90 and Cs-137 prior to being analyzed for thebalance of the ROI. Based on these screening data, contingency sampling requirements asdescribed above may be undertaken without the benefit of the remaining analyses.D.9.7Decision-Making SummaryA summary of decision-making based on the WMA 4 data is as follows:• If portions of WMA 4 are too wet to conduct a GWS, systematic surface soil samplinglocations will be conducted to characterize those areas.• If GWS indicate anomalies are present, biased samples will be selected to target thoseanomalies.• If biased sample results for the 15 cm-1 m depth interval indicate contamination aboveCG requirements, an additional sample from that location representing the depth interval1-2 m will be collected and this process repeated until contamination is verticallybounded.• The WMA 4 surface soil initial CSM as contained in Figure D.14 will be adjusted basedon GWS results. These adjustments may affect systematic sample number requirements.• If GWS results do not indicate likely surface soil CG w requirement exceedances, fivelocations with the highest GWS results will be selected for sampling.Rev. 1 D-13
WVDP Phase 1 CSAP• If the GWS results indicate areas that likely exceed surface soil CG w requirements, onelocation will be selected for sampling with the highest GWS results, and surface soilsample locations will be selected to laterally bound contamination.• If the GWS results are ambiguous with respect to surface soil CG w requirements, surfacesampling locations will be selected to clarify GWS results.• If systematic surface soil samples exceed background levels, sampling will continue todepth at those locations until the encountered contamination is vertically bounded.D.10 ReferencesDOE 2009. Phase I Decommissioning Plan for the West Valley Demonstration Project, Rev 2,prepared by Washington Safety Management Solutions, URS Washington Division,Science Applications International Corporation, prepared for DOE, December 2009.DOE 2010. Final Environmental Impact Statement for Decommissioning and/or Long-TermStewardship at the West Valley Demonstration Project and Western New York NuclearService Center, Vol 1, DOE/EIS-0226, January 2010.Rev. 1 D-14
WVDP Phase 1 CSAPTable D.1 Historical Data AnalysesNuclide# of SurfaceSoilLocations# ofSubsurfaceSoilLocations# of SedimentLocationsAm-241 0 0 5C-14 0 0 0Cm-243 0 0 0Cm-244 0 0 0Cs-137 5 4 5I-129 0 0 0Np-237 0 0 0Pu-238 0 0 5Pu-239 0 0 5Pu-240 0 0 5Pu-241 0 0 4Sr-90 7 13 5Tc-99 0 0 0U-232 0 0 5U-233 0 0 5U-234 0 0 1U-235 0 0 5U-238 0 0 5Rev. 1 D-15
WVDP Phase 1 CSAPTable D.2 Sample Number EstimatesRequired Contingent TotalSystematic Sediment Samples 15 0 15(0-15 cm)Systematic Sediment Samples0 8 8(15 cm-1 m)Biased Sediment Samples0 2 2(0-15 cm)Systematic Surface Soil0 15 15Samples (0-15 cm)Systematic Surface Soil0 4 4Samples (15 cm-1 m)Biased Surface Soil Samples0 3 3(0-15 cm)Contingent Surface Soil0 20 20SamplesTotal: 15 55 70Rev. 1 D-16
WVDP Phase 1 CSAPFigure D.1 WMA 4Rev. 1 D-17
WVDP Phase 1 CSAPFigure D.2 WMA 4 Aerial Photograph from 1962Rev. 1 D-18
WVDP Phase 1 CSAPFigure D.3 WMA 4 Aerial Photograph from 1966Rev. 1 D-19
WVDP Phase 1 CSAPFigure D.4 WMA 4 Aerial Photograph from 1968Rev. 1 D-20
WVDP Phase 1 CSAPFigure D.5 WMA 4 Aerial Photograph from 1977Rev. 1 D-21
WVDP Phase 1 CSAPFigure D.6 WMA 4 Aerial Photograph from 1984Rev. 1 D-22
WVDP Phase 1 CSAPFigure D.7 WMA 4 Aerial Photograph from 1995Rev. 1 D-23
WVDP Phase 1 CSAPFigure D.8 WMA 4 Aerial Photograph from 2007Rev. 1 D-24
WVDP Phase 1 CSAPFigure D.9 1982 Direct Gamma Measurement Results for WMA 4Rev. 1 D-25
WVDP Phase 1 CSAPFigure D.10 1990 – 1991 Direct Gamma Measurement ResultsRev. 1 D-26
WVDP Phase 1 CSAPFigure D.11 Historical Surface Sampling Locations and Surface ResultsRev. 1 D-27
WVDP Phase 1 CSAPFigure D.12 Historical Groundwater Sr-90 ResultsRev. 1 D-28
WVDP Phase 1 CSAPFigure D.13 Historical Groundwater Tritium ResultsRev. 1 D-29
WVDP Phase 1 CSAPFigure D.14 Initial WMA 4 Surface Soil CSMRev. 1 D-30
WVDP Phase 1 CSAPFigure D.15 Initial WMA 4 Subsurface Soil CSMRev. 1 D-31
WVDP Phase 1 CSAPFigure D.16 Initial WMA 4 Groundwater CSMRev. 1 D-32
WVDP Phase 1 CSAPAPPENDIX EWMA 5 PRE-REMEDIATION DATA COLLECTIONE.1 BackgroundWaste Management Area 5 (WMA 5) is approximately 19 acres in size and contains variousbuildings, building pads from buildings previously removed, paved surfaces, open grassland andwetlands, and hardstands historically used for storage (see Figures E.1 and E.2 for maps).Descriptions of the various features of WMA 5 follow, and are taken from the Phase 1 DP,Section 3.1.2:Remote-Handled Waste Facility. The Remote-Handled Waste Facility is located in the westernportion of WMA 5. It is a metal-sided, steel-frame building that includes a Receiving Area, aBuffer Cell, a Work Cell, a Waste Packaging Area, an Operating Aisle, and a Load-Out /TruckBay. The Receiving Area includes a 20-ton bridge crane that also provides access into theadjacent Buffer Cell. The Buffer Cell is an air lock between the Receiving Area and thecontaminated Work Cell. The Work Cell is the primary work area, with provisions for fullyremote handling, surveying, segmenting, decontaminating, and repackaging operations. Thisshielded space is 55 feet by 22 feet by 26 feet high, and is served by a 30-ton bridge crane. Anyspent decontamination solutions generated during operations were transferred to below-gradewastewater storage tanks located in a vault below the building for management before treatment.These tanks and vault will be removed during Phase 1 decommissioning. The Waste PackagingArea includes capability to load both waste drums and boxes. The Operating Aisle houses twowaste processing and packaging work stations and one waste sampling transfer work station.Each work station includes a shield window in the shield wall, and controllers for remotelyoperating facility equipment. This facility and its concrete floor slab will be removed duringPhase 1 decommissioning.Lag Storage Building Slab. The Lag Storage Building was a sheet metal structure built in 1984to store low level waste. It was supported by a clear span frame and anchored to a 140 foot longby 60 foot wide concrete slab foundation. The slab surface was coated with an acid-resistant, two-Rev. 1 E-1
WVDP Phase 1 CSAPcoat, application of epoxy sealer. It was demolished down to its concrete floor slab in October2006.Lag Storage Addition 1 Slab. Lag Storage Addition 1 was a pre-engineered steel frame and fabricstructure built in 1987 to store containerized LLW. It was 191 feet long by 55 feet wide by 23 feethigh. It was removed down to its grade level floor in October 2006. It falls within the CPC-WSAhardstand footprint.Lag Storage Addition 2 Foundation. Lag Storage Addition 2 was a tent structure that was builtin 1988 and dismantled in 1993 after it was damaged by high winds. The foundation consists ofeight inches of crushed stone covering an area 65 feet by 200 feet. It falls within the CPC-WSAhardstand footprint.Lag Storage Addition 3. Lag Storage Addition 3, like Lag Storage Addition 4, is a clear-spanstructure, with a pre-engineered steel frame and steel sheathing, about 290 feet long, 90 feet wideand 40 feet high, on a seven-inch thick concrete slab. It is scheduled to be removed down to itsconcrete floor slab during the work to achieve the interim end state.Lag Storage Addition 4. Lag Storage Addition 4 is a clear-span structure, with a pre-engineeredsteel frame and steel sheathing. It measures approximately 290 feet long, 90 feet wide, and 40feet high, and it rests on a seven-inch thick concrete slab. It is similar to Lag Storage Addition 3,except that it includes a Shipping Depot, a Container Sorting and Packaging Facility, and acovered Passageway between the Lag 3 and Lag 4 buildings. The Shipping Depot is connected toLag Storage Addition 4 and is a 91 foot by 85 foot metal frame structure. This facility and itsconcrete floor slab will be removed during Phase 1 decommissioning.Chemical Process Cell Waste Storage Area. Also known as the CPC-WSA hardstand, this wastestorage area includes a structure used to store equipment removed from the Chemical ProcessCell. The structure is a 200 foot by 70 foot by 30 foot high galvanized steel-panel enclosure witha gravel pad floor. It will be removed down to its gravel pad during the work to achieve theinterim end state.Hardstands. Several compacted gravel pads (also known as hardstands) are located withinWMA 5:Rev. 1 E-2
WVDP Phase 1 CSAP• The Lag Hardstand, also known as the New/Old Hardstand, is located southwest of LagStorage Additions 3 and 4 and is used to store packaged equipment and containers of lowlevel waste. The original hardstand (“Old Hardstand”) was reworked as part of WVDPactivities, with a portion of its original footprint now under Lag Storage Additions 3 and 4,and part incorporated into the New Hardstand.• The Cold Hardstand, which is located west of the Construction and Demolition DebrisLandfill (WMA 4), has been used as a nonradioactive material staging and storage area.• The Vitrification Vault and Empty Container Hardstand is located north and west of theHazardous Waste Storage Lockers, and falls within the CPC-WSA hardstand footprint.• The HLW Tank Pump Storage Vault Area. This falls within the CPC-WSA hardstandfootprint.Hazardous Waste Storage Lockers. Four steel hazardous waste storage lockers are located east ofthe Waste Tank Farm (WMA 3). Each locker measures eight feet by 16 feet by eight feet highand is used for short-term storage of hazardous waste. The lockers will be removed during thework to achieve the interim end state. The lockers fall within the footprint of the CPC-WSAhardstand.E.2 Physical SettingWMA 5 is located in the northwest corner of the WVDP premises on the North Plateau. To thenorth and west is the WVDP fence line. To the northeast is WMA 12 North. To the south areWMA 10 and WMA 3. To the east are WMA 2 and WMA 4.WMA 5 includes a significant amount of wetlands in its northeast portion. It is drained by acombination of storm sewer lines and a surface drain that flows to the northeast, exiting theWVDP project premises in the northeast corner of WMA 5 and eventually emptying into QuarryCreek through surface water discharge location WSNSW74A north of the project premises.Rev. 1 E-3
WVDP Phase 1 CSAPWMA 5 is underlain by the sand and gravel unit which overlies the Lavery Till. The sand andgravel unit has been subdivided into the Thick Bedded Unit (TBU) and the underlying SlackWater Sequence (SWS). The SWS is only present in WMA 5 along the boundary separatingWMA 5 from WMA 2. Groundwater in the sand and gravel unit flows to the northeast across theNorth Plateau. Groundwater eventually discharges to ditches draining the site and to seeps alongQuarry Creek to the north, and Franks Creek to the east. The Lavery Till has low permeability butgroundwater does flow vertically downward through this unit recharging the underlying KentRecessional Sequence.Approximately five acres of WMA 5 are currently covered by asphalt or compacted gravel. Anadditional 2.5 acres are covered by building foundations.The majority of WMA 5’s soil surface has been reworked at least once since the inception of thesite.E.3 Area HistoryFigure E.3 shows WMA 5 in 1962, prior to site development. At this time, a road passed throughthe WMA 5 area and the majority of its surface was farmed (with the exception of wetlands in thenortheast portion of WMA 5).Figure E.4 shows WMA 5 in 1966, after site development began. Approximately four acres in itssouth central area had been cleared and the Old Hardstand is clearly visible (approximately 0.75acres in size).Figure E.5 shows WMA 5 in 1968. No further development of the area is visible.Figure E.6 shows WMA 5 in 1977. No further development of the area is visible.Figure E.7 shows WMA 5 in 1984. The Lag Storage Building has been added to WMA 5 and theOld Hardstand is clearly delineated in this photograph.Rev. 1 E-4
WVDP Phase 1 CSAPFigure E.8 shows WMA 5 in 1995. The majority of buildings and hardstands that currently existwithin the WMA 5 area had been completed by this time, likely resulting in a significantreworking of surface soils to support construction.Figure E.9 shows WMA 5 in 2007. Much of the surface scarring visible in E.7 due to constructionactivities has been re-vegetated. The Remote Handled Waste Facility had been built by 2007.E.4 Known and Suspected ReleasesE.4.1Cesium ProngPotentially Affected Media:Potentially Affected WMAs:surface soil, subsurface soil, sediments1, 2, 3, 4, 5, 6, 10, 12 (northern portion)In 1968, a ventilation system filter in the Process Building (in WMA 1) failed, releasingcontaminated particulate up the Process Building stack. A mixture of radionuclides was released,with Cs-137 predominant. Approximately 0.33 Ci particulate gross beta radioactivity wasreleased. The contaminated particulate was deposited on surface soils, resulting in a large area ofcontamination around the Process Building and to the north-northwest. Detectable depositsextend several miles, including beyond the WVDP premises. WMAs 1, 2, 3, 4, 5, 6, 10, and 12North likely are affected. Because Cs-137 is predominant, this area of contamination is known as“the cesium prong” (DOE 2009 Table 2-17, DOE 2010 Section 3.11.5).As originally deposited, surface soil activity concentrations should have decreased towards thenorth, away from WMA 1. However, the surface features of many areas within the WVDPpremises have been reworked significantly since the release; as a result, the current spatial anddepth distribution of soil contamination may be significantly different than the original footprint.In addition, the surface soil contamination likely has been naturally spread by erosion and runoffinto surface drainage features; this phenomenon may have enlarged the area impacted bydeposition, although detailed data regarding this effect are not available (DOE 2010Section 3.11.5).Rev. 1 E-5
WVDP Phase 1 CSAPFinally, other releases from the Process Building stack may have produced minor impacts. Theseother releases include the 1968 failure of a dissolver off-gas system filter, resulting in 0.28 Ci ofparticulate activity, and the 1968 failure of a vessel off-gas system filter, resulting in the March1968 releases to exceed the monthly allowance by 15 percent (DOE 2010 Section 3.11.5).E.4.2North Plateau Groundwater PlumePotentially Affected Media: subsurface soil, groundwater, sedimentPotentially Affected WMAs: 1, 2, 3, 4, 5, 6Several releases have contributed to a contaminated groundwater plume originating in the area ofthe Process Building (in WMA 1). The plume is expected to have migrated towards the northeast,and to have remained within the WVDP premises. There likely have been groundwater seeps todrainage features, resulting in sediment contamination; these sediment impacts may extendbeyond the WVDP premises. WMAs 1, 2, 3, 4, 5, and 6 likely are affected. Because this area issituated on the North Plateau, the area of contamination is known as “the North PlateauGroundwater Plume.” The predominant mobile contaminant in this plume is Sr-90.The major contribution to the plume occurred in 1968. (Other potential contributing releases arepresented in Sections A.4.3, B.4.3, C.4.3, and E.4.3.) Radioactive acid leaked into the subsurfaceat the southwest corner of the Process Building when Line 7P-240-1-C in the Off-Gas OperatingAisle (within the Process Building) failed. The leakage drained down to the underlying Off-GasCell and the adjacent southwest stairwell, then apparently flowed through an expansion joint inthe concrete floor of the Off-Gas Cell and migrated into the underlying sand and gravel. The leakreleased an estimated 200 gallons of radioactive nitric acid with approximately 93 Ci Sr-90(DOE 2009 Table 2-17).E.4.3Other Known and Suspected ReleasesE.4.3.1Old Hardstand ReleasePotentially Affected Media:Potentially Affected WMAs:surface soil, subsurface soil, groundwater1, 2, 3, 4, 5, 6 (North Plateau Groundwater Plume)Rev. 1 E-6
WVDP Phase 1 CSAPIn 1982 and 1983, evidence of a significant release of radioactivity was discovered at the OldHardstand. This release was apparently associated with outdoor storage of contaminatedequipment and radioactive waste by NFS. Leakage from that equipment contaminated thehardstand’s asphalt surface and the adjacent soil and drainage ditch. Gamma radiation levels ashigh as 1,500 mR/hr were measured two inches above the ground surface. In 1983, abovegroundportions of contaminated trees were removed. In 1984, approximately 1,700 cubic yards ofmaterials (asphalt, soil, and vegetation) were removed from the area and placed in thedecommissioned Lagoon 1. (Waste from Lagoon 1 had previously been transferred to Lagoon 2;both lagoons are in WMA 2.) Lagoon 1 was then capped with a clay cover. In 1991/1992, somelow levels of radioactively contaminated soil were encountered along the northeastern margin ofthe Old Hardstand; soils above background levels were placed in storage containers and taken toon-site storage facilities. A 1995 estimate of the activity in the debris placed in Lagoon 1 totaledapproximately 18 Ci (DOE 2004 Section 4.6.1, DOE 2009 Table 2-17; DOE 2010Section 3.11.5). This release likely has contributed to the North Plateau Groundwater Plume.E.4.3.2Waste Tank Farm Valve Pit SpillPotentially Affected Media:Potentially Affected WMAs:surface soil, subsurface soil, groundwater1, 2, 3, 4, 5, 6 (North Plateau Groundwater Plume)In 1985, a spill of radioactive water occurred in a valve pit located in WMA 3, northwest of Tank8D-2. A condensate line failed at its flanged valve bolts. Approximately 500 gallons werereleased at 4.6 E-02 uCi/mL gross beta and 4E-03 uCi/mL tritium. Some condensate flowed outof the valve pit into the drainage ditch extending towards the Old Hardstand in WMA 5 and/ortowards WMA 2. The radioactive condensate reached the point in the drainage ditch where theditch turns to the northeast, near the corner of the New/Old Hardstand. At this point, the ditch wasblocked to prevent further downstream flow. The release primarily impacted surface soil in WMA3. Contaminated soil was removed (DOE 2009 Table 2-18; DOE 2010 Section 3.11.5). Thisrelease likely has contributed to the North Plateau Groundwater Plume.E.4.3.3Spent Resin Drum SpillPotentially Affected Media: subsurface soil, groundwaterPotentially Affected WMAs: 5Rev. 1 E-7
WVDP Phase 1 CSAPIn 1987, water from a 55-gallon drum containing spent resin leaked, spilling water on the ground.The drum was being transferred from the New/Old Hardstand to a waste solidification area in theProcess Building (WMA 1) when leakage was noted. Less than 15 gallons was spilled. Thewetted soil was measured at less than 100 dpm/g gross beta. A small amount of contaminated soilwas removed (DOE 2009 Table 2-18; DOE 2010 Section 3.11.5).E.5 Existing DataExisting data sets for this area include:• In 1982, static direct exposure readings were collected across the WVDP premises(WVNSCO 1982). All of WMA 5 was covered by these measurements on a 10-m grid.Figure E.10 shows these results color-coded by the exposure readings encountered, withthe data overlain on a 1977 aerial photograph. Interpretation of these data in the vicinityof the Process Building is complicated by possible shine impacts. These data indicate thepotential for significant surface contamination extending north from the WMA 3boundary. Although the color-coding used for Figure E.10 does not show it, the footprintof the Old Hardstand had direct gamma readings as much as ten times higher than thesurrounding soils. In general, direct gamma readings decreased with distance from theProcess Building. Table E.1 summarizes the availability of historical analytical data forsoils for each of the eighteen ROI.• In 1990 and 1991, a second static direct exposure measurement program was conductedacross the WVDP premises (WVNSCO 1992). In the case of WMA 5, this effortprovided systematic coverage for most of the WMA 5 area on a 10-m grid with theexception of the Old Hardstand and its immediate surroundings (likely due toconstruction activities at the time). This data collection used different instrumentation andprotocols than the 1982 study, so the results are not quantitatively comparable. Also,interpretation of these data in the vicinity of the Lag storage buildings may be affected bypossible shine impacts. Figure E.11 shows these results overlain on a 1984 aerialphotograph. Unlike other areas of the site, the 1990/91 survey for WMA 5 encounteredvalues significantly higher than those originally encountered in 1982, particularly alongthe northern boundary of WMA 5. In addition, the spatial pattern of surface direct readingRev. 1 E-8
WVDP Phase 1 CSAPresults was the opposite of 1982 – areas closer to the Process Building had lower valuesthan areas more distant. A possible explanation is the construction activities in WMA 5that were taking place resulting in displaced and/or covered surface soil nearer to theProcess Building, and the potential for run-off of contaminated surface soils towards thedrainage features that border WMA 5 to the north.• Soil sample data have been collected for WMA 5 that are available in ELIMS. FigureE.12 shows the locations of surface soil samples and soil cores with subsurface soilsamples. GPBG0208, MWPTW-1, and MWPTW-2 were completed in 2008. The NPseries cores were completed in 1994. All other sampling was done in 1993. Figure E.12also shows the Cs-137 and Sr-90 results for surface samples from these locations whensurface samples were collected. Surface contamination is scattered throughout WMA 5,with observed activity concentrations likely controlled by historical activities that havemodified surface features in this area. In the subsurface there was evidence of Sr-90impacts that extended along the southeastern border of WMA 5 and that extended west atleast to beneath the footprints of Lag Storage Buildings 3 and 4.• Groundwater sample data also have been collected for WMA 5 that are available withinELIMS. Figure E.13 shows the locations of groundwater data collection color-coded bySr-90 results. Figure E.14 shows the locations of groundwater data collection color-codedby tritium results. These locations are a mixture of GeoProbe locations wheregroundwater samples were collected at a specific point in time, monitoring wells with alimited duration of sampling events, and monitoring wells with extensive samplinghistories. The detection limits for Sr-90 and tritium varied widely among ELIMSsamples. 10 pCi/L and 500 pCi/L were selected as thresholds for Sr-90 and tritium,respectively, because based on ELIMS data results above these activity concentrationswere consistently above method detection limits and so indicative of contaminationimpacts rather than simply measurement error.In general, Sr-90 and tritium groundwater impacts are present in the eastern half of WMA5, although in some cases at levels close to detection limits. The Sr-90 activityconcentrations, in general, increase as one moves from west to east in WMA 5. In theeastern corner of WMA 5, groundwater impacts likely reflect the North PlateauGroundwater Plume.Rev. 1 E-9
WVDP Phase 1 CSAPE.6 Planned Phase 1 DP ActivitiesFor a more complete description of planned Phase 1 DP activities, see the Phase 1 DP, Section3.1 and Section 7.6.Two WMA 5 structures will remain standing at the initiation of Phase 1 activities: Lag StorageAddition 4 and the Remote-Handled Waste Facility. These structures and all remaining gravelpads, concrete floor slabs, and foundations within WMA 5 will be removed as part of Phase 1activities, including the top two feet of soil beneath hardstands and building pads.E.7 <strong>Conceptual</strong> <strong>Site</strong> <strong>Model</strong>WMA 5 potentially has impacts from a variety of releases. Some of these impacts are to thesurface, and some are to the subsurface. In addition, historic surface soil reworking throughoutWMA 5 has possibly resulted in subsurface soil contamination. Specifically:• WMA 5 surface soils were affected by the 1968 airborne releases of radioactivity. Theseimpacts originally would have been greatest proximal to the Process Building and wouldhave decreased as one moved north in WMA 5. Since 1968, however, there has beensignificant surface soil reworking throughout much of WMA 5. These activities couldhave removed contaminated soil layers, buried those layers under clean backfill, and/orredistributed/mixed contamination in surface soils. As a result, it is likely thatcontamination, if present, would be isolated and associated with physical features (e.g.,buried infrastructure, building foundations, hardstands, etc.). Consequently, thiscontamination would not necessarily be detectable by surface scanning techniques suchas a gross activity gamma scan. The disposition of potentially contaminated surface soilswithin WMA 5 during the WVDP construction process is not known.• Along with the construction of new facilities within WMA 5 as part of the WVDP, therelikely was the placement of significant amounts of buried infrastructure. Given the fairlyheavy surface soil contamination present at the time of the initiation of the WVDP, it ispossible that backfill used for buried infrastructure is also contaminated at levels thatRev. 1 E-10
WVDP Phase 1 CSAPwould be of concern. Depending on the depth of the buried infrastructure, this could haveresulted in contamination at depths significantly greater than one meter.• The Old Hardstand was known to have been contaminated by releases associated with itsuse. The Old Hardstand was reworked as part of WVDP activities and the area is nowoccupied by the Lag Storage Buildings and the New Hardstand. As a result, soils in thevicinity of the Old Hardstand and beneath its footprint (now covered by pavement andportions of the Lag Storage Buildings’ slabs) are likely impacted also.• The 1985 WMA 3 condensate release likely resulted in contamination of the drainageditch that connected WMA 3 with the Old Hardstand area in WMA 5.• Sediments in the drainage feature that originally ran along the Old Hardstand anddischarged out the through the northeastern corner of WMA 5 is likely impacted fromOld Hardstand releases, and from contaminated surface soil erosion/deposition processes.• The foundation of the Lag Storage Addition 2 and associated soils are expected to becontaminated by releases associated with material stored in that facility.• Subsurface releases from the Process Building may have impacted subsurface soils andgroundwater in WMA 5 along its southeastern border. The western and northern extent ofthese subsurface soil impacts is unknown.• The prevalence of low levels of Sr-90 and tritium groundwater contamination in theeastern half of WMA 5 indicates other sources of contamination besides the ProcessBuilding. These could include contamination arising from historic hardstand spills, fromWMA 3, from buried infrastructure, or from other releases within WMA 5 that were notdocumented.Figure E.15 shows the current <strong>Conceptual</strong> <strong>Site</strong> <strong>Model</strong> (CSM) for surface soils. Based onhistorical direct gamma readings and the limited available historical surface soil sampling results,all surface soils within WMA 5 are considered potentially above surface soil CG w standards.Figure E.16 shows the CSM for soils deeper than 1 m. Subsurface soil contamination, if it exists,Rev. 1 E-11
WVDP Phase 1 CSAPis most likely associated with those areas affected by WVDP construction activities. Figure E.17shows where measurable groundwater impacts likely exist based on existing information.E.8 WMA 5-Specific Characterization Goals• Evaluate Appropriateness of the Current List of Radionuclides of Interest (ROI)• Verify Absence of Additional ROI• Explore the Possibility of Surrogate ROI• Determine Extent of Surface Contamination• Identify the Presence/Absence of Subsurface Soil Contamination• Identify Soil Waste Stream Characteristics• Develop an Inventory of Buried Infrastructure• Obtain Data to Support Phase 2 PlanningE.9 CSAP Pre-Remediation Data Collection and Associated Decision-MakingCSAP pre-remediation data collection will consist of a number of components described in moredetail below.E.9.1Buried InfrastructureThe footprint of buried infrastructure will be identified and mapped. Buried infrastructure thatmay exist or is known to exist within WMA 5 includes storm sewer lines and buried utilities.[required]E.9.2Gamma Walkover Survey DataThe purpose of performing a gamma walkover survey of the WMA 5 area is to identify the leveland extent of surface contamination. This includes both general trends in average activityconcentrations pertinent to the surface soil CG w requirement, as well as the identification ofisolated, more-elevated anomalies that might be indicative of discrete releases and/or surface soilCG emc concerns.Rev. 1 E-12
WVDP Phase 1 CSAPA complete (100%) logged gamma walkover survey (GWS) will be conducted for accessibleareas within WMA 5. Examples of areas that would not be accessible are areas where standingwater is present in wetlands, existing building footprints, and building pads. Based on the GWSresults, surface soil within WMA 5 will be divided four categories: (1) surface soils where GWSdata indicate contamination above CG w requirements; (2) surface soils where GWS data indicatecontamination, but it is not clear if contamination exceeds surface soil CG w requirement; (3)surface soils where GWS indicate impacts, but those impacts are not expected to exceed surfacesoil CG w standards; and (4) surface soils where there is no indication of impacts abovebackground conditions. The purpose of this data collection is to provide insights into the spatialdistribution of surface contamination, and to guide subsequent soil sampling. [required]E.9.3Surface Soil SamplingSurface soil sampling will be used to address areas inaccessible to GWS data collection, toresolve hot spots identified by the GWS data, and to evaluate the presence, absence, and/or extentof surface contamination above surface soil CG w requirements based on GWS results.• Wetlands. It is possible that standing water will be present in wetlands that prevent GWSdata collection from those areas. Soil sampling will be required for wetland footprints andfor any other areas where standing water prevents the collection of GWS data. WithinWMA 5, this is most likely to occur in the northeast portion of the WMA.For every area where standing water or saturated soil conditions prevent GWS datacollection, systematic soil sampling will take place. For wetland areas less than 200 m 2 insize, one sample will be collected. For areas between 200 and 1,000 m 2 in size, onesample per 200 m 2 will be collected. For areas between 1,000 and 2,500 m 2 in size, fivesamples will be collected. For areas exceeding 2,500 m 2 in size, at minimum one samplewill be collected per 500-m 2 area. One sample will be collected from each locationrepresentative of a 0-15 cm depth interval. Samples will be collected to providesystematic coverage of the wetland of interest. [contingent]• Hot Spots. If GWS data indicate the presence of contamination that possibly exceeds“hot spot” (CG emc ) standards or an isolated elevated area is identified that appearsindicative of a discrete release, the location of concern will be sampled with a biasedRev. 1 E-13
WVDP Phase 1 CSAPsample. If biased samples are collected from a particular location, they will be collectedfrom two depth intervals: 0-15 cm, and 15 cm-1 m. The 0-15 cm samples will beanalyzed for the 12 radionuclides of potential interest in addition to the 18 ROI. Onedown-hole gamma scan will be conducted from each biased location. The purpose ofthese samples is to resolve GWS anomalies, evaluate the appropriateness of the currentROI list, and verify the absence of additional ROI. [contingent]• CG w Sampling. Surface soil sampling may be conducted after the GWS to further clarifyresults, with the level and nature of sampling dependent on GWS results. For WMA 5,surface soil CG w sampling in response to GWS results will primarily focus on areas thatare currently not paved; the paved central portion of WMA 5 will be addressed withsystematic gridded soil sampling.oIf GWS results indicate contamination impacts above background levels but thatsurface soil contaminant levels exceeding surface soil CG w requirements areunlikely, the area of interest will be systematically sampled using a triangulargrid with a density of one sample per 400 m 2 s. One sample will be collected fromeach location representative of a 0-15 cm depth interval. Locations will beselected so that they provide systematic coverage of the area of interest with atarget density of one sample per 200 m 2 area. The purpose is to document theactivity concentrations present in surface soils within WMA 5. [contingent]oIf GWS results indicate surface soil contaminant levels exceeding surface soilCG w requirements likely exist, one sampling location will be selected at thehighest gross activity level to confirm surface soil CG w exceedances and anotherset of sampling locations will be identified to spatially bound the extent ofcontamination (i.e., along the boundary of what is considered likely abovesurface soil CG w requirements) if this is not obvious from the GWS data. Twosamples will be collected from the location targeting high gross activity levels,one representative of a 0-15 cm depth interval, and one representative of a 15cm-1 m depth interval. One sample will be collected from each location intendedto laterally bound contamination, representative of a 0-15 cm depth interval. Inaddition, the location targeting high gross activity levels will have one down-holegamma scan conducted at the center of the location with static measurementsRev. 1 E-14
WVDP Phase 1 CSAPtaken every 15 cm. The purpose is to document surface soil CG w requirementexceedances and bound the lateral extent of contamination. [contingent]oIf GWS results indicate areas with surface soil contamination impacts but it isunclear whether surface soil CG w requirement exceedances are present, at mostfive sampling locations will be selected that systematically cover the areas ofinterest. One sample will be collected from each location representative of a 0-15cm depth interval. Locations will be selected to provide systematic coverage ofthe area of interest. The purpose is to resolve the question of whether surface soilCG w requirement exceedances exist for areas where GWS results are ambiguous.[contingent]oIf any 0-15 cm interval yields a sample result indicating a surface soil CG wrequirements exceedance and that sample location is not laterally bounded eitherby existing sampling locations with results less than surface soil CG wrequirements or by GWS data that clearly indicate contamination is not aconcern, additional sampling locations will be selected so that the contaminationencountered is spatially bounded. The purpose is to laterally boundcontamination that is above CG w requirements. [contingent]• The area where surface soil contamination is potentially overlain by pavement or a layerof clean backfill (see Figure E.16, approximately 9 acres) will undergo systematicsampling for surface soil contamination concerns. Sampling locations will be arranged ona systematic triangular grid with a grid separation of 20 m. One soil sample will becollected from each location representative of a 0-1 m depth. Down-hole gamma data willbe collected from each location with static measurements collected for every 15 cm depthinterval. An estimated 120 locations will undergo this data collection. [required]E.9.4Subsurface Soil SamplingThe purpose of subsurface soil sampling within WMA 5 is to determine the presence and verticalextent of contamination impacts above background levels. There are several areas within WMA 5that have subsurface soil contamination concerns that are discussed below. These include areasalong the New Hardstand that were originally drainage features but subsequently filled in withRev. 1 E-15
WVDP Phase 1 CSAPsoils and a drainage feature that originally connected WMA 3 with the Old Hardstand ditches, butthat was subsequently filled with soils and paved.• A minimum of six soil trenches will be completed orthogonal to the drainage ditch thatoriginally ran along the west and north side of the Old Hardstand. These trenches will beto a minimum of 1 meter depth. Soils will be scanned for elevated activity as the trenchproceeds. A minimum of two samples will be collected from each trench. The first willrepresent those soils with the highest elevated activity. If the floor of the trench indicatesthat contamination above background levels extends deeper than 1 m, the trench will beextended vertically until there is no detectable evidence via scans of elevated activity inthe trench floor. The second soil sample will represent soils from final floor of the trench.All samples will be analyzed for the 18 ROI and the additional 12 radionuclides ofpotential interest. [required]• A minimum of three soil trenches will be completed orthogonal to the original drainageditch that connected WMA 3 with the Old Hardstand’s drainage features. These trencheswill be to a minimum of 1-m depth. Soils will be scanned for elevated activity as thetrench proceeds. A minimum of two samples will be collected from each trench. The firstwill represent those soils with the highest elevated activity. If the floor of the trenchindicates that contamination above background levels extends deeper than 1 m, the trenchwill be extended vertically until there is no detectable evidence via scans of elevatedactivity in the trench floor. The second soil sample will represent soils from final floor ofthe trench. All samples will be analyzed for the 18 ROI and the additional12 radionuclides of potential interest. [required]• If a 15 cm-1 m sample result exceeds background levels, then an additional sample froma depth of 1-2 m will be collected and analyzed from that location. In addition, downholegamma data will be collected from the location with static measurements collectedfor every 15-cm depth interval. If that sample has contamination above backgroundconditions, then the next deeper 1-m interval will be sampled and analyzed and a downholegamma scan performed. This process will continue until background conditions arereached. [contingent]Rev. 1 E-16
WVDP Phase 1 CSAP• If any 0-15 cm surface soil sample result indicates contamination impacts abovebackground levels and there was not a 15 cm-1 m sample collected from that location, a15 cm-1 m sample will be collected from that location following the protocols used forthe original 0-15 cm surface soil sample. In addition, each soil location will have onedown-hole gamma scan conducted at the center of the location with static measurementstaken every 15 cm. [contingent]• If systematic subsurface sampling identified contamination that appears to extendlaterally beyond the grid boundaries in WMA 5, then the grid will be extended andadditional sampling conducted until the lateral extent of contamination has been bounded.[contingent]E.9.5Drainage Feature SamplingWMA 5 contains two primary drainage features. The first runs from the New Hardstand to theWVDP fence line in the northeast corner of WMA 5 (Figure E.1), discharging at locationWSNSW74A. The second runs north-to-south along the western edge of the paved WMA 5 area.For drainage features within WMA 5, the surface soil CG w requirements apply. Surface drainagefeature sampling will be conducted to determine ditch sediment contamination status relative tosurface soil CG w requirements. Surface drainage features will be sampled as follows:• Samples representing a 0-15 cm depth interval will be collected from ditch sediments. InWMA 5, the primary drainage features have a combined length of approximately 360 m.Samples will be systematic located using a random start, separated by 30 m. [required]• If any 0-15 cm sample result indicates contamination impacts above background levelsand a 15 cm-1 m sample was not also collected, a 15 cm-1 m sample will be collectedfrom that location following the protocols used for the original 0-15 cm sample.[contingent]• If a sample indicates contamination impacts above background levels for the 15 cm -1 mdepth interval, an additional sample from a depth of 1-2 m will be collected and analyzedfrom that location. This will be repeated, as necessary, until the vertical extent ofcontamination impact is bounded at that location. [contingent]Rev. 1 E-17
WVDP Phase 1 CSAPE.9.6Buried Infrastructure Soil SamplingSoils associated with buried infrastructure within WMA 5 will be sampled to determine theircontamination status.• Three locations along each piece of buried infrastructure that is of concern within WMA5 will be trenched. These locations will be selected to maximize the possibility thatcontamination will be encountered (e.g., locations where historical or current GWS dataindicate surface contamination exists). During excavation, exposed soils will bemonitored by scans for evidence of elevated gross activity. The purpose of this samplingis to evaluate the presence of contaminated soils associated with buried infrastructure.[required]oIf elevated readings are encountered below a depth of 1 m, soils exhibiting thehighest levels of gross activity will be sampled and analyzed.oIf elevated readings are not encountered below a depth of 1 m, a samplerepresentative of soils deeper than 1 m will be collected. In the case ofinfrastructure that did not carry waste or wastewater, the sample will be fromsoils immediately above the line. In the case of infrastructure that did carry wasteor wastewater, the sample will be from soils immediately beneath the line.• If contamination above background conditions is encountered at any selected location,trenching will continue to depth until background conditions are observed. An additionalsample will be collected from the base of the trench to verify background conditions. Thepurpose is to vertically bound observed contamination. [contingent]• If buried infrastructure soil sampling identifies contamination impacts greater thanbackground, biased sampling will continue following the line until at least twoconsecutive locations yield soil samples below surface soil CG w requirements. Locationspacing will be based on engineering judgment, including the geometry of the line, thelevel of contamination encountered, and surface evidence of contamination. The purposeRev. 1 E-18
WVDP Phase 1 CSAPof this sampling is to bound the extent of contamination associated with buriedinfrastructure, as necessary. [contingent]E.9.7Additional ContingenciesSampling and/or GWS data may indicate that contamination exists or extends beneath surfacescurrently covered by existing structures, concrete, asphalt, or gravel. In this case, “surface soil”will be defined as soil immediately beneath the cover. If sampling or GWS data indicate thatcontamination may exist beneath existing structures (e.g., existing buildings and building pads),then sampling locations will be offset along the foundation edge to determine contaminationextent. The purpose of the offset is to allow safe acquisition of data. Data collection throughbuilding pads and hardstands in WMA 5 will not be required as part of this effort.E.9.8Required <strong>Laboratory</strong> AnalysesAll samples will be submitted for analysis of all 18 ROI.A select portion of the samples as described above may be analyzed for the additional12 radionuclides of potential interest. If these sample results indicate the presence of the one ormore of those radionuclides at levels of potential significance, then the balance of samples fromWMA 5 will also be analyzed for the additional radionuclides that were identified.Table E.2 summarizes the required sample numbers and the estimated number of contingencysamples for WMA 5.This sampling plan assumes that quick turn-around analyses are available for Sr-90 and Cs-137and that soil samples will be screened for Sr-90 and Cs-137 prior to being analyzed for thebalance of the ROI. Contingency sampling requirements as described above may be undertakenbased on these screening data.Rev. 1 E-19
WVDP Phase 1 CSAPE.9.9Decision-Making SummaryA summary of decision-making based on the WMA 5 data is as follows:• For each piece of buried infrastructure of concern that is identified, three biased locationswill be selected, excavation conducted to expose the line, and a soil sample formed fromsoils most likely contaminated. If contamination is encountered above surface soil CG wrequirements, sampling will continue along these lines until it is bounded.• If the GWS identifies a surface soil anomaly that potentially exceeds the surface soilCG emc , that location will be sampled and analyzed.• Biased soil sampling from trenches orthogonal to the western and northern edges of theOld Hardstand. In the event that the initial sampling work does not bound the verticalextent of contamination, soil cores will be extended/vertical trenching continued untilbackground soil conditions are reached.• Systematic subsurface soil sampling will take place on a triangular grid within the zoneof WMA 5 where subsurface soil contamination is a concern. In the event thatcontamination is encountered that is not laterally bounded, the sampling grid will beextended until contamination is laterally bounded.• The WMA 5 surface soil area classification as contained in Figure E.15 will be adjustedbased on GWS results. These adjustments may affect systematic surface sample numberrequirements and will affect the placement of the initial round of systematic surface soilsample locations.• If any 15 cm-1 m soil interval encounters contamination above surface soil CG wrequirements, additional deeper 1-m interval soil samples will be required for thatlocation to determine vertical extent of contamination. If additional vertical samples arerequired, vertical sampling will continue until background conditions are observed.Rev. 1 E-20
WVDP Phase 1 CSAPE.10 ReferencesDOE 2004. Solid Waste Management Unit Assessment and Description of Current ConditionsReport, West Valley Demonstration Project, prepared by West Valley Nuclear Services,Co. and URS Group, Inc., prepared for DOE, Ohio Field Office, November 2004.DOE 2009. Phase I Decommissioning Plan for the West Valley Demonstration Project, Rev 2,prepared by Washington Safety Management Solutions, URS Washington Division,Science Applications International Corporation, prepared for DOE, December 2009.DOE 2010. Final Environmental Impact Statement for Decommissioning and/or Long-TermStewardship at the West Valley Demonstration Project and Western New York NuclearService Center, Vol 1, DOE/EIS-0226, January 2010.Rev. 1 E-21
WVDP Phase 1 CSAPTable E.1 Historical Data AnalysesNuclide# of SurfaceSoilLocations# ofSubsurfaceSoilLocations# of SedimentLocationsAm-241 2 6 1C-14 0 1 0Cm-243 0 0 0Cm-244 0 0 0Cs-137 11 8 1I-129 0 1 0Np-237 0 1 0Pu-238 1 6 2Pu-239 1 6 2Pu-240 1 6 2Pu-241 1 6 1Sr-90 9 10 2Tc-99 0 1 0U-232 1 6 2U-233 1 6 2U-234 1 6 2U-235 1 6 2U-238 1 6 2Rev. 1 E-22
WVDP Phase 1 CSAPTable E.2 Sample Number EstimatesRequired Contingent TotalSystematic Sediment Samples 12 0 12(0-15 cm)Systematic Sediment Samples0 4 4(15 cm-1 m)Systematic Surface Soil18 0 18Samples (0-15 cm)Systematic Surface Soil120 10 130Samples (15 cm-1 m)Biased Surface Soil Samples0 6 6(0-15 cm)Biased Surface Soil Samples0 6 6(15 cm-1 m)Contingent Surface Soil0 20 20SamplesSystematic Subsurface Soil0 12 12Samples (1-m intervals)Biased Subsurface Soil0 6 6Samples (1-m intervals)Buried Infrastructure Soil12 12 24SamplesTotal: 162 76 238Rev. 1 E-23
WVDP Phase 1 CSAPWMA 12Chemical Process CellWaste Storage AreaLag Storage Area 3ColdHardstandRHWF CargoContainersCPC-WSAHardstandNew/OldHardstandLag Storage AreaWMA 10Figure E.1 WMA 5 (adapted from Phase 1 DP, Figure 3-5)Rev. 1 E-24
WVDP Phase 1 CSAPFigure E.2 WMA 5 with TopographyRev. 1 E-25
WVDP Phase 1 CSAPFigure E.3 WMA 5 1962 Aerial PhotographRev. 1 E-26
WVDP Phase 1 CSAPFigure E.4 WMA 5 1966 Aerial PhotographRev. 1 E-27
WVDP Phase 1 CSAPFigure E.5 WMA 5 1968 Aerial PhotographRev. 1 E-28
WVDP Phase 1 CSAPFigure E.6 WMA 5 1977 Aerial PhotographRev. 1 E-29
WVDP Phase 1 CSAPFigure E.7 WMA 5 1984 Aerial PhotographRev. 1 E-30
WVDP Phase 1 CSAPFigure E.8 WMA 5 1995 Aerial PhotographRev. 1 E-31
WVDP Phase 1 CSAPFigure E.9 WMA 5 2007 Aerial PhotographRev. 1 E-32
WVDP Phase 1 CSAPFigure E.10 WMA 5 1982 Direct Gamma Measurement ResultsRev. 1 E-33
WVDP Phase 1 CSAPFigure E.11 WMA 5 1990 - 1991 Direct Gamma Measurement ResultsRev. 1 E-34
WVDP Phase 1 CSAPFigure E.12 WMA 5 Historical Soil Sampling LocationsRev. 1 E-35
WVDP Phase 1 CSAPFigure E.13 Historical Groundwater Sr-90 ResultsRev. 1 E-36
WVDP Phase 1 CSAPFigure E.14 Historical Groundwater Tritium ResultsRev. 1 E-37
WVDP Phase 1 CSAPFigure E.15 WMA 5 Initial Surface Soil CSMRev. 1 E-38
WVDP Phase 1 CSAPFigure E.16 WMA 5 Initial Subsurface Soil CSMRev. 1 E-39
WVDP Phase 1 CSAPFigure E.17 WMA 5 Assumed Extent of Groundwater ImpactsRev. 1 E-40
WVDP Phase 1 CSAPAPPENDIX FWMA 6 PRE-REMEDIATION DATA COLLECTIONF.1 BackgroundWaste Management Area 6 (WMA 6) is approximately 14.5 acres in size and contains a varietyof facilities, including the Rail Spur, the Above-Ground Petroleum Storage Tank, the SewageTreatment Plant, the New Cooling Tower, the two Demineralizer Sludge Ponds, the EqualizationBasin, the Equalization Tank, the South Waste Tank Farm Test Tower, the Road-Salt and SandShed, and the LLW Rail Packaging and Staging Area (see Figures F.1 and F.2 for maps).Descriptions of the various features of WMA 6 follow, and are taken from the Phase 1 DP,Section 3.1.2.:Rail Spur. The rail spur runs about 8,000 feet from the south side of the Process Building towhere it connects to the main line of the railroad. The rails are cast iron and the ties are creosotepressure-treated wood. The Rail Spur will not be addressed by Phase 1 decommissioningactivities.Old Sewage Treatment Plant. The Old Sewage Treatment Plant was a small structure locatedapproximately 60 m south of the Process Building. It was connected to the Process Building by aburied sewage line. It discharged to an open ditch via an underground line approximately 70 m tothe southeast. It was replaced by the Sewage Treatment Plant, which used a completely differentset of supply and discharge lines than the Old Sewage Treatment Plant.Sewage Treatment Plant. The Sewage Treatment Plant is a wood frame structure 41 feet by 44feet by 15 feet high, with metal siding and roofing. The base of the facility is concrete andcrushed stone. The Sewage Treatment Plant is used to treat sanitary wastewater and contains sixin-ground concrete tanks, one above-ground polyethylene tank, and one above-ground stainlesssteel tank. The Sewage Treatment Plant will be removed during Phase 1 decommissioningactivities, along with its concrete foundation and the underground concrete tanks.Rev. 1 F-1
WVDP Phase 1 CSAPNew Cooling Tower. The New Cooling Tower is 20 feet by 20 feet by 11 feet high and it standson a concrete basin. The floor of the basin is an eight inch-thick concrete slab. The undergroundstructure of the New Cooling Tower will be removed during Phase 1 decommissioning activities.Demineralizer Sludge Ponds. The north and south Demineralizer Sludge Ponds are separate,unlined basins excavated in the sand and gravel layer. They are approximately 100 feet long, 50feet wide, and five feet deep. They were used to receive water softener regeneration waste,clarifier overflow and blow-down, boiler blow-down, sand filter backwash, and demineralizerregeneration waste from the Utility Room. The north pond is nearly filled with sediment. Bothponds are radiologically contaminated. As of 2004, the ponds were no longer in service. TheDemineralizer Sludge Ponds will be removed as part of Phase 1 decommissioning activities.Equalization Basin. The Equalization Basin is a lined basin excavated into the sand and gravellayer. It measures 75 feet wide, 125 feet long, by 10 feet deep. It has been used for nonradioactivedischarges. The Equalization Basin will be removed as part of Phase 1decommissioning activities.Equalization Tank. The Equalization Tank is a 20,000-gallon underground concrete tankimmediately north of the Equalization Basin that serves as a replacement for the EqualizationBasin. The Equalization Tank will be removed as part of Phase 1 decommissioning activities.Old Warehouse Slab. The Old Warehouse was a pre-engineered steel building with threesections. The main warehouse section was 80 feet by 144 feet by approximately 21 feet high atthe roof peak. A 38 foot by 42 foot by 15 foot high room was attached to the north end of thebuilding that housed a radiological counting facility. A double-wide office trailer was located ona concrete foundation wall at the south end of the building. The Old Warehouse was removeddown to its concrete floor slab at grade in May 2007. The Old Warehouse slab will be removed aspart of Phase 1 decommissioning activities.South Waste Tank Farm Test Tower. The South Waste Tank Farm Test Tower is a preengineeredstructure erected as a stack of modules including ladders, handrails, and grating. Theexterior “skin” is fabric. The South Tower is 16 feet by 16 feet by 48 feet high. It will be removedduring Phase 1 decommissioning. (A North Tower also had been present; it was removed to itsfoundation in October 2006.)Rev. 1 F-2
WVDP Phase 1 CSAPRoad-Salt and Sand Shed. The Road-Salt and Sand Shed is a storage bin and a sand stall restingon asphalt pavement. It is constructed with a wooden frame covered with galvanized steel siding.This facility will be removed during work to achieve the interim end state. The slab will beremoved as part of Phase 1 decommissioning activities.LLW Rail Packaging and Staging Area. The LLW Rail Packaging and Staging Area coversapproximately 27,000 square feet east of and adjacent to the railroad tracks at the south end ofWMA 6. The area contains two eight-inch-thick reinforced concrete pads and another sectioncovered with crushed limestone. The concrete pads will be removed during Phase 1decommissioning activities.WMA 6 is known to have a significant amount of buried infrastructure in its northern portion,including wastewater lines that connected the Process Building with the Old Sewage TreatmentFacility, the New Sewage Treatment Facility, sludge ponds and equalization tanks/basin, and theWMA 2 water treatment facilities.F.2 Physical SettingThe WMA 6 area is a long, narrow waste management area that is oriented northwest tosoutheast. It is bordered by WMA 10 to the west, WMA 1 and 2 to the north, WMA 12 and 7 tothe east, and WMA 9 to the south. WMA 6 is bisected by Erdman Brook; north of the stream isthe North Plateau, and south of the stream is the South Plateau.The topography of the WMA 6 area has been significantly reworked as part of site activities,which have included the construction of several buildings, the installation of a railroad line alongthe length of WMA 6, the construction of buried infrastructure including storm sewers andsewage lines, and the construction of several holding ponds.A significant portion of WMA 6 is currently covered by hardstands, roads, the railroad bed, andconcrete pads/building foundations. The balance is grass-covered.The northern half of WMA 6 is underlain by the sand and gravel unit which overlies the LaveryTill. In general, groundwater in the sand and gravel unit flows to the northeast across the NorthRev. 1 F-3
WVDP Phase 1 CSAPPlateau although there probably is also localized discharge to Erdman Brook. The Lavery Till haslow permeability but groundwater does flow vertically downward through this unit recharging theunderlying Kent Recessional Sequence.The weathered Lavery Till is exposed at the surface in the southern half of WMA 6. Groundwaterin the weathered Lavery Till flows to the northeast across the South Plateau with likely dischargeto Erdman Brook.WMA 6 is drained by Erdman Brook via ditches that run parallel to the railway line.F.3 Area HistoryFigure F.3 shows the WMA 6 area in 1962, prior to site development. At this time the WMA 6area was bifurcated by a public road, there was a residence within its boundaries, and a portion ofit was farmed.Figure F.4 shows the WMA 6 area in 1966, after site development had begun. WMA 6 wasaffected primarily by the completion of a road connecting the main plant area with theNDA/SDA, the installation of the railway, and the construction of the demineralizer sludgeponds, cooling towers and old sewage treatment plant in the northern portion of WMA 6.Figure F.5 shows the WMA 6 area in 1968. The primary change is the expansion ofhardstand/open storage/staging areas west of the WMA 7 area within the southern end of WMA6.Figure F.6 shows the WMA 6 area in 1977. Nothing of significance had changed since 1968 otherthan a lessening of activity at the south end of WMA 6.Figure F.7 shows the WMA 6 area in 1984. There were no significant changes from 1977.Figure F.8 shows the WMA 6 area in 1995. There were significant changes between 1984 and1995, including the construction of additional hardstands, the Sewage Treatment Facility, theconstruction of the Equalization Basin, and various other smaller supporting facilities in thenorthern area of WMA 6.Rev. 1 F-4
WVDP Phase 1 CSAPFigure F.9 shows the WMA 6 area in 2007, without much change since 1995.F.4 Known and Suspected ReleasesF.4.1Cesium ProngPotentially Affected Media:Potentially Affected WMAs:surface soil, subsurface soil, sediments1, 2, 3, 4, 5, 6, 10, 12 (northern portion)In 1968, a ventilation system filter in the Process Building (in WMA 1) failed, releasingcontaminated particulate up the Process Building stack. A mixture of radionuclides was released,with Cs-137 predominant. Approximately 0.33 Ci particulate gross beta radioactivity wasreleased. The contaminated particulate was deposited on surface soils, resulting in a large area ofcontamination around the Process Building and to the north-northwest. Detectable depositsextend several miles, including beyond the WVDP premises. WMAs 1, 2, 3, 4, 5, 6, 10, and12 North likely are affected. Because Cs-137 is predominant, this area of contamination is knownas “the cesium prong” (DOE 2009 Table 2-17, DOE 2010 Section 3.11.5).As originally deposited, surface soil activity concentrations should have decreased towards thenorth, away from WMA 1. However, the surface features of many areas within the WVDPpremises have been reworked significantly since the release; as a result, the current spatial anddepth distribution of soil contamination may be significantly different than the original footprint.In addition, the surface soil contamination likely has been naturally spread by erosion and runoffinto surface drainage features; this phenomenon may have enlarged the area impacted bydeposition, although detailed data regarding this effect are not available (DOE 2010Section 3.11.5).Finally, other releases from the Process Building stack may have produced minor impacts. Theseother releases include the 1968 failure of a dissolver off-gas system filter, resulting in 0.28 Ci ofparticulate activity, and the 1968 failure of a vessel off-gas system filter, resulting in the March1968 releases to exceed the monthly allowance by 15 percent (DOE 2010 Section 3.11.5).Rev. 1 F-5
WVDP Phase 1 CSAPF.4.2North Plateau Groundwater PlumePotentially Affected Media: subsurface soil, groundwater, sedimentPotentially Affected WMAs: 1, 2, 3, 4, 5, 6Several releases have contributed to a contaminated groundwater plume originating in the area ofthe Process Building (in WMA 1). The plume is expected to have migrated towards the northeast,and to have remained within the WVDP premises. There likely have been groundwater seeps todrainage features, resulting in sediment contamination; these sediment impacts may extendbeyond the WVDP premises. WMAs 1, 2, 3, 4, 5, and 6 likely are affected. Because this area issituated on the North Plateau, the area of contamination is known as “the North PlateauGroundwater Plume.” The predominant mobile contaminant in this plume is Sr-90.The major contribution to the plume occurred in 1968. (Other potential contributing releases arepresented in Sections A.4.3, B.4.3, C.4.3, and E.4.3.) Radioactive acid leaked into the subsurfaceat the southwest corner of the Process Building when Line 7P-240-1-C in the Off-Gas OperatingAisle (within the Process Building) failed. The leakage drained down to the underlying Off-GasCell and the adjacent southwest stairwell, then apparently flowed through an expansion joint inthe concrete floor of the Off-Gas Cell and migrated into the underlying sand and gravel. The leakreleased an estimated 200 gallons of radioactive nitric acid with approximately 93 Ci Sr-90(DOE 2009 Table 2-17).F.4.3Other Known and Suspected ReleasesF.4.3.1Sewage Treatment System ContaminationPotentially Affected Media:Potentially Affected WMAs:subsurface soil, groundwater, sediment1, 6, 12 (Erdman Brook)Historically, the Process Building (in WMA 1) was connected to the Old Sewage Treatment Plantvia an underground wastewater line. A 1970 to 1971 investigation of unexpected tritium andgross beta contamination in Erdman Brook led to the discovery of contamination in the sanitarysewer system. It was discovered that the underground wastewater line had failed near thesouthwest side of the Process Building. The resultant leak allowed contaminated groundwater inRev. 1 F-6
WVDP Phase 1 CSAPthe area to enter the Old Sewage Treatment Plant. An estimated 0.5 Ci gross beta and 0.05 Ci ofSr-90 was released. The Old Sewage Treatment Plant and its outfall drainage were contaminatedto 1 mR/h, with effluent concentrations subsiding after the leak was repaired. Affected outfallswere located in WMA 6 and included the Old Sewage Treatment Plant drainage channel witheventual discharge to Erdman Brook (DOE 2009 Table 2-17; DOE 2010 Section 3.11.5).In addition, during the 1960s and 1970s, the Old Sewage Treatment Plant experienced severalother contamination events, some of which were expressed as radioactivity increases in thetreated effluent. The Old Sewage Treatment Plant outfall drainage extends approximately 650feet south of a culvert near the Old Warehouse (also in WMA 6), and flows into the first culvertunder the railroad tracks on the South Plateau (in WMA 6), and then to Erdman Brook (inWMA 6 and WMA 12 South). Actions were taken to find and repair a suspected sewage lineleak, but when the line near the south side of the Process Building was excavated, radiation levelsfrom soil contamination hampered the project.A 1982 gamma radiation survey of the Old Sewage Treatment Plant drainage channel showedlevels three feet above the surface ranging from 110 to 500 μR/h on a section of the channel thatextended approximately 200 feet south of the discharge culvert. The contaminated portion of thearea was about 15 feet wide and 600 feet long, the northern 200 feet of which exhibitedsignificant contamination in sediments represented by an 800 pCi/g Cs-137 sample result fromthe channel sediments, and up to 1 mR/hr near the surface of the drainage channel. The sedimentlayer was estimated to be at least a foot thick. In order to prevent further contaminant transportdownstream, a new drainage channel was excavated to the west of the contaminated channel, andthe spoil was placed over the old channel. At least three feet of soil covers the old drainagechannel sediment (DOE 2009 Section 2.3.2).F.5 Existing DataExisting data sets for this area include:• In 1982, static direct exposure readings were collected across the WVDP premises(WVNSCO 1982). All of WMA 6 was covered by these measurements on a 10-m grid.Figure F.10 shows these results color-coded by the exposure readings encountered, withthe data overlain on a 1977 aerial photograph. Interpretation of these data in the vicinityRev. 1 F-7
WVDP Phase 1 CSAPof the Process Building is complicated by possible shine impacts. These data suggestsurface contamination in the northern portion of WMA 6, extending south to the OldWarehouse, and then a line of contamination likely associated with the old sewagetreatment drainage channel that runs parallel to the Rail Spur for some distance. Thesedata also indicate smaller, more localized areas of surface contamination in thesoutheastern corner of WMA 6 associated with hardstands and staging areas servicingWMA 7 and WMA 9.• In 1990 and 1991, a second static direct exposure measurement program was conductedacross the WVDP premises (WVNSCO 1992). In the case of WMA 6, this effortprovided systematic coverage of a portion of the WMA 6 area on a 10-m grid. This datacollection used different instrumentation and protocols than the 1982 study, so the resultsare not quantitatively comparable. As with the 1982 data set, interpretation of these dataaround the Process Building is complicated by the potential for shine impacts. FigureF.11 shows these results overlain on a 1995 aerial photograph. These data confirm theoriginal 1982 direct measurement program findings north of the Old Warehouse, but didnot identify the spur of contaminated soils in the old sewage treatment discharge channel,presumably because the old discharge channel had been backfilled with several feet ofclean fill.• There are very little soil sampling data for WMA 6 available within ELIMS, exceptadjacent to the Process Building along the WMA 1 boundary. Figure F.12 shows thelocations of surface samples and soil bores. With the exception of soil bore GP10208which was completed in 2008, all other sampling was done in 1993. Figure F.12 alsoshows the Cs-137 and Sr-90 results for surface samples for the locations where surfacesamples were collected. In general, activity concentrations decreased as one moves southin WMA 6; some of the samples in the north had surface soil activity concentrations thatexceeded the surface soil CG w . All three soil bores in the northern portion of WMA 6adjacent to WMA 1 had contamination present at depths greater than 1 m. The two soilbores in the middle and southern portion of WMA 6 and the soil bore adjacent to WMA12 South and WMA 2 did not. Table F.1 identifies the number of locations analyzed foreach of the 18 primary radionuclides of interest (ROI).Rev. 1 F-8
WVDP Phase 1 CSAP• There are also limited groundwater data for WMA 6 within ELIMS. Figure F.13 showslocations with groundwater results color-coded by Sr-90 activity concentrations. FigureF.14 shows the same for tritium. The detection limits for Sr-90 and tritium varied widelyamong ELIMS samples. 10 pCi/L and 500 pCi/L were selected as thresholds for Sr-90andtritium, respectively, because based on ELIMS data results above these activityconcentrations were consistently above method detection limits and so indicative ofcontamination impacts rather than simply measurement error.The highest groundwater contamination was in the northernmost portion of WMA 6,immediately down gradient of the presumed 1968 Process Building subsurface release. Inaddition there were low level elevated Sr-90 results along the WMA 2 border, with theProcess Building the presumed source.The tritium above-background activity concentrations identified in Figure F.14 just eastof the Railway Spur were in the early 1990s and appeared to be transitory. There are onlytwo groundwater samples with Sr-90 results for this same location, both from the early1990s. For both samples, the Sr-90 results were around 30 pCi/l, indicating Sr-90impacts. There is a fairly continuous set of gross beta information for this location thatappears to indicate on-going elevated gross beta levels over the years, presumablyassociated with Sr-90 impacts. This location is directly east of the Old Sewage TreatmentPlant outfall channel discharge culvert; contamination associated with discharges fromthat culvert may be the source of the groundwater impacts.The cluster of groundwater sampling locations immediately south of the SewageTreatment Plant had what appeared to be very low level gross beta above-backgroundactivity concentrations in the early 1990s along with some tritium results that weremarginally detectable and above background conditions. Any groundwater impacts in thisvicinity would presumably be from Sewage Treatment Plant activities.F.6 Planned Phase 1 DP ActivitiesFor a more complete description of planned Phase 1 DP activities, see the Phase 1 DP, Section3.1 and Section 7.7.Rev. 1 F-9
WVDP Phase 1 CSAPThe New Cooling Tower will be removed down to its underground structure prior to the initiationof Phase 1 decommissioning activities.The Sewage Treatment Plant, the South Waste Tank Farm Test Tower, the two DemineralizerSludge Ponds, the Equalization Basin, the Equalization Tank, and the remaining concrete floorslabs, foundations, and hardstands will be removed.The Phase 1 work does not include the Rail Spur.F.7 <strong>Conceptual</strong> <strong>Site</strong> <strong>Model</strong>WMA 6 potentially has impacts from a variety of releases. Some of these are surface, and someare subsurface. In addition, surface soil reworking in specific areas of WMA 6 has possiblyresulted in subsurface soil contamination. Specifically:• WMA 6 surface soils were likely affected by the 1968 airborne releases of radioactivityfrom the Process Building stack in WMA 1. These impacts would have originally beengreatest proximal to the Process Building and decreased as one moved south in WMA 6.Since 1968, however, there has been significant surface soil reworking in the northernportion of WMA 6. These activities could have removed contaminated soil layers, buriedthose layers under clean backfill, and/or redistributed/mixed contamination in surfacesoils.• Activities and buried infrastructure associated with the Old Sewage Treatment Facilityare known to have resulted in significant soil contamination that likely remains and thatmay be buried. The exact location of these infrastructure footprints is currently unknown.• The original old sewage treatment plant discharge channel that traversed the centralportion of WMA 6 was contaminated and then buried with clean soil. Subsurface soilcontamination likely remains associated with that original footprint. There are indicationsthat there may low level groundwater impacts associated with this contamination as well.Rev. 1 F-10
WVDP Phase 1 CSAP• Subsurface releases from the Process Building have impacted subsurface soils andgroundwater in WMA 6 along the WMA 1 boundary. The lateral extent of these impactsis currently unknown.• GPBG0408, a “background” soil bore completed adjacent to the WMA 6 boundarywithin WMA 10 just south of the New Warehouse and the Sewage Treatment Plantencountered tritium soil contamination at a depth of approximately five feet. While theexact source is unknown and tritium was the only radionuclide above background, it doesraise potential subsurface concerns for this area, assuming that the original release pointwas within WMA 6 and not WMA 10. The cluster of wells directly south of the SewageTreatment Plant showed some indications of elevated gross beta and tritium activityabove background levels in the 1990s. The soils and groundwater data suggest that thereis the potential for very low level impacts of soils/groundwater in this vicinity.• Sediments within the Demineralizer Sludge Ponds are known to be contaminated,although the depth of contamination is not known.• There is evidence of low levels of contamination in the sediments for the ditch thatcurrently drains WMA 10 in a southeasterly fashion along the Rail Spur beforeconnecting with Erdman Brook.Because the Old Warehouse pre-dates the 1968 airborne releases of radioactivity from theProcess Building stack, the assumption is that soils beneath the Old Warehouse slab are unimpacted.Figure F.15 shows the current <strong>Conceptual</strong> <strong>Site</strong> <strong>Model</strong> (CSM) for WMA 6 surface soils. FigureF.16 shows the same for soils deeper than 1 m. Particularly for subsurface soils, the CSM is basedon very little data and is primarily conjecture at this stage. Figures F.15 and F.16 also show thefootprints of the planned deep excavations for WMA 1 and WMA 2. Note that the plannedexcavations for WMA 1 and WMA 2 extend into portions of the northern part of WMA 6.F.8 WMA 6-Specific Characterization Goals• Evaluate Appropriateness of the Current List of Radionuclides of Interest (ROI)Rev. 1 F-11
WVDP Phase 1 CSAP• Verify Absence of Additional ROI• Determine Extent of Surface Contamination• Identify the Presence/Absence of Subsurface Soil Contamination• Identify Soil Waste Stream Characteristics• Develop an Inventory of Buried Infrastructure• Obtain Data to Support Phase 2 PlanningF.9 CSAP Pre-Remediation Data Collection and Associated Decision-MakingCSAP pre-remediation data collection will consist of a number of components described in moredetail below.F.9.1Buried InfrastructureThe footprint of buried infrastructure will be identified and mapped. Buried infrastructure thatmay exist or is known to exist within WMA 6 includes wastewater lines associated with the OldSewage Treatment Plant, wastewater lines associated with the new Sewage Treatment Plant,storm sewer lines, and water supply lines. [required]F.9.2Gamma Walkover Survey DataThe purpose of performing a gamma walkover survey of the WMA 6 area is to identify the leveland extent of surface contamination. This includes both general trends in average activityconcentrations pertinent to the surface soil CG w requirement, as well as the identification ofisolated, more-elevated anomalies that might be indicative of discrete releases and/or surface soilCG emc concerns.A complete (100%) logged gamma walkover survey (GWS) will be conducted for accessibleareas within WMA 6. Examples of areas that would not be accessible are areas where standingwater is present in wetlands, existing building footprints, and building pads. Based on the GWSresults, surface soil within WMA 6 will be divided into four categories: (1) surface soils whereGWS data indicate contamination above CG w requirements; (2) surface soils where GWS dataindicate contamination, but it is not clear if contamination exceeds surface soil CG w requirement;(3) surface soils where GWS indicate impacts, but those impacts are not expected to exceedRev. 1 F-12
WVDP Phase 1 CSAPsurface soil CG w standards; and (4) surface soils where there is no indication of impacts abovebackground conditions. The purpose of this data collection is to provide insights into the spatialdistribution of surface contamination, and to guide subsequent soil sampling. [required]F.9.3Surface Soil SamplingSurface soil sampling will be used to address areas inaccessible to GWS data collection, toresolve hot spots identified by the GWS data, and to evaluate the presence, absence, and/or extentof surface contamination above surface soil CG w requirements based on GWS results.• Wetlands. It is possible that standing water will be present in wetlands that prevent GWSdata collection from those areas. Soil sampling will be required for wetland footprints andfor any other areas where standing water prevents the collection of GWS data.For every area where standing water or saturated soil conditions prevent GWS datacollection, systematic soil sampling will take place. For wetland areas less than 200 m 2 insize, one sample will be collected. For areas between 200 and 1,000 m 2 in size, onesample per 200 m 2 will be collected. For areas between 1,000 and 2,500 m 2 in size, fivesamples will be collected. For areas exceeding 2,500 m 2 in size, at minimum one samplewill be collected per 500-m 2 area. One sample will be collected from each locationrepresentative of a 0-15 cm depth interval. Locations will be selected to providesystematic coverage of the area of interest. [contingent]• Hot Spots. If GWS data indicate the presence of contamination that possibly exceeds“hot spot” (CG emc ) standards or an isolated elevated area is identified that appearsindicative of a discrete release, the location of concern will be sampled with a biasedsample. If biased samples are collected from a particular location, they will be collectedfrom two depth intervals: 0-15 cm, and 15 cm-1 m. The 0-15 cm samples will beanalyzed for the 12 radionuclides of potential interest in addition to the 18 ROI. Onedown-hole gamma scan will be conducted from each biased location. The purpose ofthese samples is to resolve GWS anomalies, evaluate the appropriateness of the currentROI list, and verify the absence of additional ROI. [contingent]Rev. 1 F-13
WVDP Phase 1 CSAP• CG w Sampling. Surface soil sampling may be conducted after the GWS to further clarifyresults, with the level and nature of sampling dependent on GWS results. If GWS resultsindicate no evidence of contamination impacts above background levels, no additionalsurface soil sampling will be required other than to address areas too wet to perform agamma walkover survey. Based on historical direct gamma measurements, the areas mostlikely to have contamination exceeding surface soil CG w requirements are along theboundary between WMA 6 and WMA 1.oIf GWS results indicate contamination impacts above background levels but thatsurface soil contaminant levels exceeding surface soil CG w requirements areunlikely, the area of interest will be systematically sampled using a triangulargrid with a density of one sample per 400 m 2 . One sample will be collected fromeach location representative of a 0-15 cm depth interval. Locations will beselected to provide systematic coverage of the area of interest. The purpose is todocument the activity concentrations present in surface soils within WMA 6.[contingent]oIf GWS results indicate surface soil contaminant levels exceeding surface soilCG w requirements likely exist, one sampling location will be selected at thehighest gross activity level to confirm surface soil CG w exceedances and anotherset of sampling locations will be identified to spatially bound the extent ofcontamination (i.e., along the boundary of what is considered likely abovesurface soil CG w requirements) if this is not obvious from the GWS data. Twosamples will be collected from the location targeting high gross activity levels,one representative of a 0-15 cm depth interval, and one representative of a15 cm-1 m depth interval. One sample will be collected from each locationintended to laterally bound contamination, representative of a 0-15 cm depthinterval. In addition, the location targeting high gross activity levels will haveone down-hole gamma scan conducted at the center of the location with staticmeasurements taken every 15 cm. The purpose is to document surface soil CG wrequirement exceedances and bound the lateral extent of contamination.[contingent]Rev. 1 F-14
WVDP Phase 1 CSAPoIf GWS results indicate areas with surface soil contamination impacts but it isunclear whether surface soil CG w requirement exceedances are present, at mostfive sampling locations will be selected that systematically cover the areas ofinterest. One sample will be collected from each location representative of a 0 –15 cm depth interval and one representative of the 15 cm – 1 m depth interval.Locations will be selected to provide systematic coverage of the area of interest.The purpose is to resolve the question of whether surface soil CG w requirementexceedances exist for areas where GWS results are ambiguous. [contingent]oIf any 0-15 cm interval yields a sample result indicating a surface soil CG wrequirements exceedance and that sample location is not laterally bounded eitherby existing sampling locations with results less than surface soil CG wrequirements or by GWS data that clearly indicate contamination is not aconcern, additional sampling locations will be selected so that the contaminationencountered is spatially bounded. Sampling to laterally bound contamination mayextend, if necessary, into WMA 10 and/or WMA 12. The purpose is to laterallybound contamination that is above CG w requirements. [contingent]F.9.4Subsurface Soil SamplingThe purpose of subsurface soil sampling within WMA 6 is to determine presence and verticalextent of contamination impacts above background levels. There are several areas within WMA 6that have specific subsurface soil contamination concerns that are discussed below. These includesubsurface soils associated with the boundaries with WMA 1 and WMA 2, the two DemineralizerSludge Ponds, the New Sewage Treatment Plant, and the original footprint of the Old SewageTreatment Plant discharge ditch.• Systematic subsurface sampling along the northern boundary of WMA 6 will take placeas part of WMA 1 and WMA 2 pre-remediation CSAP activities; that sampling mayextend into WMA 6 as necessary to laterally bound contamination that may beencountered. WMA 1 and 2 data collection activities are described in the Appendices Aand B, respectively.Rev. 1 F-15
WVDP Phase 1 CSAP• A minimum of two soil cores will be collected from each of the two DemineralizerSludge Ponds to a minimum depth of 3 m. Samples will be collected representative ofeach 1 m interval. The soil bores will be scanned vertically with down-hole staticreadings every 15 cm. The purpose of this data collection is to determine the likely depthof contamination associated with the sludge ponds. [required]• If Demineralizer Sludge Pond soil cores encounter contamination in the 2-3 m depthinterval, sampling will continue deeper until contamination is vertically bounded andsamples yield results consistent with background conditions. The purpose of this datacollection is to vertically bound subsurface contamination that might be encountered.[contingent]• Four soil cores will be collected around the New Sewage Treatment Plant. These coreswill extend 1 m into the Lavery Till. They will be scanned vertically with down-holestatic readings every 50 cm. One soil sample will be formed representative of each 1 mdepth, starting with the 1-2 m interval. The last sample will be representative of LaveryTill conditions to a depth of 1 m into the till. Three groundwater samples will becollected from each bore, one from the water table surface, one from the zoneimmediately above the Lavery Till, and one midway between the water table and theLavery Till. The purpose of this data collection is to determine the presence of subsurfacecontamination in the vicinity of the Sewage Treatment Plant and to provide backgroundinformation on the Lavery Till. [required]• If any of the four New Sewage Treatment Plant soil cores encounters contaminationabove background conditions at depths below 1 m, then additional core locations will beselected to laterally bound the contamination encountered. If the contamination appearsto be associated with the movement of contaminated groundwater, bounding bores willbe placed on a triangular grid with a 30-m spacing and sampling will continue untilcontamination is bounded. If contamination appears to be associated with contaminatedsoil layers in the vadose zone, bounding bore placement will be driven by the location,the nature of the contamination, and by the nature of the suspected release. In this casesoil core separation will likely be less than 30 m. The purpose of this data collection is tolaterally bound subsurface contamination that might be encountered. [contingent]Rev. 1 F-16
WVDP Phase 1 CSAP• Three trenching locations will be selected along the WMA 6 drainage ditch. The trencheswill be separated by approximately 20 m to provide coverage for the stretch of thechannel that was reported to have been contaminated. The purpose of the trenching is toidentify subsurface contamination associated with the original sewage discharge channel.Trenching will be orthogonal to the orientation of the current ditch, and will be from awest to east direction starting at the ditch. Trenching will continue eastward for aminimum of 6 m or until there is no further evidence of contamination deeper than 1 m.Trenching will be to a minimum depth of 2 m, or to a depth such that there is no furtherevidence of contamination. Soils will be screened for elevated activity as trenchingprogresses. A minimum of three soil samples will be collected from each trench, onefrom the start of the trench targeting soils at a depth of approximately 1.5 m from soilsbelieved to be un-impacted based on gross activity data, one from soils that exhibit thehighest levels of gross activity, or from soils that appear to be representative of theoriginal sewage discharge channel if no evidence of elevated activity is observed, and onefrom soils on the western edge of the trench from a depth of approximately 1.5 metersfrom soils believe to be un-impacted based on gross activity data. If significantcontamination is identified by gross activity measurements, a fourth sample will berequired from soils at the bottom of the trench beneath the zone where contamination wasidentified to verify background conditions. [required]• If all three trenches identify contamination, then trenching will continue down the lengthof the original sewage discharge channel until the channel either terminates or untilbackground soils are encountered. Trench spacing will be approximately 20 m. Samplingwill be conducted as previously described. [contingent]• If any 0-15 cm surface soil sample result indicates contamination impacts abovebackground levels and there was not a 15 cm-1 m sample collected from that location, a15 cm-1 m sample will be collected from that location following the protocols used forthe original 0-15 cm surface soil sample. In addition, each soil location will have onedown-hole gamma scan conducted at the center of the location with static measurementstaken every 15 cm. [contingent]• If a surface soil sample indicates contamination impacts above background levels for the15 cm-1 m depth interval, an additional sample from a depth of 1-2 m will be collectedRev. 1 F-17
WVDP Phase 1 CSAPand analyzed from that location. This process will continue until the vertical extent ofcontamination above background is bounded. One down-hole gamma scan will beconducted from each soil location requiring deeper investigation with a static readingtaken every 15 cm vertically. The purpose of these samples is to define the vertical extentof contamination. [contingent]F.9.5Drainage Feature SamplingWMA 6 contains three distinct drainage features, the current WMA 6 drainage ditch, the reach ofErdman Brook that passes through WMA 6, and a drainage ditch the feeds Erdman Brook fromthe south (Figure F.1). For drainage features within WMA 6, the surface soil CG w requirementsapply. Surface drainage feature sampling will be conducted to determine ditch sedimentcontamination status relative to surface soil CG w requirements. Surface drainage features will besampled as follows:• Samples representing a 0-15 cm depth interval will be collected from ditch sediments. InWMA 6, the three drainage features have a combined length of approximately 360 m.Samples will be systematic located using a random start, separated by 30 m. [required]• If any 0-15 cm sample result indicates contamination impacts above background levelsand a 15 cm-1 m sample was not also collected, a 15 cm-1 m sample will be collectedfrom that location following the protocols used for the original 0-15 cm sample.[contingent]• If a sample indicates contamination impacts above background levels for the 15cm-1 mdepth interval, an additional sample from a depth of 1-2 m will be collected and analyzedfrom that location. This will be repeated, as necessary, until the vertical extent ofcontamination impact is bounded at that location. [contingent]F.9.6Buried Infrastructure Soil SamplingSoils associated with buried infrastructure within WMA 6 will be sampled to determine theircontamination status.Rev. 1 F-18
WVDP Phase 1 CSAP• Three locations along each piece of buried infrastructure within WMA 6 will be trenched.These locations will be selected to maximize the possibility that contamination will beencountered (e.g., locations where historical or current GWS data indicate surfacecontamination exists). During excavation, exposed soils will be monitored by scans forevidence of elevated gross activity. The purpose of this sampling is to evaluate thepresence of contamination associated with buried infrastructure. [required]oIf elevated readings are encountered below a depth of 1 m, soils exhibiting thehighest levels of gross activity will be sampled and analyzed.oIf elevated readings are not encountered below a depth of 1 m, a samplerepresentative of soils deeper than 1 m will be collected. In the case ofinfrastructure that did not carry waste or wastewater, the sample will be fromsoils immediately above the line. In the case of infrastructure that did carry wasteor wastewater, the sample will be from soils immediately beneath the line.• If contamination above background conditions is encountered at any selected location,trenching will continue to depth until background conditions are observed. An additionalsample will be collected from the base of the trench to verify background conditions. Thepurpose is to vertically bound observed contamination. [contingent]• If buried infrastructure soil sampling identifies contamination impacts greater thanbackground, biased sampling will continue following the line until at least twoconsecutive locations yield soil samples below surface soil CG w requirements. Locationspacing will be based on engineering judgment, including the geometry of the line, thelevel of contamination encountered, and surface evidence of contamination. The purposeof this sampling is to bound the extent of contamination associated with buriedinfrastructure, as necessary. [contingent]F.9.7Additional ContingenciesSampling and/or GWS data may indicate that contamination exists or extends beneath surfacescurrently covered by existing structures, concrete, asphalt, or gravel. In this case, “surface soil”will be defined as soil immediately beneath the cover. If sampling or GWS data indicate thatRev. 1 F-19
WVDP Phase 1 CSAPcontamination may exist beneath existing structures (e.g., existing buildings, building pads, orhardstand areas), then sampling locations will be offset along the foundation/hardstand edge todetermine contamination extent. The purpose of the offset is to allow safe acquisition of data.Data collection through building pads and hardstands in WMA 6 will not be required as part ofthis effort.F.9.8Required <strong>Laboratory</strong> AnalysesAll samples will be submitted for analysis of all 18 ROI.A select portion of the samples as described above may be analyzed for the additional12 radionuclides of potential interest. If these sample results indicate the presence of the one ormore of those radionuclides at levels of potential significance, then the balance of samples fromWMA 6 will also be analyzed for the additional radionuclides that were identified.Table F.2 summarizes the required sample numbers and the estimated number of contingencysamples for WMA 6.This sampling plan assumes that quick turn-around analyses are available for Sr-90 and Cs-137and that soil samples will be screened for Sr-90 and Cs-137 prior to being analyzed for thebalance of the ROI. Contingency sampling requirements as described above may be undertakenbased on these screening data.F.9.9Decision-Making SummaryA summary of decision-making based on the WMA 6 data is as follows:• For each piece of buried infrastructure of concern that is identified, three biased locationswill be selected, excavation conducted to expose the line, and a soil sample formed fromsoils most likely contaminated. If contamination is encountered above CG requirements,sampling will continue along these lines until it is bounded.Rev. 1 F-20
WVDP Phase 1 CSAP• Systematic sampling will be selected from the footprint of drainage features from the0-15 cm interval. If any soil samples exceed the CG requirement, then sampling willcontinue to depth to vertically bound contamination.• If the GWS identifies a surface soil anomaly that potentially exceeds the CG emc , thatlocation will be sampled and analyzed.• Subsurface sampling will be conducted within the footprints of the DemineralizationSludge Ponds. If contamination is encountered above background conditions, the depth ofthese bores will be extended until there is no evidence of contamination abovebackground conditions.• Subsurface sampling will be conducted around the current Sewage Treatment Plant andextend vertically into the Lavery Till. If contamination is encountered above backgroundconditions, additional cores will be collected to bound the lateral extent of contamination.• Trenching will be conducted in the footprint of the old sewage discharge channel. Ifcontamination is encountered, trenching will continue down the length of the originalditch until either the ditch terminates or background conditions are observed.• The WMA 6 surface soil area classification as contained in Figure F.15 will be adjustedbased on GWS results. These adjustments may affect systematic sample numberrequirements and will affect the placement of the initial round of systematic surface soilsample locations.• Depending on the outcome of the first round of systematic surface soil sampling,additional systematic soil sample locations will be selected to further laterally boundcontamination extent.• If any 15 cm-1 m soil interval encounters contamination above CG requirements,additional deeper 1 m interval soil samples will be required for that location to determinevertical extent of contamination. If additional vertical samples are required, verticalsampling will continue until background conditions are observed.Rev. 1 F-21
WVDP Phase 1 CSAPF.10 ReferencesDOE 2009. Phase I Decommissioning Plan for the West Valley Demonstration Project, Rev 2,prepared by Washington Safety Management Solutions, URS Washington Division,Science Applications International Corporation, prepared for DOE, December 2009.DOE 2010. Final Environmental Impact Statement for Decommissioning and/or Long-TermStewardship at the West Valley Demonstration Project and Western New York NuclearService Center, Vol 1, DOE/EIS-0226, January 2010.Rev. 1 F-22
WVDP Phase 1 CSAPTable F.1 Historical Data AnalysesNuclide# of SurfaceSoilLocations# ofSubsurfaceSoilLocations# of SedimentLocationsAm-241 0 3 0C-14 0 1 0Cm-243 0 1 0Cm-244 0 1 0Cs-137 9 6 3I-129 0 1 0Np-237 0 1 0Pu-238 0 3 0Pu-239 0 3 0Pu-240 0 3 0Pu-241 0 3 0Sr-90 9 6 3Tc-99 0 1 0U-232 0 1 0U-233 0 1 0U-234 0 1 0U-235 0 1 0U-238 0 1 0Rev. 1 F-23
WVDP Phase 1 CSAPTable F.2 Sample Number EstimatesRequired Contingent TotalSystematic Sediment Samples 21 3 24(0-15 cm)Systematic Sediment Samples0 6 6(15 cm-1 m)Biased Surface Soil Samples0 6 6(0-15 cm)Biased Surface Soil Samples0 6 6(15 cm-1 m)Contingent Surface Soil0 20 20SamplesSystematic Subsurface Soil52 0 52Samples (1-m intervals)Biased Subsurface Soil0 12 12Samples (1-m intervals)Buried Infrastructure Soil12 12 24SamplesGroundwater Samples 12 0 12Total: 85 65 150Rev. 1 F-24
WVDP Phase 1 CSAPOld SewageTreatment PlantHazardous WasteStorage FacilityTestTowerWMA 12Fuel TanksScrap WoodHardstandRail SpurContractor AccessHardstandVitrificationHardstandClean Soil StoragePile HardstandContractor VehicleHardstandFigure F.1 WMA 6 (adapted from Phase 1 DP, Figure 3-38)Rev. 1 F-25
WVDP Phase 1 CSAPFigure F.2 WMA 6 with TopographyRev. 1 F-26
WVDP Phase 1 CSAPFigure F.3 WMA 6 Aerial Photograph from 1962Rev. 1 F-27
WVDP Phase 1 CSAPFigure F.4 WMA 6 Aerial Photograph from 1966Rev. 1 F-28
WVDP Phase 1 CSAPFigure F.5 WMA 6 Aerial Photograph from 1968Rev. 1 F-29
WVDP Phase 1 CSAPFigure F.6 WMA 6 Aerial Photograph from 1977Rev. 1 F-30
WVDP Phase 1 CSAPFigure F.7 WMA 6 Aerial Photograph from 1984Rev. 1 F-31
WVDP Phase 1 CSAPFigure F.8 WMA 6 Aerial Photograph from 1995Rev. 1 F-32
WVDP Phase 1 CSAPFigure F.9 WMA 6 Aerial Photograph from 2007Rev. 1 F-33
WVDP Phase 1 CSAPFigure F.10 WMA 6 1982 Direct Gamma Survey ResultsRev. 1 F-34
WVDP Phase 1 CSAPFigure F.11 WMA 6 1990 - 1991 Direct Gamma Survey ResultsRev. 1 F-35
WVDP Phase 1 CSAPGP10208BH-19A137Cs: 3.7 pCi/g90Sr: 0.9 pCi/gST-35137Cs: 2.9 pCi/g90Sr: 0.8 pCi/gBH-17BH-15SS-10137Cs: 13 pCi/g90Sr: 1.4 pCi/gSS-09137Cs: 13 pCi/g90Sr: 0.9 pCi/gST-36137Cs: 0.6 pCi/g90Sr: 0.4 pCi/gSS-12137Cs: 1.6 pCi/g90Sr: 0.4 pCi/gBH-23137Cs: 1.8 pCi/g90Sr: 0.3 pCi/gST-25137Cs: 2.1 pCi/g90Sr: 0.1 pCi/gSS-13137Cs: 0.5 pCi/g90Sr: 0.3 pCi/gSS-14137Cs: 0.2 pCi/g90Sr: 0.2 pCi/gBH-22137Cs: 0.1 pCi/g90Sr: 0.1 pCi/gSS-16137Cs: 0.3 pCi/g90Sr: 0.1 pCi/gFigure F.12 WMA 6 Historical Surface Sampling ResultsRev. 1 F-36
WVDP Phase 1 CSAPFigure F.13 WMA 6 Historical Groundwater Sr-90 ResultsRev. 1 F-37
WVDP Phase 1 CSAPFigure F.14 WMA 6 Historical Groundwater Tritium ResultsRev. 1 F-38
WVDP Phase 1 CSAPFigure F.15 WMA 6 Initial Surface CSMRev. 1 F-39
WVDP Phase 1 CSAPFigure F.16 WMA 6 Initial Subsurface CSMRev. 1 F-40
WVDP Phase 1 CSAPAPPENDIX GWMA 7 PRE-REMEDIATION DATA COLLECTIONG.1 BackgroundWaste Management Area 7 (WMA 7) is approximately 8 acres in size and contains the NDA andancillary structures (see Figures G.1 and G.2 for maps). The NDA was operated by NFS underlicense from the NRC for disposal of solid radioactive waste exceeding 200 mrem/h from fuelreprocessing operations.The NDA is divisible into three distinct areas (Figure G.3): (1) the NFS Waste Disposal Area,which is a U-shaped area containing Deep Disposal Holes and Shallow Special Holes; (2) theWVDP Disposal Trenches and Caissons; and (3) the area occupied by the Interceptor Trenchproject.Other structures and facilities include the Liquid Pretreatment System, the NDA Hardstand, anInactive Plant Water Line, a Leachate Transfer Line, a Former Lagoon located beneath the formerInterim Waste Storage Facility floor slab, a Groundwater Barrier Wall, and a GeomembraneCover.Descriptions of the various features of the NDA follow, and are taken from the Phase 1 DP,Section 3.1.2:NFS Deep Disposal Holes. Approximately 100 NFS Deep Disposal Holes are located in theeastern portion of the U-shaped NFS Waste Disposal Area.About 6,600 cubic feet of leached cladding from reprocessed fuel, also known as hulls, are buriedin these holes. The hulls were contained in 30-gallon steel drums stacked three abreast in theholes. Three of these drums contain irradiated, un-reprocessed fuel with damaged cladding fromthe N-Reactor at the Hanford <strong>Site</strong>. The Deep Disposal Holes also contain LLW generated duringfuel reprocessing.Most of these holes are 2.7 feet by 6.5 feet by 50 to 70 feet deep.Rev. 1 G-1
WVDP Phase 1 CSAPNFS Shallow Special Holes. Approximately 230 NFS Shallow Special Holes are located in thenorthern and western portions of the U-shaped NFS Waste Disposal Area.At least 22 1,000-gallon tanks containing a mixture of spent n-dodecane and tributyl phosphate inabsorbent material were disposed in several of these Shallow Special Holes during the late 1960sand the early 1970s. Eight of these tanks in Special Holes 10 and 11 were believed to be thesource of n-dodecane and tributyl phosphate detected in a nearby monitoring well on November1983.The Shallow Special Holes are typically about 20 feet deep, with various lengths and widths;most are about 12 feet wide and 20 to 30 feet long. The length and width of each hole variedaccording to the quantity of waste requiring disposal at each disposal event, and the dimensionsof large waste items such as failed equipment. Miscellaneous wastes, other than leached hulls orrelated spent fuel debris, were packaged in several types of containers, including steel drums,wooden crates, and cardboard boxes.The following actions were taken by the WVDP between October 1985 and May 1987 to mitigatethe migration of the n-dodecane and tributyl phosphate from Special Holes 10 and 11:• The eight 1,000-gallon tanks containing the n-dodecane/tributyl phosphate contaminatedabsorbents were removed.• The tanks were size-reduced, contaminated absorbents and soils were removed, and all wastewas packaged for disposal.• Liquid n-dodecane and tributyl phosphate was removed and solidified into a qualified wasteform suitable for disposal.• Special Holes 10 and 11 were backfilled.• Approximately 9,700 cubic feet of packaged contaminated soil, contaminated absorbents,size-reduced tanks, and solidified n-dodecane and tributyl phosphate were generated duringthis removal activity.WVDP Trenches. Twelve WVDP Trenches are present; most of these trenches are in the parcelof land located inside the U-shaped NFS Waste Disposal Area.Rev. 1 G-2
WVDP Phase 1 CSAPThe WVDP Trenches contain approximately 200,000 cubic feet of LLW resulting fromdecontamination activities performed between 1982 and 1986.The trenches are typically about 30 feet deep and about 15 feet wide. The lengths vary from 30feet to 250 feet. Trenches 9 and 11 have composite liners and caps. All other WVDP Trenches arecapped with clay.WVDP Caissons. Four WVDP Caissons were constructed by the WVDP near the eastern andsouthern corners of the NDA. The caissons are steel-lined concrete cylindrical vaults.WVDP disposal records indicate approximately 823 cubic feet of waste in drums was placed inCaisson 1. The WVDP disposal records do not indicate that any waste was placed in the otherthree caissons. The report, “Estimated Radionuclide Inventory for the NRC-licensed DisposalArea at the West Valley Demonstration Project” (Wild 2000), indicates that drums containingapproximately 823 ft3 of general waste and sludge from the O2 Building (the original Low-levelWaste Treatment Facility) were placed in Caisson 1.The WVDP Caissons are seven feet in diameter and 60 feet deep, finished so that the top of thecaissons were even with the ground surface. The caissons are plugged with concrete for shieldingand covered with a plastic shield to prevent rainwater infiltration.Interceptor Trench and Liquid Pretreatment System. The Interceptor Trench and associatedLiquid Pretreatment System were installed after groundwater contaminated with tributylphosphate, n-dodecane, and several radionuclides was detected in a well in the NDA. Thepurpose of the project was to intercept potentially contaminated groundwater migrating from theNDA.The Interceptor Trench is located on the northeast and northwest boundaries of the NFS WasteDisposal Area. The base of the trench extends to a minimum of one foot below the interface ofthe weathered Lavery Till with the unweathered Lavery Till. The trench is drained by a drainpipethat directs accumulated water to a collection sump. The collection sump has a submersible pumpto transfer groundwater to the Liquid Pretreatment System. As of 2008, no groundwater has everbeen transferred to the Liquid Pretreatment System.Rev. 1 G-3
WVDP Phase 1 CSAPLiquid that collects in the sump is routinely sampled, analyzed, and transferred to the Low LevelWaste Treatment Facility in WMA 2 for treatment and release. Treated wastewater is dischargedfrom Lagoon 3 in WMA 2 to Erdman Brook through a permitted outfall (SPDES WNSP001).The Liquid Pretreatment System consists of seven tanks made of carbon steel: one 5,000-gallonholding tank, two 1,000 gallon pre-filtration holding tanks, two 700-gallon tanks containinggranular activated carbon, and two 1,000-gallon post-filtration holding tanks. The granularactivated carbon tanks are housed in a wooden shed 12 feet long by 10 feet wide. The other fivetanks are located in a Quonset-style building.NDA Hardstand. The NDA Hardstand is located near the southeast corner of the NDA.It was an interim storage area where radioactive waste was staged before being disposed. TheNDA Hardstand is radiologically contaminated.The NDA Hardstand originally was a three-sided structure with cinder block walls, located on asloped pad of crushed rock 20 feet wide and 20 feet long. The block walls were removed down tocrushed rock pad in September 2006. The crushed rock pad will be removed during Phase 1decommissioning.Inactive Plant Water Line. A buried eight-inch diameter cast iron water line from the plant runsalong the southwestern border of the NDA.The Plant Water Line was formerly used to supply clean water from the reservoirs to the ProcessBuilding, but was taken out of service in 1986 and capped with cement.Leachate Transfer Line. The Leachate Transfer Line is a two-inch diameter buriedpolyvinylchloride pipeline that runs along the northeast and northwest sides of the NDA,continues northward across WMA 6, and terminates at Lagoon 2 in WMA 2. The total length ofthe line is 4,000 feet.The Leachate Transfer Line has two sections. The section of the line described above is currentlyused to transfer groundwater from the NDA Interceptor Trench sump to Lagoon 2. There also isan inactive section of the line that runs from the SDA lagoons to the Interceptor Trench sump; theRev. 1 G-4
WVDP Phase 1 CSAPtwo ends of this section are capped. This section was originally used to transfer liquids from theSDA lagoons via a pump house next to the NDA Hardstand to Lagoon 1.Former Lagoon. This lagoon, formerly used by NFS for collecting surface water runoff, waslocated beneath the former Interim Waste Storage Facility floor slab in the northeastern portion ofthe NDA. Around 1972 it was filled with radiologically contaminated soil from cleanup after aHEPA filter was dropped at the NDA during disposal operations.The Interim Waste Storage Facility floor slab was removed in May 2008 as required for theplanned installation of the Geomembrane Cover over the NDA; the Geomembrane Cover wasinstalled in the fall of 2008.Groundwater Barrier Wall. In July 2008, a subsurface groundwater barrier wall was installed onthe southwest and southeast sides of the NDA to minimize groundwater migration into the NFSWaste Disposal Area. This barrier wall is a soil-bentonite slurry wall with a maximum hydraulicconductivity of 1E-07 cm/s that is keyed at least five feet into the underlying unweathered LaveryTill. The slurry wall is approximately 850 feet long, three feet wide, and is 15 to 20 feet deep.Geomembrane Cover. In the fall of 2008 the NDA was covered with XR-5, an ethylene interpolymeralloy geomembrane, to limit infiltration of precipitation into the NFS Waste DisposalArea. During installation of the XR-5 geomembrane, imported backfill was placed on the surfaceof the NDA and the surface was graded to form a suitable foundation for the geomembrane.G.2 Physical SettingThe WMA 7 area is located on the South Plateau, and is bounded by WMA 12 South to the north,WMA 6 to the west, WMA 9 to the south, and WMA 8 to the east.The WMA 7 area was originally relatively flat and farmed prior to site development. After sitedevelopment began, the majority of the WMA 7 area was used for the NDA, or for NDA supportactivities, with the surface reworked several times over the years. In its current configuration, theWMA 7 area includes the capped NDA, a groundwater barrier wall that wraps around the westand south boundary of the NDA, a groundwater interceptor drain that wraps around the north andRev. 1 G-5
WVDP Phase 1 CSAPeastern ends of the NDA, various support facilities immediately above the NDA for leachatecollection, and the NDA Hardstand in the southeastern portion of the area.The WMA 7 area is drained by two drainage features, one running along the eastern boundary ina northerly direction, and the second that runs along the northern boundary in an easterlydirection. Both features eventually drain into Erdman Brook.The WMA 7 area is underlain by the weathered and unweathered Lavery Till. The weatheredLavery Till allows some groundwater movement. Groundwater within the weathered Lavery Tillflows to the northeast, following the surface topography.The unweathered Lavery Till is a relatively impermeable unit. Groundwater flows verticallythrough the unweathered Lavery Till to the Kent Recessional Sequence.Within the unweathered Lavery Till there is a layer known as the Kent Recessional Sequence thatis more permeable and that does transport groundwater. Groundwater within the KentRecessional Sequence, in general, moves to the northeast, discharging to Buttermilk Creek.Subsurface features associated with the NDA extend through the weathered Lavery Till into theunweathered Lavery Till, but do not penetrate the Kent Recessional Sequence.Figure G.4 shows a west-to-east cross-section of the subsurface through the NDA.G.3 Area HistoryFigure G.5 shows the WMA 7 area in 1962, before site development. The area at that time wasfarmed.Figure G.6 shows the WMA 7 area in 1966. The area had already been largely cleared, althoughfrom this photograph it is not possible to determine its use.Figure G.7 shows the WMA 7 area in 1968. Area development has continued, with the footprintof the NDA now fairly well-defined.Rev. 1 G-6
WVDP Phase 1 CSAPFigure G.8 shows the WMA 7 area in 1977. The NDA Hardstand is visible in the southeast cornerof WMA 7 and in use. There also appears to be temporary storage along the western edge of theNDA.Figure G.9 shows the WMA 7 area in 1984. At this point in time the NDA was largely coveredand re-vegetated, with the exception of the center of the NDA. In this photograph a structure isvisible towards the north end of the NDA and activity is visible in the WVDP disposal area.Figure G.10 shows the WMA 7 area in 1995. The area is now completely re-vegetated.Figure G.11 shows the WMA 7 area in 2007 before the placement of the NDA GeomembraneCover. The SDA’s geomembrane cover is visible.G.4 Known and Suspected ReleasesG.4.1 NDA OperationsPotentially Affected Media: surface soil, subsurface soil, groundwaterPotentially Affected WMAs: 7The buried waste in the NDA is known to contain a large amount of radioactivity. It is estimatedthat the total radioactivity will be approximately 229,000 curies in 2011 (DOE 2009 Table 2-20).Surface soil contamination above background levels is likely present in the immediate vicinity ofthe NDA. This contamination would be associated with air deposition of contaminants duringNDA waste placement activities.G.4.2 NDA Hardstand SpillsPotentially Affected Media: surface soil, subsurface soil, groundwaterPotentially Affected WMAs: 7, 8The NDA Hardstand area is known to be contaminated and is currently roped off as a radiologicalcontrolled area. The source of contamination was presumably releases from containers.Rev. 1 G-7
WVDP Phase 1 CSAPG.4.3 Drainage Area ReleasesPotentially Affected Media: surface soil, subsurface soil, sediment, groundwaterPotentially Affected WMAs: 7, 8A drainage area located between the SDA and the NDA is believed to contain contaminated soil.Presumably, this swale has been contaminated from spills during waste burial operations by NFS,and also during leachate control activities after SDA closure.During the NDA tank removal and subsurface control period in the 1980s and 1990s, the swalearea was re-contoured to prevent erosion. An unknown amount of low-level radioactivecontamination remains in that area, evidenced by continuing elevated radioactive contaminantindicators in surface water immediately downstream. The swale area is approximately 30 feetwide and runs approximately 300 feet north, along the drainage from the NDA Hardstand. Basedupon observations during radiation surveys in 1982, the contamination appeared to havepermeated porous fill in the swale channel. Gamma readings in that area were five to seven timesbackground, not inconsistent with observed downstream gross beta contamination. Surface soilcontamination is still occasionally noted in that area.G.5 Existing DataExisting data sets for this area include:• Extensive historical record searches and modeling have been used to determine theactivity contents of the NDA (WVNSCO 1982).• In 1982 static direct exposure readings were collected across the WVDP premises(WVNSCO 1992). Only a small portion of WMA 7 was covered by these measurementson a 10-m grid. Figure G.12 shows these results color-coded by the exposure readingsencountered, with the data overlain on a 1977 aerial photograph. The data indicateelevated surface contamination associated with the two WMA 7 drainage features.Rev. 1 G-8
WVDP Phase 1 CSAP• In 1990 and 1991 a second static direct exposure measurement program was conductedacross the WVDP premises (WVNSCO 1992). In the case of WMA 7, this effortprovided systematic coverage of its entire area on a 10-m grid. This data collection useddifferent instrumentation and protocols than the 1982 study, so the results are notquantitatively comparable. Figure G.13 shows these results overlain on a 1995 aerialphotograph.• There are very little soil sampling data for WMA 7 available within ELIMS. In 1993 twosurface samples were collected and two soil cores were obtained. Figure G.14 shows theCs-137 and Sr-90 results for surface samples from these locations. The locations in thenortheastern corner showed Cs-137 and Sr-90 impacts. None of the samples were inlocations where one would expect to see the highest levels of impacts, based on thehistorical gamma measurements. Table G.1 identifies the number of locations analyzedfor each of the 18 primary radionuclides of interest.• There is a fair amount of historical groundwater sampling data available for WMA 7within ELIMS. Figure G.15 shows groundwater sampling locations color-coded byhistorical Sr-90 results. Figure G.16 shows the same for tritium results. In both cases thevarious wells displayed are screened in different geological units. The detection limits forSr-90 and tritium varied widely among ELIMS samples. 10 pCi/L and 500 pCi/L wereselected as thresholds for Sr-90 and tritium, respectively, because based on ELIMS dataresults above these activity concentrations were consistently above method detectionlimits and so indicative of contamination impacts rather than simply measurement error.As is evident from these two figures, there have been groundwater impacts in the vicinityof WMA 7, particularly to the north and northwest. Contaminated groundwater in thisarea is shallow and likely discharges via wetlands, ditches, and seeps to Erdman Brook,which runs along the north edge of WMA 7 and is fed by two drainage featuresoriginating within WMA 7.G.6 Planned Phase 1 DP ActivitiesThe remaining gravel pad associated with the NDA Hardstand will be removed along with the toptwo feet of soil (DOE 2009 Sections 3.1 and 7.8).Rev. 1 G-9
WVDP Phase 1 CSAPPhase 1 will not address the NDA itself and the associated Interceptor Trench.G.7 <strong>Conceptual</strong> <strong>Site</strong> <strong>Model</strong>Historical activities within the WMA 7 footprint have almost exclusively been associated with theNDA. One would expect to find surface soil contamination impacts outside the NDAGeomembrane Cover resulting from dust deposition and discrete spills and leaks during NDA andSDA operation (the SDA is immediately adjacent to the east). It is likely contamination would bemore concentrated in drainage features and around the NDA hardstand. Historical gammameasurements support these assumptions.Because of the significant amount of soil reworking and re-contouring that has occurred withinWMA 7 over the years, it is possible that subsurface soil contamination exists, particularly alongthe northeastern and eastern edges of WMA 7 and potentially associated with buriedinfrastructure backfill that is present at the site. In addition, contaminated leachate/groundwaterassociated with the NDA has likely contaminated subsurface soils adjacent to and downgradientfrom the NDA.Figure G.17 shows the current <strong>Conceptual</strong> <strong>Site</strong> <strong>Model</strong> (CSM) for WMA 7 surface soils. Theportion of the WMA 7 area covered under the NDA Geomembrane Cover is not within thePhase 1 scope of activities.G.8 WMA 7-Specific Characterization Goals• Evaluate Appropriateness of the Current List of Radionuclides of Interest (ROI).• Verify Absence of Additional ROI.• Explore the Possibility of Surrogate ROI.• Determine Extent of Surface Contamination.• Identify the Presence/Absence of Subsurface Soil Contamination.• Identify Soil Waste Stream Characteristics.• Develop an Inventory of Buried Infrastructure.• Obtain Data to Support Phase 2 Planning.Rev. 1 G-10
WVDP Phase 1 CSAPG.9 CSAP Pre-Remediation Data Collection and Associated Decision-MakingCSAP pre-remediation data collection will consist of a number of components described in moredetail below. Data collection will only take place in those portions of WMA 7 that are notcovered by the NDA geomembrane cover.G.9.1 Buried InfrastructureThe footprint of buried infrastructure will be identified and mapped. The focus would be onburied infrastructure that has footprints outside the NDA geomembrane cover. [required]G.9.2 Gamma Walkover Survey DataThe purpose of performing a gamma walkover survey of the WMA 7 area is to identify the leveland extent of surface contamination. This includes both general trends in average activityconcentrations pertinent to the CG w requirement, as well as the identification of isolated, moreelevatedanomalies that might be indicative of discrete releases and/or CG emc concerns.A complete (100%) logged gamma walkover survey (GWS) will be conducted for accessibleareas within WMA 7, with the exception of the NDA capped area. Examples of areas that wouldnot be accessible (besides the capped area) are areas where standing water is present in wetlands.This is most likely to occur in the northeastern corner of WMA 7. Based on the GWS results,surface soil within WMA 7 will be divided into four categories: (1) surface soils where GWS dataindicate contamination above CG w requirements; (2) surface soils where GWS data indicatecontamination, but it is not clear if contamination exceeds surface soil CG w requirement; (3)surface soils where GWS indicate impacts, but those impacts are not expected to exceed surfacesoil CG w standards; and (4) surface soils where there is no indication of impacts abovebackground conditions. The purpose of this data collection is to provide insights into the spatialdistribution of surface contamination, and to guide subsequent soil sampling. [required]Rev. 1 G-11
WVDP Phase 1 CSAPG.9.3 Surface Soil SamplingSurface soil sampling will be used to address areas inaccessible to GWS data collection, toresolve hot spots identified by the GWS data, and to evaluate the presence, absence, and/or extentof surface contamination above CG w requirements based on GWS results.• Wetlands. It is possible that standing water will be present in wetlands that prevent GWSdata collection from those areas. The most likely place for this to occur is along theeastern boundary of WMA 7. Soil sampling will be required for wetland footprints andfor any other areas where standing water prevents the collection of GWS data.For every area where standing water or saturated soil conditions prevent GWS datacollection, systematic soil sampling will take place. For wetland areas less than 200 m 2 insize, one sample will be collected. For areas between 200 and 1,000 m 2 in size, onesample per 200 m 2 will be collected. For areas between 1,000 and 2,500 m 2 in size, fivesamples will be collected. For areas exceeding 2,500 m 2 in size, at minimum one samplewill be collected per 500-m 2 area. One sample will be collected from each locationrepresentative of a 0-15 cm depth interval. Locations will be selected to providesystematic coverage of the area of interest. [contingent]• Hot Spots. If GWS data indicate the presence of contamination that possibly exceeds“hot spot” (CG emc ) standards or an isolated elevated area is identified that appearsindicative of a discrete release, the location of concern will be sampled with a biasedsample. If biased samples are collected from a particular location, they will be collectedfrom two depth intervals: 0-15 cm, and 15 cm-1 m. The 0-15 cm samples will beanalyzed for the 12 radionuclides of potential interest in addition to the 18 ROI. Onedown-hole gamma scan will be conducted from each biased location. The purpose ofthese samples is to resolve GWS anomalies, evaluate the appropriateness of the currentROI list, and verify the absence of additional ROI. [contingent]• CG w Sampling. Surface soil sampling may be conducted after the GWS to further clarifyresults, with the level and nature of sampling dependent on GWS results. If GWS resultsindicate no evidence of contamination impacts above background levels, no additionalsurface soil sampling will be required other than to address areas too wet to perform aRev. 1 G-12
WVDP Phase 1 CSAPgamma walkover survey. Based on historical direct gamma measurements, the areas mostlikely to have contamination exceeding surface soil CG w requirements are along theboundary between WMA 7 and WMA 8.oIf GWS results indicate contamination impacts above background levels but thatsurface soil contaminant levels exceeding CG w requirements are unlikely, thearea of interest will be systematically sampled using a triangular grid with adensity of one sample per 400 m 2 . One sample will be collected from eachlocation representative of a 0-15 cm depth interval. Locations will be selected toprovide systematic coverage of the area of interest. The purpose is to documentthe activity concentrations present in surface soils within WMA 7. [contingent]oIf GWS results indicate surface soil contaminant levels exceeding CG wrequirements likely exist, one sampling location will be selected at the highestgross activity level to confirm CG w exceedances and another set of samplinglocations will be identified to spatially bound the extent of contamination (i.e.,along the boundary of what is considered likely above CG w requirements) if thisis not obvious from the GWS data. Two samples will be collected from thelocation targeting high gross activity levels, one representative of a 0-15 cmdepth interval, and one representative of a 15 cm-1 m depth interval. One samplewill be collected from each location intended to laterally bound contamination,representative of a 0-15 cm depth interval. In addition, the location targeting highgross activity levels will have one down-hole gamma scan conducted at thecenter of the location with static measurements taken every 15 cm. The purposeis to document CG w requirement exceedances and bound the lateral extent ofcontamination. [contingent]oIf GWS results indicate areas with surface soil contamination impacts but it isunclear whether CG w requirement exceedances are present, at most five samplinglocations will be selected that systematically cover the areas of interest. Onesample will be collected from each location representative of a 0-15 cm depthinterval. Locations will be selected to provide systematic coverage of the area ofinterest. The purpose is to resolve the question of whether CG w requirementexceedances exist for areas where GWS results are ambiguous. [contingent]Rev. 1 G-13
WVDP Phase 1 CSAPoIf any 0-15 cm interval yields a sample result indicating a CG w requirementsexceedance and that sample location is not laterally bounded either by existingsampling locations with results less than CG w requirements or by GWS data thatclearly indicate contamination is not a concern, additional sampling locationswill be selected so that the contamination encountered is spatially bounded.Sampling to laterally bound contamination will not compromise the NDAgeomembrane cover or extend into WMA 8, but may extend, if necessary, intoWMA 12 and/or WMA 6. The purpose is to laterally bound contamination that isabove CG w requirements. [contingent]G.9.4 Subsurface Soil SamplingThe purpose of subsurface soil sampling within WMA 7 is to determine presence and verticalextent of contamination impacts above background levels.• If any 0-15 cm surface soil sample result indicates contamination impacts abovebackground levels and there was not a 15 cm-1 m sample collected from that location, a15 cm-1 m sample will be collected from that location following the protocols used forthe original 0-15 cm surface soil sample. In addition, each soil location will have onedown-hole gamma scan conducted at the center of the location with static measurementstaken every 15 cm. [contingent]• If a surface soil sample indicates contamination impacts above background levels for the15cm-1 m depth interval, an additional sample from a depth of 1-2 m will be collectedand analyzed from that location. This process will continue until the vertical extent ofcontamination above background is bounded. One down-hole gamma scan will beconducted from each soil location requiring deeper investigation with a static readingtaken every 15 cm vertically. The purpose of these samples is to define the vertical extentof contamination. [contingent]G.9.5 Drainage Feature SamplingRev. 1 G-14
WVDP Phase 1 CSAPWMA 7 contains two distinct drainage features, one along the eastern boundary of the NDA anda second along the northern boundary. For drainage features within WMA 7, the surface soil CG wrequirements apply. Surface drainage feature sampling will be conducted to determine ditchsediment contamination status relative to surface soil CG w requirements. Surface drainagefeatures will be sampled as follows:• Samples representing a 0-15 cm depth interval will be collected from ditch sediments. Inaddition, ditch sampling along the eastern boundary will include samples representing a15 cm-1 m depth interval. In WMA 7, the two ditches have a combined length ofapproximately 90 m. Samples will be systematic located using a random start, separatedby 30 m. [required]• If any 0-15 cm sample result indicates contamination impacts above background levelsand a 15 cm-1 m sample was not also collected, a 15 cm-1 m sample will be collectedfrom that location following the protocols used for the original 0-15 cm sample.[contingent]• If a sample indicates contamination impacts above background levels for the 15 cm-1 mdepth interval, an additional sample from a depth of 1-2 m will be collected and analyzedfrom that location. This will be repeated, as necessary, until the vertical extent ofcontamination impact is bounded at that location. [contingent]• The two WMA 7 drainage features combine to feed Erdman Brook in WMA 12 South. Ifditch contamination above surface soil CG w requirements is encountered that extends tothe boundary with WMA 12 South, sampling will continue with a 30 m spacing intoWMA 12 South following the drainage feature until contamination above surface soilCG w requirements is bounded or the portion of Erdman Brook is encountered wheresediment CG requirements apply. [contingent]G.9.6 Buried Infrastructure Soil SamplingSoils associated with buried infrastructure within WMA 7 will be sampled to determine theircontamination status.Rev. 1 G-15
WVDP Phase 1 CSAP• Three locations along each piece of buried infrastructure within WMA 7 but outside theNDA geomembrane cover will be selected for soil excavation. These locations will beselected to maximize the possibility that contamination will be encountered (e.g.,locations where historical or current GWS data indicate surface contamination exists).During excavation, exposed soils will be monitored by scans for evidence of elevatedgross activity. The purpose of this sampling is to evaluate the presence of contaminationassociated with buried infrastructure. [required]oIf elevated readings are encountered below a depth of 1 m, soils exhibiting thehighest levels of gross activity will be sampled and analyzed.oIf elevated readings are not encountered below a depth of 1 m, a samplerepresentative of soils deeper than 1 m will be collected. In the case ofinfrastructure that did not carry waste, the sample will be from soils immediatelyabove the line. In the case of infrastructure that did carry waste, the sample willbe from soils immediately beneath the line.• If contamination above background conditions is encountered at any selected location,trenching will continue to depth until background conditions are observed. An additionalsample will be collected from the base of the trench to verify background conditions. Thepurpose is to vertically bound observed contamination. [contingent]• If buried infrastructure soil sampling identifies contamination impacts greater thanbackground, biased sampling will continue following the line until at least twoconsecutive locations yield soil samples below surface soil CG w requirements. Locationspacing will be based on engineering judgment, including the geometry of the line, thelevel of contamination encountered, and surface evidence of contamination. The purposeof this sampling is to bound the extent of contamination associated with buriedinfrastructure, as necessary. [contingent]G.9.7 Additional ContingenciesSampling and/or GWS data may indicate that contamination exists or extends beneath surfacescurrently covered by existing structures, concrete, asphalt, or gravel. In this case, “surface soil”Rev. 1 G-16
WVDP Phase 1 CSAPwill be defined as soil immediately beneath the cover. If sampling or GWS data indicate thatcontamination may exist beneath existing structures (e.g., the NDA geomembrane cover or thehardstand area), then sampling locations will be offset along the foundation/hardstand edge todetermine contamination extent. The purpose of the offset is to allow safe acquisition of data.Data collection through the NDA geomembrane cover or through hardstands in WMA 7 will notbe required as part of this effort.G.9.8 Required <strong>Laboratory</strong> AnalysesAll samples will be submitted for analysis of all 18 ROI.A select portion of the samples as described above may be analyzed for the additional12 radionuclides of potential interest. If these sample results indicate the presence of the one ormore of those radionuclides at levels of potential significance, then the balance of samples fromWMA 7 will also be analyzed for the additional radionuclides that were identified.Table G.2 summarizes the required sample numbers and the estimated number of contingencysamples for WMA 7.This sampling plan assumes that quick turn-around analyses are available for Sr-90 and Cs-137and that soil samples will be screened for Sr-90 and Cs-137 prior to being analyzed for thebalance of the ROI. Contingency sampling requirements as described above may be undertakenbased on these screening data.G.9.9 Decision-Making SummaryA summary of decision-making based on the WMA 7 data is as follows:• If buried infrastructure of concern in addition to the Interceptor Trench and LeachateTransfer Line is identified, then biased locations will be selected, excavation conductedto expose the trench/line, and at least one biased sampled collected. If contamination isencountered above CG w requirements, sampling will continue along the trench/lines untilit is bounded.Rev. 1 G-17
WVDP Phase 1 CSAP• Backfill associated with the Interceptor Trench and Leachate Transfer Line will besampled. If contamination is encountered above CG w requirements, sampling willcontinue along the trench/line until contamination is bounded.• The WMA 7 surface soil area classification as contained in Figure G.17 will be adjustedbased on GWS results. These adjustments may affect systematic sample numberrequirements and will affect the placement of the initial round of systematic samplelocations.• Additional surface soil sampling may be required to laterally bound contamination abovesurface soil CG w requirements.• If any 15 cm-1 m soil interval encounters contamination above CG w requirements,additional deeper 1 m interval soil samples will be required for that location to determinevertical extent of contamination. If additional vertical samples are required, verticalsampling will continue until background activity concentrations are observed.• Based on the GWS results, locations from the two drainage features will be selected forsampling.• If any drainage feature sample encounters contamination above CG w requirements,additional systematic sampling from the ditch feature will be required to further definethe extent of contamination in the drainage feature.G.10 ReferencesDOE 2009. Phase I Decommissioning Plan for the West Valley Demonstration Project, Rev 2,prepared by Washington Safety Management Solutions, URS Washington Division,Science Applications International Corporation, prepared for DOE, December 2009.DOE 2010. Final Environmental Impact Statement for Decommissioning and/or Long-TermStewardship at the West Valley Demonstration Project and Western New York NuclearService Center, Vol 1, DOE/EIS-0226, January 2010.Rev. 1 G-18
WVDP Phase 1 CSAPTable G.1 Historical Data AnalysesNuclide# of SurfaceSoilLocations# ofSubsurfaceSoilLocations# of SedimentLocationsAm-241 1 2 1C-14 0 0 0Cm-243 0 0 0Cm-244 0 0 0Cs-137 4 2 1I-129 0 0 0Np-237 0 0 0Pu-238 1 2 1Pu-239 1 2 1Pu-240 1 2 1Pu-241 1 2 1Sr-90 4 2 1Tc-99 0 0 0U-232 1 2 1U-233 1 2 1U-234 1 2 1U-235 1 2 1U-238 1 2 1Rev. 1 G-19
WVDP Phase 1 CSAPTable G.2 Sample Number EstimatesRequired Contingent TotalSystematic Sediment Samples3 0 3(0-15 cm)Systematic Sediment Samples2 1 3(15 cm-1 m)Biased Sediment Samples2 6 8(0-15 cm)Biased Surface Soil Samples0 3 3(0-15 cm)Biased Surface Soil Samples0 3 3(15 cm-1 m)Continent Surface Soil0 20 20SamplesSystematic Subsurface Soil0 3 3Samples (1-m intervals)Biased Subsurface Soil0 3 3Samples (1-m intervals)Buried Infrastructure Soil6 6 12SamplesTotal: 13 45 58Rev. 1 G-20
WVDP Phase 1 CSAPFigure G.1 WMA 7 (from Phase 1 DP, Figure 3-41)Rev. 1 G-21
WVDP Phase 1 CSAPFigure G.2 WMA 7 with TopographyRev. 1 G-22
WVDP Phase 1 CSAPFigure G.3 WMA 7 Contents (from Phase 1 DP, Figure 2-8)Rev. 1 G-23
WVDP Phase 1 CSAPFigure G.4 Subsurface Cross-Section of WMA 7 Area (from Phase 1 DP, Figure 3-7)Rev. 1 G-24
WVDP Phase 1 CSAPFigure G.5 WMA 7 Aerial Photograph from 1962Rev. 1 G-25
WVDP Phase 1 CSAPFigure G.6 WMA 7 Aerial Photograph from 1966Rev. 1 G-26
WVDP Phase 1 CSAPFigure G.7 WMA 7 Aerial Photograph from 1968Rev. 1 G-27
WVDP Phase 1 CSAPFigure G.8 WMA 7 Aerial Photograph from 1977Rev. 1 G-28
WVDP Phase 1 CSAPFigure G.9 WMA 7 Aerial Photograph from 1984Rev. 1 G-29
WVDP Phase 1 CSAPFigure G.10 WMA 7 Aerial Photograph from 1995Rev. 1 G-30
WVDP Phase 1 CSAPFigure G.11 Aerial Photograph from 2007Rev. 1 G-31
WVDP Phase 1 CSAPFigure G.12 WMA 7 1982 Direct Gamma Measurement ResultsRev. 1 G-32
WVDP Phase 1 CSAPFigure G.13 WMA 7 1990-1991 Direct Gamma Measurement ResultsRev. 1 G-33
WVDP Phase 1 CSAPSS-15137Cs: 4.7 pCi/g90Sr: 3.3 pCi/gBH-42137Cs: 4.1 pCi/g90Sr: 0.9 pCi/gST-23137Cs: 0.9 pCi/g90Sr: 3.3 pCi/gST-23137Cs: 0.0 pCi/g90Sr: 0.0 pCi/gFigure G.14 WMA 7 Historical Surface Sampling ResultsRev. 1 G-34
WVDP Phase 1 CSAPFigure G.15 WMA 7 Historical Groundwater Sr-90 ResultsRev. 1 G-35
WVDP Phase 1 CSAPFigure G.16 WMA 7 Historical Groundwater Tritium ResultsRev. 1 G-36
WVDP Phase 1 CSAPFigure G.17 Initial WMA 7 Surface Soil CSMRev. 1 G-37
WVDP Phase 1 CSAPThis page intentionally left blank.Rev. 1 G-38
WVDP Phase 1 CSAPAPPENDIX HWMA 9 PRE-REMEDIATION DATA COLLECTIONH.1 BackgroundThe Waste Management Area 9 (WMA 9) is approximately 12 acres in size and contains theDrum Cell, Subcontractor Maintenance Area, and NDA Trench Soil Container Area (see FiguresH.1 and H.2 for maps). The descriptions below are taken from the Phase 1 DP, Section 3.1.2.Drum Cell. The Drum Cell was built in 1987 to store radioactive waste solidified in cement andpackaged in square 71-gallon drums. It is a pre-engineered metal building 375 feet long, 60 feetwide, and 26 feet high. The facility consists of a base pad, concrete shield walls, remote wastehandling equipment, container storage areas, and a control room within the weather structure. Thebase pad consists of concrete blocks set on a layer of compacted crushed stone, underlain bygeotextile fabric and compacted clay. Concrete curbs to support the drum stacks lie on top of thebase pad. All of the drums stored in the Drum Cell were removed in 2007 and disposed of atoffsite LLW disposal facilities. The Drum Cell will be removed during Phase 1 of the proposeddecommissioning.Subcontractor Maintenance Area. The Subcontractor Maintenance Area (also known as theContractor Vehicle Hardstand) is a compacted gravel pad measuring approximately 20 feet by 30feet located in the northwest corner of WMA 9. Prior to 1991, it was used by constructionsubcontractors to clean asphalt paving equipment with diesel fuel. In November 1991, the areawas remediated by removing the upper six inches of soil and replacing it with clean gravel. Theremoved soil was tested for Toxicity Characteristic Leaching Procedure parameters and found tobe nonhazardous solid waste. Since 1991, the area has been used as a staging area for heavyequipment and construction materials (stone, gravel). The gravel pad will be removed duringPhase 1 of the proposed decommissioning.NDA Trench Soil Container Area. The NDA Trench Soil Container Area (comprising the NDARoll-Off Hardstand and the Empty Waste Container Hardstand) is a gravel pad storage arealocated on the north side of WMA 9. It was used to store roll-off containers containing soilexcavated during the installation of the NDA Interceptor Trench (located in WMA 7), which wasRev. 1 H-1
WVDP Phase 1 CSAPcompleted in 1990. The containers were covered with tarps to prevent infiltration of precipitationand their rear gates were equipped with rubber gaskets to prevent discharge of any soil or liquid.The roll-off containers and their contained soil have been removed and disposed of offsite. Thegravel pad will be removed during Phase 1 of the proposed decommissioning.H.2 Physical SettingWMA 9 is primarily flat and located on the South Plateau. It is bordered to the southeast andsouthwest by wetlands. It is bordered to the west by the WVDP premises fence line, WMA 6, andWMA 10, to the north by WMA 6 and WMA 7, to the east by WMA 8, and to the south by theWVDP premises fence line. The railroad spur servicing the site runs through the western end ofWMA 9. Approximately 2.6 acres of WMA 9 is composed of hardstands, roads, or railroad bed.WMA 9 is underlain by the Lavery Till, a relatively impermeable unit. Groundwater flowsvertically through the unweathered Lavery Till to the Kent Recessional Sequence. The KentRecessional Sequence is more permeable and does transport groundwater in a northeasterlydirection, discharging to Buttermilk Creek.WMA 9 is currently drained by three distinct drainage ditches trending from the northwest to thesoutheast where they feed Franks Creek. These include one running along the eastern side of therailway, one connecting with the southwest side of the Drum Cell facility, and one runningparallel to the northeast side of WMA 9.H.3 Area HistoryFigure H.3 shows WMA 9 in 1962, prior to site development. Prior to site development, thenorthern portion of WMA 9 was farmed. The southern portion was a shrubby area drained by thewestern reaches of Franks Creek.Figure H.4 shows WMA 9 in 1966, after development of the site had begun. When the site wasestablished, the drainage features of WMA 9 were altered so that the drainage was aligned withthe fence line along the south side of WMA 9. The railroad was installed by the mid 1960s, andthe northern portion of WMA 9 was cleared and used for open storage.Rev. 1 H-2
WVDP Phase 1 CSAPFigure H.5 shows WMA 9 in 1968, with an active open storage area visible adjacent to WMA 9’sboundary with WMA 6 and WMA 7.Figure H.6 shows WMA 9 in 1977. A cleared area in the southeastern portion of WMA 9 wasconnected to the SDA area via an access road.Figure H.7 shows WMA 9 in 1984. By this time the SDA was covered; a road providing accessfrom the SDA to the southern portion of WMA 9 was present.Figure H.8 shows WMA 9 in 1995. The Drum Cell facility is in place, and the hardstand areas tothe north have been changed to match their present configuration. To the south, the access roadfrom the SDA was present.Figure H.9 shows WMA 9 in 2007. The SDA has been capped.H.4 Known and Suspected ReleasesThere are no known or suspected significant releases that originated within WMA 9. The DrumCell is expected to contain only low levels of residual radioactivity, if any. There may have beencontaminated soil releases as part of the NDA Interceptor Trench work. Surface soils may havebeen contaminated by dust during the placement of wastes in the NDA (WMA 7) and SDA(WMA 8).H.5 Existing DataExisting data sets for this area include:• In 1982 static direct exposure readings were collected across the WVDP premises(WVNSCO 1982). Only a very small portion of WMA 9 was covered by thesemeasurements on a 10-m grid. Figure H.10 shows these results color-coded by theexposure readings encountered, with the data overlain on a 1977 aerial photograph. Thedata suggest a slight impact along the railway line. The impacts likely extend into WMA9.Rev. 1 H-3
WVDP Phase 1 CSAP• In 1990 and 1991 a second static direct exposure measurement program was conductedacross the WVDP premises (WVNSCO 1992). In the case of WMA 9, this effortprovided systematic coverage of its entire area on a 10-m grid. This data collection useddifferent instrumentation and protocols than the 1982 study, so the results are notquantitatively comparable. Figure H.11 shows these results overlain on a 1995 aerialphotograph. These data show marked elevated readings surrounding the Drum Cell.Given what was stored in the Drum Cell in this time frame, these readings may reflectshine from the building itself rather than elevated activity levels in the ground surface.• There are very little sampling data for WMA 9 available within ELIMS. In 1993 twosurface samples were collected pertinent to WMA 9, one in the extreme northwest cornerof WMA 9 and the second in the extreme southeast corner of WMA 9. Figure H.12shows the Cs-137 and Sr-90 results for these two samples. Both samples showed lowlevel Sr-90 impacts; although there was some evidence of Cs-137 as well, the Sr-90 weremore significant from the perspective of surface soil CG w requirements. Neither samplewas placed in a location where one would expect to find contamination. Table H.1identifies the number of samples analyzed for each of the 18 primary radionuclides ofinterest (ROI).• There are limited groundwater data for WMA 9 available within ELIMS. Figure H.13shows groundwater sampling locations color-coded by historical Sr-90 results. FigureH.14 shows groundwater sampling locations color-coded by historical tritium results. Thedetection limits for Sr-90 and tritium varied widely among ELIMS samples. 10 pCi/L and500 pCi/L were selected as thresholds for Sr-90 and tritium, respectively, because basedon ELIMS data results above these activity concentrations were consistently abovemethod detection limits and so indicative of contamination impacts rather than simplymeasurement error. In neither case was there significant evidence of groundwaterimpacts.H.6 Planned Phase 1 DP ActivitiesThe Drum Cell, the Subcontractor Maintenance Area hardstand, and the NDA Trench SoilContainer Area hardstand will be removed during Phase 1 (DOE 2009 Sections 3.1 and 7.10).Rev. 1 H-4
WVDP Phase 1 CSAPH.7 <strong>Conceptual</strong> <strong>Site</strong> <strong>Model</strong>Historical WMA 9 site activities have primarily included open land surface storage and storage ofcement solidified radioactive waste in steel drums within the Drum Cell. Although no significantreleases have been reported for this area, it is possible that there were releases associated withstorage activities. These would likely have been low level releases; these would have beenconfined to surface soils. There is the possibility that the construction of the current configurationof hardstands might have buried surface contamination that existed prior to their construction.There is also the possibility that contamination may have found its way into the surface drainagefeatures that drain the WMA 9 area into Franks Creek.The only buried infrastructure expected within the WMA 9 area would be associated withelectrical lines. Subsurface soil contamination associated with these lines is not considered asignificant concern since there is little historical evidence of significant surface soil impacts.Figure H.15 shows the current CSM for WMA 9 surface soils.H.8 WMA 9-Specific Characterization Goals• Evaluate Appropriateness of the Current List of Radionuclides of Interest (ROI).• Explore the Possibility of Surrogate ROI.• Determine Extent of Surface Contamination.• Identify the Presence/Absence of Subsurface Soil Contamination.• Identify Soil Waste Stream Characteristics.• Obtain Data to Support Phase 2 Planning.H.9 CSAP Pre-Remediation Data Collection and Associated Decision-MakingCSAP pre-remediation data collection will consist of a number of components described in moredetail below.Rev. 1 H-5
WVDP Phase 1 CSAPH.9.1 Gamma Walkover Survey DataThe purpose of performing a gamma walkover survey of the WMA 9 area is to identify the leveland extent of surface contamination. This includes both general trends in average activityconcentrations pertinent to the CG w requirement, as well as the identification of isolated, moreelevatedanomalies that might be indicative of discrete releases and/or CG emc concerns.A complete (100%) logged gamma walkover survey (GWS) will be conducted for accessibleareas within WMA 9. Examples of areas that would not be accessible are areas where standingwater is present in wetlands and the footprints of existing buildings. Based on the GWS results,surface soil within WMA 9 will be divided into four categories: (1) surface soils where GWS dataindicate contamination above CG w requirements; (2) surface soils where GWS data indicatecontamination, but it is not clear if contamination exceeds surface soil CG w requirement; (3)surface soils where GWS indicate impacts, but those impacts are not expected to exceed surfacesoil CG w standards; and (4) surface soils where there is no indication of impacts abovebackground conditions. The purpose of this data collection is to provide insights into the spatialdistribution of surface contamination, and to guide subsequent soil sampling. [required]H.9.2 Surface Soil SamplingSurface soil sampling will be used to address areas inaccessible to GWS data collection, toresolve hot spots identified by the GWS data, and to evaluate the presence, absence, and/or extentof surface contamination above CG w requirements based on GWS results.• Wetlands. It is possible that standing water will be present in wetlands that prevent GWSdata collection from those areas. The most likely place for this occurring is along thewestern bank of the railway line. Soil sampling will be required for wetland footprintsand for any other areas where standing water prevents the collection of GWS data.For every area where standing water or saturated soil conditions prevent GWS datacollection, systematic soil sampling will take place. At least one and at most fivesampling locations will be selected per area. One sample will be collected from eachlocation representative of a 0-15 cm depth interval. Locations will be selected to providesystematic coverage of the area of interest with a maximum sample density of one sampleRev. 1 H-6
WVDP Phase 1 CSAPper 200 m 2 area. If a wetland area is less than 200 m 2 in size, one sample will becollected. [contingent]• Hot Spots. If GWS data indicate the presence of contamination that possibly exceeds“hot spot” (CG emc ) standards or an isolated elevated area is identified that appearsindicative of a discrete release, the location of concern will be sampled with a biasedsample. If biased samples are collected from a particular location, they will be collectedfrom two depth intervals: 0-15 cm, and 15 cm-1 m. The 0-15 cm samples will beanalyzed for the 12 radionuclides of potential interest in addition to the 18 ROI. Onedown-hole gamma scan will be conducted from each biased location. The purpose ofthese samples is to resolve GWS anomalies, evaluate the appropriateness of the currentROI list, and verify the absence of additional ROI. [contingent]• CG w Sampling. Surface soil sampling may be conducted after the GWS to further clarifyresults, with the level and nature of sampling dependent on GWS results. If GWS resultsindicate no evidence of contamination impacts above background levels, no additionalsurface soil sampling will be required other than to address areas too wet to perform agamma walkover survey.oIf GWS results indicate contamination impacts above background levels but thatsurface soil contaminant levels exceeding CG w requirements are unlikely, thearea of interest will be systematically sampled using a triangular grid with adensity of one sample per 400 m 2 . One sample will be collected from eachlocation representative of a 0-15 cm depth interval. Locations will be selected toprovide systematic coverage of the area of interest. The purpose is to documentthe activity concentrations present in surface soils within WMA 9. [contingent]oIf GWS results indicate surface soil contaminant levels exceeding CG wrequirements likely exist, one sampling location will be selected at the highestgross activity level to confirm CG w exceedances and another set of samplinglocations will be identified to spatially bound the extent of contamination (i.e.,along the boundary of what is considered likely above CG w requirements) if thisis not obvious from the GWS data. Two samples will be collected from thelocation targeting high gross activity levels, one representative of a 0-15 cmRev. 1 H-7
WVDP Phase 1 CSAPdepth interval, and one representative of a 15 cm-1 m depth interval. One samplewill be collected from each location intended to laterally bound contamination,representative of a 0-15 cm depth interval. In addition, the location targeting highgross activity levels will have one down-hole gamma scan conducted at thecenter of the location with static measurements taken every 15 cm. Locations willbe selected so that each representative area does not overlap. The purpose is todocument CG w requirement exceedances and bound the lateral extent ofcontamination. [contingent]oIf GWS results indicate areas with surface soil contamination impacts but it isunclear whether CG w requirement exceedances are present, at most five samplinglocations will be selected that systematically cover the areas of interest. Onesample will be collected from each location representative of a 0-15 cm depthinterval. Locations will be selected to provide systematic coverage of the area ofinterest. The purpose is to resolve the question of whether CG w requirementexceedances exist for areas where GWS results are ambiguous. [contingent]oIf any 0-15 cm interval yields a sample result indicating a CG w requirementsexceedance and that sample location is not laterally bounded either by existingsampling locations with results less than CG w requirements or by GWS data thatclearly indicate contamination is not a concern, additional sampling locationswill be selected so that the contamination encountered is spatially bounded. Thepurpose is to laterally bound contamination that is above CG w requirements.[contingent]H.9.3 Subsurface Soil SamplingThe purpose of subsurface soil sampling within WMA 9 is to determine presence and verticalextent of contamination impacts above background levels.• If any 0-15 cm surface soil sample result indicates contamination impacts abovebackground levels and there was not a 15 cm-1 m sample collected from that location, a15 cm-1 m sample will be collected from that location following the protocols used forthe original 0-15 cm surface soil sample. In addition, each soil location will have oneRev. 1 H-8
WVDP Phase 1 CSAPdown-hole gamma scan conducted at the center of the location with static measurementstaken every 15 cm. [contingent]• If a surface soil sample indicates contamination impacts above background levels for the15 cm-1 m depth interval, an additional sample from a depth of 1-2 m will be collectedand analyzed from that location. This process will continue until the vertical extent ofcontamination above background is bounded. One down-hole gamma scan will beconducted from each soil location requiring deeper investigation with a static readingtaken every 15 cm vertically. The purpose of these samples is to define the vertical extentof contamination. [contingent]H.9.4 Drainage Feature SamplingWMA 9 contains three distinct drainage features. For drainage features within WMA 9, thesurface soil CG w requirements apply. Surface drainage feature sampling will be conducted todetermine ditch sediment contamination status relative to surface soil CG w requirements. Surfacedrainage features will be sampled as follows:• Samples representing a 0-15 cm depth interval will be collected from ditch sediments. InWMA 9, the three ditches have a combined length of approximately 420 m. Samples willbe systematic located using a random start, separated by 30 m. [required]• If any 0-15 cm sample result indicates contamination impacts above background levels, a15 cm-1 m sample will be collected from that location following the protocols used forthe original 0-15 cm sample. [contingent]• If a sample indicates contamination impacts above background levels for the 15 cm-1 mdepth interval, an additional sample from a depth of 1-2 m will be collected and analyzedfrom that location. This will be repeated, as necessary, until the vertical extent ofcontamination impact is bounded at that location. [contingent]H.9.5 Required <strong>Laboratory</strong> AnalysesAll samples will be submitted for analysis of all 18 ROI.Rev. 1 H-9
WVDP Phase 1 CSAPA select portion of the samples as described above will be analyzed for the additional12 radionuclides of potential interest. If these sample results indicate the presence of the one ormore of those radionuclides at levels of potential significance, then the balance of samples fromWMA 9 will also be analyzed for the additional radionuclides that were identified.Table H.2 summarizes the required sample numbers and the estimated number of contingencysamples for WMA 9.This sampling plan assumes that quick turn-around analyses are available for Sr-90 and Cs-137and that soil samples will be screened for Sr-90 and Cs-137 prior to being analyzed for thebalance of the ROI. Contingency sampling requirements as described above may be undertakenbased on these screening data.H.9.6 Decision-Making SummaryA summary of decision-making based on the WMA 9 data is as follows:• The WMA 9 surface soil area classification as contained in Figure H.15 will be adjustedbased on GWS results. These adjustments may affect sample number requirements andwill affect the placement of the initial round of soil sample locations.• Depending on the outcome of the 1 st round of hardstand soil sampling, additional soilsample locations will be selected to further laterally bound contamination extent.• If any 15 cm-1 m soil interval encounters contamination above background levels,additional deeper 1 m interval soil samples will be required for that location to determinevertical extent of contamination. If additional vertical samples are required, verticalsampling will continue until background conditions are observed.H.10 ReferencesDOE 2009. Phase I Decommissioning Plan for the West Valley Demonstration Project, Rev 2,prepared by Washington Safety Management Solutions, URS Washington Division,Science Applications International Corporation, prepared for DOE, December 2009.Rev. 1 H-10
WVDP Phase 1 CSAPDOE 2010. Final Environmental Impact Statement for Decommissioning and/or Long-TermStewardship at the West Valley Demonstration Project and Western New York NuclearService Center, Vol 1, DOE/EIS-0226, January 2010.Rev. 1 H-11
WVDP Phase 1 CSAPTable H.1 Historical Data AnalysesNuclide# of SurfaceSoilLocations# ofSubsurfaceSoilLocations# of SedimentLocationsAm-241 1 0 0C-14 0 0 0Cm-243 0 0 0Cm-244 0 0 0Cs-137 2 0 0I-129 0 0 0Np-237 0 0 0Pu-238 1 0 0Pu-239 1 0 0Pu-240 1 0 0Pu-241 1 0 0Sr-90 2 0 0Tc-99 0 0 0U-232 1 0 0U-233 1 0 0U-234 1 0 0U-235 1 0 0U-238 1 0 0Rev. 1 H-12
WVDP Phase 1 CSAPTable H.2 Sample Number EstimatesRequired Contingent TotalSystematic Sediment Samples 14 0 14(0-15 cm)Systematic Sediment Samples0 5 5(15 cm-1 m)Biased Surface Soil Samples0 6 6(0-15 cm)Biased Surface Soil Samples0 6 6(15 cm-1 m)Contingent Surface Soil0 20 20SamplesSystematic Subsurface Soil0 3 3Samples (1-m intervals)Biased Subsurface Soil0 4 4Samples (1-m intervals)Buried Infrastructure Soil0 0 0SamplesTotal: 14 44 58Rev. 1 H-13
WVDP Phase 1 CSAPEmpty Waste ContainerHardstandNDA RolloffHardstandContractor VehicleHardstandFigure H.1 WMA 9Rev. 1 H-14
WVDP Phase 1 CSAPFigure H.2 WMA 9 with TopographyRev. 1 H-15
WVDP Phase 1 CSAPFigure H.3 WMA 9 Aerial Photo from 1962Rev. 1 H-16
WVDP Phase 1 CSAPFigure H.4 WMA 9 Aerial Photo from 1966Rev. 1 H-17
WVDP Phase 1 CSAPFigure H.5 WMA 9 Aerial Photo from 1968Rev. 1 H-18
WVDP Phase 1 CSAPFigure H.6 WMA 9Aerial Photo from 1977Rev. 1 H-19
WVDP Phase 1 CSAPFigure H.7 WMA 9 Aerial Photo from 1984Rev. 1 H-20
WVDP Phase 1 CSAPFigure H.8 WMA 9 Aerial Photo from 1995Rev. 1 H-21
WVDP Phase 1 CSAPFigure H.9 WMA 9 Aerial Photo from 2007Rev. 1 H-22
WVDP Phase 1 CSAPFigure H.10 WMA 9 1982 Direct Gamma MeasurementsRev. 1 H-23
WVDP Phase 1 CSAPFigure H.11 WMA 9 1990-1991 Direct Gamma MeasurementsRev. 1 H-24
WVDP Phase 1 CSAPSS-17137Cs: 0.39 pCi/g90Sr: 0.17 pCi/gSS-19137Cs: 0.23 pCi/g90Sr: 0.15 pCi/gFigure H.12 WMA 9 1993 Surface Sampling ResultsRev. 1 H-25
WVDP Phase 1 CSAPFigure H.13 Historical Groundwater Sr-90 ResultsRev. 1 H-26
WVDP Phase 1 CSAPFigure H.14 Historical Groundwater Tritium ResultsRev. 1 H-27
WVDP Phase 1 CSAPFigure H.15 WMA 9 Surface Soil CSMRev. 1 H-28
WVDP Phase 1 CSAPAPPENDIX IWMA 10 PRE-REMEDIATION DATA COLLECTIONI.1 BackgroundWaste Management Area 10 (WMA 10) is approximately 30 acres in size and contains supportand service facilities (see Figures I.1 and I.2 for map).WMA 10 includes: (1) the Administration Building, (2) the Expanded <strong>Laboratory</strong>, (3) the NewWarehouse, (4) the Security Gatehouse, (5) the Meteorological Tower, (6) the Main Parking Lot,and (7) the South Parking Lot. In addition, concrete slabs and foundations from several removedstructures remain in place, along with the Former Waste Management Storage Area and varioushardstands. The descriptions below are taken from the Phase 1 DP, Section 3.1.2.Administration Building. The Administration Building is a single-story structure 130 feet longand 40 feet wide, 10 feet high at the eaves, and 11.7 feet high at the peak. The concrete base isnine inches thick. Construction materials include the concrete foundation, wood frame, metalsiding, and metal roofing. The Administration Building was built during the 1960s. Trailers wereadded beginning in 1982 and removed in 2005. An addition to the west side of the building wasadded during the early 1980s; the addition is approximately 94 feet long and 30 feet wide with aconcrete base six inches thick. The Administration Building will be removed to grade during thework to achieve the interim end state.Meteorological Tower. The Meteorological Tower is located south of the AdministrationBuilding. Constructed of steel, it stands approximately 200 feet high on a concrete foundation. Ithas three main support columns with interior trusses and is anchored with five support cables. Astand-by generator and electrical boxes rest on a concrete pad.Security Gatehouse and Fences. The main Security Gatehouse is located adjacent to theAdministration Building. It was constructed in 1963. The gatehouse is 34 feet long, 20 feet wide,and nine feet high at the edge of the roof. Construction materials include a concrete foundation,concrete block walls, a concrete slab floor, and a built-up roof with metal deck.Rev. 1 I-1
WVDP Phase 1 CSAPA steel security fence surrounds the WVDP, the SDA, and miscellaneous other locations,including parts of WMA 10. It is made of galvanized chain link with galvanized steel pipe posts,with a spacing of 10 feet. The fence is seven feet high with a total length of 4.7 miles. Threestrands of barbed wire are stretched across the top of the fence. Figure I.1 shows the location ofthe fence along the border of WMA 10.Expanded <strong>Laboratory</strong>. The Expanded <strong>Laboratory</strong> is located south of the AdministrationBuilding. It was constructed during the early 1990s. The laboratory is 92 feet long and 50 feetwide, and consists of eight one-story modular units supported by 72 concrete piers. It wasmanufactured from light wood framing, metal roofing, and siding. An addition, 20 feet wide and50 feet long on a concrete foundation wall, was built on the east side of the laboratory. Thisfacility will be removed to grade during the work to achieve the interim end state.New Warehouse. The New Warehouse was built during the 1980s and is located east of theAdministration Building. It is a pre-engineered steel building, 80 feet wide, 250 feet long, and21.5 feet high at the roof peak, resting on about 40 concrete piers and a poured concretefoundation wall. The concrete floor is underlain with a gravel base.Former Waste Management Storage Area. This area is a lay-down area associated with the NewWarehouse.Parking Lots and Roadways. Two parking lots are located off Rock Springs Road: the MainParking Lot and the South Parking Lot. The Main Parking Lot has a total paved surface area of180,000 square feet and is covered with asphalt underlain with gravel. The South Parking Lotwith approximately 80,000 square feet of parking area is also paved with asphalt. A guardrailapproximately 1,200 feet long borders the lot along its southern, eastern and western sides.Roadways are constructed of a stone sub-base approximately eight-inches thick, covered withasphalt approximately four-inches thick. The total area of pavement or gravel surface withinWMA 10 is approximately 11 acres.Buried Infrastructure. Storm drainage from WMA 10 is carried by underground storm sewerlines to discharge points outside the WMA 10 boundary. Buried utilities also provide a pathwayfor storm drainage.Rev. 1 I-2
WVDP Phase 1 CSAPI.2 Physical SettingWMA 10 is relatively flat. WMA 10 is bordered to the west by the WVDP premises fence line, tothe north by WMA 5, to the east by WMA 3, WMA 1, WMA 6, and WMA 9, and to the south bythe WVDP premises fence line. A significant portion of WMA 10’s surface area (11 acres) iscovered by concrete, asphalt, or gravel as part of roads, parking lots, and hardstands. There areonly a few structures with relatively small footprints within WMA 10. The balance of WMA 10 isvegetated. WMA 10 is divided into a portion that is on the North Plateau and a portion that is onthe South Plateau, with Erdman Brook the divider.A relatively small portion of WMA 10 in the north has surface drainage captured by a stormsewer system that directs it north and off-premises. The majority of surface drainage from WMA10 falls in Erdman Brook’s watershed and is captured by Erdman Brook, which passes west toeast through the center of WMA 10.The northern half of WMA 10 is underlain by the sand and gravel unit which overlies the LaveryTill. In general, groundwater in the sand and gravel unit flows to the northeast across the NorthPlateau although there probably is also localized discharge to Erdman Brook. The Lavery Till haslow permeability but groundwater does flow vertically downward through this unit recharging theunderlying Kent Recessional Sequence.The weathered Lavery Till is exposed at the surface in the southern half of WMA 10.Groundwater in the weathered Lavery Till flows to the northeast across the South Plateau withlikely discharge to Erdman Brook.The majority of WMA 10’s surface has been reworked since 1981.I.3 Area HistoryFigure I.3 shows WMA 10 in 1962, prior to site development. As can be seen in this photograph,much of the WMA 10 area was farmed and/or farmsteads. A public road passed north-souththrough the southeastern portion of WMA 10.Rev. 1 I-3
WVDP Phase 1 CSAPFigure I.4 shows WMA 10 in 1966, after construction of the Nuclear Fuel Services nuclear fuelreprocessing facility. The farmsteads had been removed, and the Administration Building andassociated parking lot were present in the northern portion of WMA 10. The road that hadoriginally passed through the southeastern portion of WMA 10 had been reworked.Figure I.5 shows WMA 10 in 1968.Figure I.6 shows WMA 10 in 1977. As can be seen in this photograph, there is no visual evidenceof significant landscape alterations since the 1966 aerial photograph.Figure I.7 shows WMA 10 in 1984, after establishment of the WVDP. Trailers had been added tothe Administration Building, along with some unpaved roadways and what appears to be somesurface reworking immediately south of the Administration Building.Figure I.8 shows WMA 10 in 1995. Almost the entire surface area of WMA 10 has been affectedby site activities.Figure I.9 shows WMA 10 in 2007. There has been additional surface reworking for portions ofWMA 10 since 1995.I.4 Known and Suspected ReleasesI.4.1Cesium ProngPotentially Affected Media:Potentially Affected WMAs:surface soil, subsurface soil, sediments1, 2, 3, 4, 5, 6, 10, 12 (northern portion)In 1968, a ventilation system filter in the Process Building (in WMA 1) failed, releasingcontaminated particulate up the Process Building stack. A mixture of radionuclides was released,with Cs-137 predominant. Approximately 0.33 Ci particulate gross beta radioactivity wasreleased. The contaminated particulate was deposited on surface soils, resulting in a large area ofcontamination around the Process Building and to the north-northwest. Detectable depositsextend several miles, including beyond the WVDP premises. WMAs 1, 2, 3, 4, 5, 6, 10, and 12Rev. 1 I-4
WVDP Phase 1 CSAP(northern portion) likely are affected. Because Cs-137 is predominant, this area of contaminationis known as “the cesium prong” (DOE 2009 Table 2-17, DOE 2010 Section 3.11.5).As originally deposited, surface soil activity concentrations should have decreased towards thenorth, away from WMA 1. However, the surface features of many areas within the WVDPpremises have been reworked significantly since the release; as a result, the current spatial anddepth distribution of soil contamination may be significantly different than the original footprint.In addition, the surface soil contamination likely has been naturally spread by erosion and runoffinto surface drainage features; this phenomenon may have enlarged the area impacted bydeposition, although detailed data regarding this effect are not available. (DOE 2010 Section3.11.5)Finally, other releases from the Process Building stack may have produced minor impacts. Theseother releases include the 1968 failure of a dissolver off-gas system filter, resulting in 0.28 Ci ofparticulate activity, and the 1968 failure of a vessel off-gas system filter, resulting in the March1968 releases to exceed the monthly allowance by 15 percent. (DOE 2010 Section 3.11.5)I.4.2Other Known and Suspected ReleasesThere are no known or suspected releases that originated within WMA 10.I.5 Existing DataExisting data sets for this area include:• In 1982, static direct exposure readings were collected across the WVDP premises(WVNSCO 1982). Most of WMA 10 was covered by these measurements on a 10-mgrid. Figure I.10 shows these results color-coded by the exposure readings encountered,with the data overlain on a 1977 aerial photograph. These data show very distinct spatialtrends associated with gross activity, ranging from near background or at backgroundconditions at the southern end of WMA 10 to significantly elevated activity levels in thenortheastern corner adjacent to the Process Building. These patterns may have beenassociated with patterns in surface soil contamination, or may have been associated withRev. 1 I-5
WVDP Phase 1 CSAPshine from facility buildings; however, they are patterns that are potentially indicative ofsoil contamination and are consistent with what would have been expected from airdeposition resulting from stack releases.• In 1990 and 1991, a second static direct exposure measurement program was conductedacross the WVDP premises (WVNSCO 1992). In the case of WMA 10, this effortprovided systematic coverage on a 10-m grid, with the exception of the northern portionof WMA 10. This data collection used different instrumentation/protocols than the 1982study, so the results are not quantitatively comparable. Figure I.11 shows these resultsoverlain on a 1984 aerial photograph. The patterns of gross activity values match thoseobserved in 1982.• There have been two soil sampling activities in WMA 10 (Figure I.12) that resulted insample results contained in ELIMS. In 1993, soil samples were collected from fourlocations; three locations were surface samples only and one location was sampled todepth. In 2008, three additional locations were sampled as part of a subsurfacebackground study; at each location, soil samples were retrieved from depths greater thanone meter. Table I.1 identifies the number of samples analyzed for each of the 18 primaryradionuclides of interest (ROI) from these two sampling programs. The 1993 samplingprogram only included Am-241, Cs-137, Sr-90, the plutonium isotopes, and the uraniumisotopes. The 2008 background sampling program addressed all 18 ROI. Neithersampling program collected surface samples from the northeastern portion of WMA 10,which is the portion most likely affected by contamination.All Cs-137 results were less than one pCi/g and all Sr-90 results were non-detects. Theseresults are not surprising because surface samples were not collected in areas most likelyto have been impacted by site activities. Of the four subsurface cores (one from 1993 andthree from the 2008 background study), one sample from a depth of 5 to 7 feet fromGPBG0408 reported elevated gross beta and tritium concentrations above backgroundconditions. While these values were not high, they were indicative of impacts. Tritium isthe most mobile site contaminant, and while not one of the 18 ROI, tritium does serve asa marker of subsurface site impacts. GPBG0408 is immediately adjacent to WMA 6,along the eastern edge of WMA 10.Rev. 1 I-6
WVDP Phase 1 CSAP• There were eleven groundwater sampling locations on the perimeter of WMA 10,including three along its boundary with WMA 1, that have historical sample results inELIMS. Figure I.13 shows Sr-90 results from these programs with locations color-codedby whether activity concentrations were ever observed greater than 10 pCi/L. Figure I.14shows the same type of map for tritium, with locations color-coded by whether activityconcentrations were ever observed greater than 500 pCi/L. The detection limits for Sr-90and tritium varied widely among ELIMS samples. 10 pCi/L and 500 pCi/L were selectedas thresholds for Sr-90 and tritium, respectively, because based on ELIMS data resultsabove these activity concentrations were consistently above method detection limits andso indicative of contamination impacts rather than simply measurement error. There wassome evidence of groundwater impacts along the boundary with WMA 1.I.6 Planned Phase 1 DP ActivitiesA number of existing structures will be removed down to their slabs either prior to Phase 1 DPactivities or as part of the Phase 1 activities (DOE 2009 Sections 3.1 and 7.10).These include:• the New Warehouse• the Vitrification Cold Lab and Expanded ELAB along with adjacent supporting structures• the former Waste Management Area• the Administration Building• the Changing Facility• the Vit Hill trailers and adjacent supporting facilities, and• the Diesel Fuel BuildingThese buildings were not impacted by on-site activities and are not expected to be contaminated.As part of the slab removal process, the top 2 feet of soil are expected to be removed along withthe slabs.Phase 1 will not address the Meteorological Tower and the Security Gatehouse.Rev. 1 I-7
WVDP Phase 1 CSAPI.7 <strong>Conceptual</strong> <strong>Site</strong> <strong>Model</strong>None of the buildings within the WMA 10 boundary are believed to have been impacted byradioactive contamination. Soil surfaces that were exposed at the time of the 1968 airbornereleases would have been impacted to some degree. The majority of WMA 10 was exposed soilsurface at that time. Since then there has been significant reworking of WMA 10 surface soils,including paving activities. Consequently, there is the potential for surface soil contaminationabove background conditions for exposed soils, and also the possibility of contamination beneathexisting pavement and clean fill material. The highest concentrations would likely be along thenortheastern edge of WMA 10 along WMA 1, closest to the original 1968 airborne releases, andin the footprint of surface drainage features present within WMA 10.The only structure present in 1968 was the Administration Building and the Security Gatehouse.There is the possibility of contaminated soils underneath building foundations built after 1968.The most likely facilities where this would be the case are the New Warehouse, the formerContractor Fabrication Shop, and the Vit Hill trailer pads, whose footprints fall within elevatedgross activity identified by the 1982 direct gamma survey.There also is the possibility of low level contamination associated with storm water sewerspresent in WMA 10 at depths greater than 1 m. This contamination may have been introducedwhen the present storm water configuration was installed due to the use of contaminated soils asbackfill material, and/or from leakage from the system. If contaminated fill material is present, itis most likely to be associated with the northernmost portion (within WMA 10) of the stormsewer system since this is where historical surface soil contamination would have been thegreatest.Finally, one background soil core within WMA 10 along its border with WMA 6 encounteredelevated tritium in soils at a depth of 5 to 7 feet. This is most likely due to subsurfacecontamination extending from WMA 6. The soil core location was approximately 55 msouth/southwest of the current sewage treatment facility.Rev. 1 I-8
WVDP Phase 1 CSAPFigure I.15 shows the current <strong>Conceptual</strong> <strong>Site</strong> <strong>Model</strong> (CSM) for WMA 10 surface soils. Asdepicted on the figure, soil contamination, if it exists, is most likely to be found in thenortheastern portion of WMA 10.I.8 WMA 10-Specific Characterization Goals• Evaluate Appropriateness of the Current List of Radionuclides of Interest (ROI)• Explore the Possibility of Surrogate ROI• Determine Extent of Surface Contamination• Develop an Inventory of Buried Infrastructure• Identify the Presence/Absence of Subsurface Soil Contamination• Identify Soil Waste Stream Characteristics• Establish <strong>Site</strong>-Specific Performance for On-<strong>Site</strong> and Field-Based Analytical Methods• Obtain Data to Support Phase 2 PlanningI.9 CSAP Pre-Remediation Data Collection and Associated Decision-MakingCSAP pre-remediation data collection will consist of a number of components described in moredetail below.I.9.1Buried InfrastructureThe footprint of buried infrastructure will be identified and mapped. Buried infrastructure ofparticular interest for WMA 10 is infrastructure that would have been installed after 1968, and sopotentially might have involved the use of contaminated soils as backfill. An example is thecurrent storm water sewer system. [required]I.9.2Gamma Walkover Survey DataThe purpose of performing a gamma walkover survey of the WMA 10 area is to identify the leveland extent of surface contamination. This includes both general trends in average activityconcentrations pertinent to the CG w requirement, as well as the identification of isolated, moreelevatedanomalies that might be indicative of discrete releases and/or CG emc concerns.Rev. 1 I-9
WVDP Phase 1 CSAPA complete (100%) logged gamma walkover survey (GWS) will be conducted for accessibleareas within WMA 10 including paved areas. Examples of areas that would not be accessible areareas where standing water is present in wetlands or ponds and the footprints of existingbuildings. Based on the GWS results, surface soil areas within WMA 10 will be divided into fourcategories: (1) surface soils where GWS data indicate contamination above CG w requirements;(2) surface soils where GWS data indicate contamination, but it is not clear if contaminationexceeds surface soil CG w requirement; (3) surface soils where GWS indicate impacts, but thoseimpacts are not expected to exceed surface soil CG w standards; and (4) surface soils where thereis no indication of impacts above background conditions. The purpose of this data collection is toprovide insights into the spatial distribution of surface contamination, and to guide subsequentsoil sampling. [required]I.9.3Surface Soil SamplingSurface soil sampling will be used to address areas inaccessible to GWS data collection, toresolve hot spots identified by the GWS data, and to evaluate the presence, absence, and/or extentof surface contamination above CG w requirements based on GWS results.• Wetlands. It is possible that standing water will be present in wetlands that prevent GWSdata collection from those areas. Consequently, soil sampling will be required for wetlandfootprints and for any other areas where standing water prevents the collection of GWSdata.For every area where standing water or saturated soil conditions prevent GWS datacollection, systematic soil sampling will take place. For wetland areas less than 200 m 2 insize, one sample will be collected. For areas between 200 and 1,000 m 2 in size, onesample per 200 m 2 will be collected. For areas between 1,000 and 2,500 m 2 in size, fivesamples will be collected. For areas exceeding 2,500 m 2 in size, at minimum one samplewill be collected per 500-m 2 area. One sample will be collected from each locationrepresentative of a 0-15 cm depth interval. In the case where an area has more than onelocation, locations will be selected to provide systematic coverage of the area of interest.[contingent]Rev. 1 I-10
WVDP Phase 1 CSAP• Hot Spots. If GWS data indicate the presence of contamination that possibly exceeds“hot spot” (CG emc ) standards or an isolated elevated area is identified that appearsindicative of a discrete release, the location of concern will be sampled with a biasedsample. If biased samples are collected from a particular location, they will be collectedfrom two depth intervals: 0-15 cm, and 15 cm-1 m. The 0-15 cm samples will beanalyzed for the 12 radionuclides of potential interest in addition to the 18 ROI. Onedown-hole gamma scan will be conducted from each biased location. The purpose ofthese samples is to resolve GWS anomalies, evaluate the appropriateness of the currentROI list, and verify the absence of additional ROI. [contingent]• CG w Sampling. Surface soil sampling may be conducted after the GWS to further clarifyresults, with the level and nature of sampling dependent on GWS results. If GWS resultsindicate no evidence of contamination impacts above background levels, no additionalsurface soil sampling will be required other than to address areas too wet to perform agamma walkover survey.oIf GWS results indicate contamination impacts above background levels but thatsurface soil contaminant levels exceeding CG w requirements are unlikely, thearea of interest will be systematically sampled using a triangular grid with adensity of one sample per 400 m 2 . One sample will be collected from eachlocation representative of a 0-15 cm depth interval. Locations will be selected toprovide systematic coverage of the area of interest. The purpose is to documentthe activity concentrations present in surface soils within WMA 10. [contingent]oIf GWS results indicate surface soil contaminant levels exceeding CG wrequirements likely exist, one sampling location will be selected at the highestgross activity level to confirm CG w exceedances and another set of samplinglocations will be identified to spatially bound the extent of contamination (i.e.,along the boundary of what is considered likely above CG w requirements) if thisis not obvious from the GWS data. Two samples will be collected from thelocation targeting high gross activity levels, one representative of a 0-15 cmdepth interval, and one representative of a 15 cm-1 m depth interval. One samplewill be collected from each location intended to laterally bound contamination,representative of a 0-15 cm depth interval. In addition, the location targeting highRev. 1 I-11
WVDP Phase 1 CSAPgross activity levels will have one down-hole gamma scan conducted at thecenter of the location with static measurements taken every 15 cm. Locations willbe selected so that each representative area does not overlap. The purpose is todocument CG w requirement exceedances and bound the lateral extent ofcontamination. [contingent]oIf GWS results indicate areas with surface soil contamination impacts but it isunclear whether CG w requirement exceedances are present, at most five samplinglocations will be selected that systematically cover the areas of interest. Onesample will be collected from each location representative of a 0-15 cm depthinterval. Locations will be selected to provide systematic coverage of the area ofinterest. The purpose is to resolve the question of whether CG w requirementexceedances exist for areas where GWS results are ambiguous. [contingent]oIf any 0-15 cm interval yields a sample result indicating a CG w requirementsexceedance and that sample location is not laterally bounded either by existingsampling locations with results less than CG w requirements or by GWS data thatclearly indicate contamination is not a concern, additional sampling locationswill be selected so that the contamination encountered is spatially bounded. Thepurpose is to laterally bound contamination that is above CG w requirements.[contingent]oIf there are areas present where historical WVDP activities resulted in significantreworking or cover of original soils such that GWS data collection might noteffectively identify the presence of surface soil contamination, systematicsampling will take place. For these areas, sampling locations will besystematically located on a 20 m triangular grid. Two samples will be collectedper location, one representative of the 0-15 cm interval and one representative ofthe 15cm – 1m interval. This will not apply to hardstand areas; soils beneathhardstands will be characterized after hardstands are removed. [contingent]I.9.4Subsurface Soil SamplingRev. 1 I-12
WVDP Phase 1 CSAPThe purpose of subsurface soil sampling within WMA 10 is to determine presence and verticalextent of contamination impacts above background levels.• If any 0-15 cm surface soil sample result indicates contamination impacts abovebackground levels and there was not a 15 cm-1 m sample collected from that location, a15 cm-1 m sample will be collected from that location following the protocols used forthe original 0-15 cm surface soil sample. In addition, each soil location will have onedown-hole gamma scan conducted at the center of the location with static measurementstaken every 15 cm. [contingent]• If a surface soil sample indicates contamination impacts above background levels for the15 cm-1 m depth interval, an additional sample from a depth of 1-2 m will be collectedand analyzed from that location. This process will continue until the vertical extent ofcontamination above background is bounded. One down-hole gamma scan will beconducted from each soil location requiring deeper investigation with a static readingtaken every 15 cm vertically. The purpose of these samples is to define the vertical extentof contamination. [contingent]I.9.5Drainage Feature SamplingPortions of WMA 10 include surface drainage features (i.e., ditches). For drainage features withinWMA 10, the surface soil CG w requirements apply. Surface drainage feature sampling will beconducted to determine ditch sediment contamination status relative to surface soil CGrequirements. Surface drainage features will be sampled as follows:• Samples representing a 0-15 cm depth interval will be collected from ditch sediments forthose ditches that have potential contamination concerns. In the case of WMA 10, this isabout a 90 m stretch of Erdman Brook extending from the WAM 6 boundary westward towhere the brook bifurcates into two feeder streams. Samples will be systematic locatedusing a random start, separated by 30 m. [required]• If any 0-15 cm sample result indicates contamination impacts above background levels, a15 cm-1 m sample will be collected from that location following the protocols used forthe original 0-15 cm sample. [contingent]Rev. 1 I-13
WVDP Phase 1 CSAP• If a sample indicates contamination impacts above background levels for the 15 cm-1 mdepth interval, an additional sample from a depth of 1-2 m will be collected and analyzedfrom that location. This will be repeated, as necessary, until the vertical extent ofcontamination impact is bounded at that location. [contingent]• If the eastern-most ditch sampling point indicates contamination above the surface soilCG w requirement, systematic sampling will continue eastward following the ditch with a30 m spacing until results are below the surface soil CG w .I.9.6Buried Infrastructure Soil SamplingSoils associated with buried infrastructure within WMA 10 will be sampled to determine theircontamination status.• For a minimum of five selected locations along the main storm sewer line within WMA10, excavation will take place to expose the line. These locations will be selected tomaximize the possibility that contamination will be encountered (e.g., locations wherehistorical or current GWS data indicate surface contamination exists). During excavation,exposed soils will be monitored by scans for evidence of elevated gross activity. Thepurpose of this sampling is to evaluate the presence of contamination associated withburied infrastructure. [required]oIf elevated readings are encountered below a depth of 1 m, soils exhibiting thehighest levels of gross activity will be sampled and analyzed.oIf elevated readings are not encountered below a depth of 1 m, a samplerepresentative of soils deeper than 1 m but above the storm sewer line will beobtained.• If contamination above background conditions is encountered at any selected location,trenching will continue to depth until background conditions are observed. An additionalsample will be collected from the base of the trench to verify background conditions. Thepurpose is to vertically bound observed contamination. [contingent]Rev. 1 I-14
WVDP Phase 1 CSAP• For any additional buried infrastructure of potential concern that is identified, a minimumof at least one soil sample from at least one biased location will collected following theprotocols described for the main storm sewer line for each buried infrastructure lineidentified that is of potential concern. Infrastructure of potential concern is infrastructurethat either carried waste or was installed after 1968. Examples of the type of additionalburied infrastructure that might be encountered are water supply lines, gas lines, electricallines, telecommunication lines, etc. The purpose of this sampling is to evaluate thepresence of contamination associated with buried infrastructure. [contingent]• If buried infrastructure soil sampling identifies contamination impacts greater thanbackground, biased sampling will continue following the line away from the WMA 1, 3,and 5, until at least two consecutive locations yield soil samples below surface soil CG wrequirements. Location spacing will be based on engineering judgment, including thegeometry of the line, the distance from WMA 1, 3, and 5, the level of contaminationencountered, and surface evidence of contamination. The purpose of this sampling is tobound the extent of contamination associated with buried infrastructure, as necessary.[contingent]I.9.7Additional ContingenciesSampling and/or GWS data may indicate that contamination exists or extends beneath surfacescurrently covered by existing structures, concrete, asphalt, or gravel. In this case, “surface soil”will be defined as soil immediately beneath the cover. If sampling or GWS data indicate thatcontamination may exist beneath existing structures (e.g., the Administration Building, SecurityGatehouse, or hardstand areas), then sampling locations will be offset along thefoundation/hardstand edge to determine contamination extent. The purpose of the offset is toallow safe acquisition of data. Data collection through the floors of existing buildings or throughhardstands in WMA 10 will not be required as part of this effort.WMA 10 abuts up to several other areas that have the potential for subsurface soil contaminationconcern at depths greater than one meter (e.g., WMA 1). Sampling efforts associated with thoseareas may result in soil core collection that extends into WMA 10 as necessary.Rev. 1 I-15
WVDP Phase 1 CSAPI.9.8Required <strong>Laboratory</strong> AnalysesAll samples will be submitted for analysis of all 18 ROI.A select portion of the samples as described above will be analyzed for the additional12 radionuclides of potential interest. If these sample results indicate the presence of the one ormore of those radionuclides at levels of potential significance, then the balance of samples fromWMA 10 will also be analyzed for the additional radionuclides that were identified.Table I.2 summarizes the required sample numbers and the estimated number of contingencysamples for WMA 10.This sampling plan assumes that quick turn-around analyses are available for Sr-90 and Cs-137and that soil samples will be screened for Sr-90 and Cs-137 prior to being analyzed for thebalance of the ROI. Contingency sampling requirements as described above may be undertakenbased on these screening data.I.9.9Decision-Making SummaryA summary of decision-making based on the WMA 10 data is as follows:• If buried infrastructure of concern is identified (in addition to the main storm sewer line),then biased locations will be selected, excavation conducted to expose the line, and atleast one biased sampled collected. If contamination is encountered above surface soilCG w requirements, sampling will continue along these lines until it is bounded.• Backfill associated with the main storm sewer line will be sampled. If contamination isencountered above surface soil CG w requirements, sampling will continue along the mainline until contamination is bounded.• The WMA 10 surface soil area classification as contained in Figure I.15 will be adjustedbased on GWS results. These adjustments may affect systematic sample numberrequirements and will affect the placement of the initial round of systematic samplelocations.Rev. 1 I-16
WVDP Phase 1 CSAP• Depending on the outcome of the first round of systematic soil sampling, additionalsystematic soil sample locations will be selected to further laterally bound contaminationextent.• If contamination above background levels is encountered in any 15 cm-1 m soil interval,additional deeper 1-m interval soil samples will be required for that location to determinevertical extent of contamination. If additional vertical samples are required, verticalsampling will continue until background conditions are observed.I.10 ReferencesDOE 2009. Phase I Decommissioning Plan for the West Valley Demonstration Project, Rev 2,prepared by Washington Safety Management Solutions, URS Washington Division,Science Applications International Corporation, prepared for DOE, December 2009.DOE 2010. Final Environmental Impact Statement for Decommissioning and/or Long-TermStewardship at the West Valley Demonstration Project and Western New York NuclearService Center, Vol 1, DOE/EIS-0226, January 2010.Rev. 1 I-17
WVDP Phase 1 CSAPTable I.1 Historical Data AnalysesNuclide# of SurfaceSoilLocations# ofSubsurfaceSoilLocations# of SedimentLocationsAm-241 3 4 0C-14 0 3 0Cm-243 0 3 0Cm-244 0 3 0Cs-137 4 4 0I-129 0 3 0Np-237 0 3 0Pu-238 3 4 0Pu-239 3 4 0Pu-240 3 4 0Pu-241 3 4 0Sr-90 4 4 0Tc-99 0 3 0U-232 3 4 0U-233 3 4 0U-234 3 4 0U-235 3 4 0U-238 3 4 0Rev. 1 I-18
WVDP Phase 1 CSAPTable I.2 Sample Number EstimatesRequired Contingent TotalSystematic Sediment Samples3 3 6(0-15 cm)Systematic Sediment Samples0 2 2(15 cm-1 m)Biased Surface Soil Samples0 6 6(0-15 cm)Biased Surface Soil Samples0 6 6(15 cm-1 m)Contingent Surface Soil0 20 20SamplesSystematic Subsurface Soil0 5 5Samples (1-m intervals)Biased Subsurface Soil0 3 3Samples (1-m intervals)Buried Infrastructure Soil5 6 11SamplesTotal: 8 51 59Rev. 1 I-19
WVDP Phase 1 CSAPContractor Fab ShopDiesel Fuel BldgVit Hill FacilitiesGatehouseChanging FacilityAdmin BuildingVit Cold LabNew WarehouseExpanded ELABConstruction HardstandVitrification HardstandMet TowerFigure I.1 WMA 10 (adapted from Phase 1 DP, Figure 3-43)Rev. 1 I-20
WVDP Phase 1 CSAPFigure I.2 WMA 10 with TopographyRev. 1 I-21
WVDP Phase 1 CSAPFigure I.3 WMA 10 Aerial Photograph from 1962Rev. 1 I-22
WVDP Phase 1 CSAPFigure I.4 WMA 10 Aerial Photograph from 1966Rev. 1 I-23
WVDP Phase 1 CSAPFigure I.5 WMA 10 Aerial Photograph from 1968Rev. 1 I-24
WVDP Phase 1 CSAPFigure I.6 WMA 10 Aerial Photograph from 1977Rev. 1 I-25
WVDP Phase 1 CSAPFigure I.7 WMA 10 Aerial Photograph from 1984Rev. 1 I-26
WVDP Phase 1 CSAPFigure I.8 WMA 10 Aerial Photograph from 1995Rev. 1 I-27
WVDP Phase 1 CSAPFigure I.9 WMA 10 Aerial Photograph from 2007Rev. 1 I-28
WVDP Phase 1 CSAPFigure I.10 WMA 10 1982 Direct Gamma Measurement SurveyRev. 1 I-29
WVDP Phase 1 CSAPFigure I.11 WMA 10 1990-1991 Direct Gamma Measurement SurveyRev. 1 I-30
WVDP Phase 1 CSAPSurface Sampling LocationsSoil Core LocationsFigure I.12 WMA 10 Soil Sampling LocationsRev. 1 I-31
WVDP Phase 1 CSAPFigure I.13 WMA 10 Sr-90 Groundwater ResultsRev. 1 I-32
WVDP Phase 1 CSAPFigure I.14 WMA 10 Tritium Groundwater ResultsRev. 1 I-33
WVDP Phase 1 CSAPFigure I.15 Initial WMA 10 Surface Soil CSMRev. 1 I-34
WVDP Phase 1 CSAPAPPENDIX JWMA 12 (SOUTHERN PORTION) PRE-REMEDIATION DATA COLLECTIONJ.1 BackgroundThe southern portion of Waste Management Area 12 (WMA 12 South) is approximately 42 acresin size. Along with the northern portion of Waste Management Area 12, it contains the balance ofthe WVDP premises not included in one of the other WMAs (see Figure J.1 for map).J.2 Physical SettingWMA 12 South is primarily located on the South Plateau. It is bounded to the east by the WVDPfence line, to the north by WMA 2, to the west by WMA 6, and to the south by WMA 7, WMA 8,and the WVDP fence line.WMA 12 South is vegetated. Its primary topographical features are associated with ErdmanBrook and Franks Creek. Both streams incise fairly deep gullies into the land surface, and are fedby intermittent drainage features scattered across WMA 12 South. Erdman Brook and FranksCreek are two of the primary drainage features within the WVDP premises.The WMA 12 South area is underlain by the weathered and unweathered Lavery Till. Theweathered Lavery Till allows some groundwater movement. The unweathered Lavery Till is animpermeable unit. The two streambeds are incised into the Lavery Till. Groundwater within theweathered Lavery Till predominately discharges to the two streams. Within the unweatheredLavery Till there is a layer known as the Kent Recessional Series that is more permeable and thatdoes transport groundwater. Groundwater within the Kent Recessional Series, in general, movesto the east/northeast.WMA 12 South has a few man-made features. A buried natural gas line services the West ValleyDemonstration Project. The line crosses Frank’s Creek on the east side of the SDA, then crossesErdman Brook just north of the SDA, and continues across WMA 12 to WMA 1. An activelyused, buried leachate transfer line is used to transfer leachate from the NDA interceptor trench(WMA 7) to the Liquid Waste Treatment Facility (WMA 2). The transfer line crosses ErdmanRev. 1 J-1
WVDP Phase 1 CSAPBrook northwest of the NDA and continues in a northerly direction to WMA 2. In 2009,NYSERDA and DOE completed erosion mitigation work on Erdman Brook and part of LagoonRoad Creek, just to the northwest of the NDA and SDA. The work included the realignment ofthe stream channel, grading of a knickpoint, lining the new channel with geotextile and placingmedium stone fill on top. The work was necessary to keep surface water flow in a central channelto ensure continued stability of the North Slope of the SDA.Aside from these features, WMA12 has been relatively undisturbed by Nuclear Fuel Services(NFS), NYSERDA, or WVDP activities.J.3 Area HistoryWMA 12 South was not used for any structural purposes during the lifespan of the NFS andWVDP activities; however, WMA 12 South supported NFS and WVDP operations. Both NFSand the WVDP discharged untreated (pre-1971) and treated (post-1971) low-level wastewater toErdman Brook and Franks Creek in WMA 12 South.Figure J.2 shows WMA 12 South in 1962 prior to site development. At this time a significantfraction of WMA 12 South was wooded, with the balance appearing to have been farmed.Figure J.3 shows WMA 12 South in 1966. At this stage the adjacent WMA 2 lagoons wereactively being used. A soils push-out area is visible that extends from WMA 2 into WMA 12South. This push-out area is of significance because it corresponds to elevated direct gammareadings collected in 1990-1991.Figure J.4 shows a 2007 aerial photo of the WMA 12 South area. The push-out area is still visibleas a grass-covered area adjacent to WMA 2.J.4 Known and Suspected ReleasesJ.4.1Drainage Feature Contamination by Deposition / RunoffPotentially Affected Media:Potentially Affected WMAs:subsurface soils, surface water, sediment1, 6, 7, 12 (southern portion) (Erdman Brook)Rev. 1 J-2
WVDP Phase 1 CSAPDrainage features within WMA 12 South (including the streambeds and banks of Erdman Brookand Franks Creek) potentially would have been affected by the deposition of radionuclidecontamination from surface water sediment transport mechanisms.On the east side of WMA 12 South, it is known that historical activities in WMA 7 resulted incontaminated soils being displaced into drainage features that crossed into WMA 12 South.Other releases of significance include: (a) releases of elevated gross beta and Sr-90 through thepermitted sanitary outfall into Erdman Brook during 1970 through 1972, when a sewer line nearTank 7D-13 (in WMA 1) failed and allowed contaminated groundwater to enter the line and bedischarged through the outfall (WVDP-220; DOE 2010 Section 3.11.5); (b) discharges of trenchleachate from the SDA (WMA 8) before LLWTF operation began in 1972, as described in NFSquarterly reports; and (c) surface water runoff from the NDA (WMA 7) and SDA (WMA 8) overthe years.J.4.2Soil ContaminationPotentially Affected Media:Potentially Affected WMAs:surface soil, subsurface soil, sediments2, 12 (southern portion)There is evidence that contaminated soils/sediments from WMA 2 may have been pushed byconstruction or maintenance activities into WMA 12 South at some point in the past based onhistorical direct gamma readings and historical air photographs.J.4.3Wastewater Treatment OperationsPotentially Affected Media:Potentially Affected WMAs:surface soil, subsurface soil, groundwater, sediments2, 12 (southern portion) (Erdman Brook)Operational units used to treat radioactive wastewater are present in WMA 2. The design of someof these units allowed contaminated water to discharge to surface water in WMA 12 South(Erdman Brook) as part of standard operation. In particular:Rev. 1 J-3
WVDP Phase 1 CSAP• Lagoon 3 (in WMA 2) periodically has discharged effluent to Erdman Brook through theLagoon 3 permitted outfall. Of particular historical note were the relatively large releases thattook place during NFS operations, such as in 1969 when 108 curies of gross beta activitywere released (WVDP-EIS-006). Small amounts of permitted activity continue to bereleased into Erdman Brook through batch releases from Lagoon 3.J.4.4Sewage Treatment System ContaminationPotentially Affected Media:Potentially Affected WMAs:subsurface soil, groundwater, sediment1, 6, 12 (southern portion) (Erdman Brook)Historically, the Process Building (in WMA 1) was connected to the Old Sewage Treatment Plant(in WMA 6) via an underground wastewater line. A 1970 to 1971 investigation of unexpectedtritium and gross beta contamination in Erdman Brook led to the discovery of contamination inthe sanitary sewer system. It was discovered that the underground wastewater line had failed nearthe southwest side of the Process Building. The resultant leak allowed contaminated groundwaterin the area to enter the Old Sewage Treatment Plant. An estimated 0.5 Ci gross beta and 0.05 Ciof Sr-90 was released. The Old Sewage Treatment Plant and its outfall drainage werecontaminated to 1 mR/h, with effluent concentrations subsiding after the leak was repaired.Affected outfalls were located in WMA 6 with eventual discharge to Erdman Brook (in WMA 12South) (DOE 2009 Table 2-17; DOE 2010 Section 3.11.5).In addition, during the 1960s and 1970s, the Old Sewage Treatment Plant experienced severalcontamination events, some of which were expressed as radioactivity increases in the treatedeffluent. The Old Sewage Treatment Plant outfall drainage extends approximately 650 feet southof a culvert near the Old Warehouse (also in WMA 6), and flows into the first culvert under therailroad tracks on the South Plateau (in WMA 6), and then to Erdman Brook (in WMA 6 andWMA 12 South). Actions were taken to find and repair a suspected sewage line leak, but whenthe line near the south side of the Process Building was excavated, radiation levels from soilcontamination hampered the project.J.5 Existing DataExisting data sets for this area include:Rev. 1 J-4
WVDP Phase 1 CSAP• In 1982 static direct exposure readings were collected across the WVDP premises.Within WMA 12 South these focused on Erdman Brook and Franks Creek(WVNSCO 1982). Figure J.5 shows these results color-coded by the exposure readingsencountered. These data show very distinct spatial trends associated with gross activityimpacts in surface soils/sediments, ranging from near background or at backgroundconditions at the eastern end of Franks Creek to significantly elevated activity levels inErdman Brook alongside and downstream of WMA 2 and its lagoons.• In 1990 and 1991 a second static direct exposure measurement program was conductedacross the WVDP premises (WVNSCO 1992). In the case of WMA 12 South, this effortprovided systematic coverage of its area on a 10-m grid. Unlike the 1982 program, thisdata collection did not target the streambeds specifically and it used differentinstrumentation/protocols than the 1982 study, so the results are not quantitativelycomparable. However, the 1990-1991 data collection effort did provide insights intosurface soil contamination across the WMA 12 South area (Figure J.6). Surface soilimpacts are evident in soils along the western portion of WMA 12 South. These impactsappear to fade to background conditions towards the eastern side of WMA 12 South.• There have been several soil/sediment sampling activities in WMA 12 South resulting indatasets contained in ELIMS. Environmental monitoring via soil/sediment sampling hastaken place since 1991 to the present at location SNSP0006. In 1993, sediment samplesfrom Erdman Brook and Franks Creek were collected (ST series locations in Figure J.7),as well as a handful of surface soil samples along the perimeter of WMA 12 South (SSseries locations in Figure J.7). Table J.1 identifies the number of samples analyzed foreach of the 18 primary radionuclides of interest (ROI). As is clear from Table J.1, themajority of sample results pertain to Cs-137 and Sr-90, with very little coverage for someof the other ROI. Figure J.8 shows the locations of subsurface soil cores in the vicinity ofWMA 12 South; as is clear from this figure, very little subsurface data exists that ispertinent to WMA 12 South. The spatial distribution of surface Cs-137 as identified byhistorical samples is shown in Figure J.9. Figure J.10 shows the Sr-90 results for thesesame samples.Rev. 1 J-5
WVDP Phase 1 CSAPThe limited Cs-137 data that are available are, in general, consistent with the historicaldirect reading data for this area. The same spatial pattern observed in direct readings forErdman Brook is replicated in sediment samples, with the highest Cs-137 activityconcentrations occurring at the northern fence line and coincident with the highest directreadings. Erdman Brook sediment Cs-137 activity concentrations drop as one moves upthe stream channel, mirroring the direct exposure readings.• A hot spot was identified in 1990 about 75 feet below the confluence of Erdman Brookand Franks Creek. As described in the footnote on page 4-49 of the Phase 1 DP, in 1990,a sample from a hot spot in Erdman Brook that measured 3000 μR/h during the groundlevelsurvey showed 0.01 μCi/g (10,000 pCi/g) Cs-137. This was a screening analysisthat may have been performed on a wet sample; it was not validated. This area oflocalized contamination was described as about six inches by six inches located onemeter from the edge of the water. Limited investigation indicated that the contaminationextended more than seven inches below the streambed surface (WVDP-EIS-007,Appendix C).• There are sixteen historical groundwater sampling locations within WMA 12 South(Figure J.11) that have historical sample results within ELIMS. These include eight alongthe WMA 2 border on the north side of WMA 12 South, and another six along the WMA7/WMA 8 border on the south side of WMA 12 South. The detection limits for Sr-90 andtritium varied widely among ELIMS samples. 10 pCi/L and 500 pCi/L were selected asthresholds for Sr-90 and tritium, respectively, because based on ELIMS data resultsabove these activity concentrations were consistently above method detection limits andso indicative of contamination impacts rather than simply measurement error.All of the shallow groundwater sampling locations along the WMA 2 boundary showtritium impacts, and most show low levels of Sr-90 as well (although not all wereanalyzed for Sr-90). In general, Sr-90 activity concentrations increase as one moves eastalong the border. Likely sources of this contamination are the lagoons and the NorthPlateau Groundwater Plume. Along the southern boundary, one well, WNNDADR, hadelevated Sr-90 impacts. Shallow groundwater movement within WMA 12 South is likelycontrolled by surface topography and Franks Creek and Erdman Brook. In general oneRev. 1 J-6
WVDP Phase 1 CSAPwould expect groundwater to move from the northern and southern boundaries towardsthe center of the WMA, and from west to east.J.6 Planned Phase 1 DP ActivitiesThere are no planned Phase 1 decommissioning activities for WMA 12 South.J.7 <strong>Conceptual</strong> <strong>Site</strong> <strong>Model</strong>Based on the available information, the conceptual site model (CSM) for WMA 12 South is asfollows. No environmental releases of contamination within WMA 12 South are believed to haveoccurred. However, environmental media within WMA 12 South have been affected to somedegree by releases elsewhere at the WVDP site. This has resulted in surface soil contaminationfor at least portions of WMA 12 South (as evidenced by historical direct gamma surveys andlimited soil samples), potential subsurface contamination along the northeastern boundary ofWMA 12 South along WMA 2, and also in more significant streambed sediment contaminationresulting in releases of contaminated water from the Lagoon 3 discharge weir. In the case of thelatter, Erdman Brook has the bulk of these impacts. The impacts increase as one movesdownstream to the WVDP fence line, likely due to historical releases from WMA 2.Contamination in stream sediments is significant enough that eastern portions of Erdman Brookhave been designated radiological control areas by WVDP (see Figure J.1)In addition, historical activities within WMA 7 may have led to the release of contaminated soilsinto drainage features that crossed into WMA 12 South. The radiological control area defined forWMA 7 does currently extend into WMA 12 South (see Figure J.1).Because there have not been significant historical soil disturbance activities for the majority ofWMA 12 South, subsurface soil contamination is not expected to be present in most of the area.The exceptions to this is an area immediately adjacent to WMA 2 that appears to have been apush-out area active in 1960s, and that exhibited elevated gamma readings in 1990-1991. Anysoil contamination present is expected to be limited to surface soils (i.e., top one meter of soils)with the possible exception of soils immediately adjacent to WMA 2 along the historical wastestorage lagoons. Also, within WMA 2, Lagoons 2 and 3 are unlined. Contaminated groundwatermay have migrated through the subsurface with discharge via seeps to Erdman Brook, potentiallyRev. 1 J-7
WVDP Phase 1 CSAPcontaminating subsurface soils between the boundary of WMA 2 and Erdman Brook along thefootprints of Lagoons 2 and 3.The data collection plans for WMA 12 South as described below, do not explicitly address thepossibility of subsurface soil contamination that is overlain by clean soils. The only areas wherethis is believed to be a plausible possibility are along the boundary with WMA 2, resulting fromactivities within WMA 2. Soil sampling to depth will also be taking place in WMA 2 along theboundary with WMA 12 South to address this possibility. If subsurface soil contamination thatextends into WMA 12 South is encountered as part of that effort, sampling will continue intoWMA 12 South until it is spatially bounded.Because both Erdman Brook and Franks Creek are primarily eroding features in this area of thesite, one would not expect to see sediment contamination extending more than one meter into thesubsurface. One would expect to find “bathtub ring” contamination along banks deposited byhigh flows that mobilize and transport contaminated soils and sediments.The limited historical groundwater data available for WMA 12 South show low level tritium andSr-90 impacts, predominately along the border with WMA 2, and to a lesser degree along theborder with WMA 7. Groundwater flow from the boundaries is likely inwards towards the centerof WMA 12 South, with discharges likely occurring to Erdman Brook and Franks Creek.There are no surface soil historical samples within WMA 12 South that exceed surface soil CG wrequirements. However, two surface soil samples (SS-08 and SS-04) come close, and may haveexceeded a Sum of Ratios (SOR) of unity if all 18 ROI had been analyzed. In addition, some ofthe most elevated areas identified by direct exposure readings were not sampled. Based on theexisting data, Figure J.12 indicates where contamination is expected to possibly exist above Phase1 CG w standards in soils, where measurable impacts are not likely to be above CG w standards,and where contamination is very unlikely to be above CG w standards.There is historical evidence of sediments exceeding sediment CG w requirements. Figure J.13shows the portions of Erdman Brook and Franks Creek where sediment CG requirements applyand the likelihood that contamination might be present above sediment CG w requirements. Basedon the very limited data available, Cs-137 appears to be the primary concern in WMA 12 Southsoils and sediments, followed by Sr-90.Rev. 1 J-8
WVDP Phase 1 CSAPJ.8 WMA 12 South-Specific Characterization Goals• Evaluate appropriateness of the current list of ROI• Verify absence of additional ROI• Determine extent of surface contamination• Determine level and extent of sediment contamination• Identify soil waste stream characteristics• Obtain data to support Phase 2 planning• Determine contamination status of various gullies and seeps that feed Erdman Brook andFranks Creek.J.9 CSAP Pre-Remediation Data Collection and Associated Decision-MakingCSAP pre-remediation data collection will consist of a number of components described in moredetail below.J.9.1Gamma Walkover Survey DataThe purpose of performing a gamma walkover survey of the WMA 12 area is to identify the leveland extent of surface contamination. This includes both general trends in average activityconcentrations pertinent to the CG w requirement, as well as the identification of isolated, moreelevatedanomalies that might be indicative of discrete releases and/or CG emc concerns.A complete (100%) logged gamma walkover survey (GWS) will be conducted for accessibleareas within WMA 12 South including exposed soils/sediments associated with Erdman Brookand Franks Creek. Examples of areas that would not be accessible are areas where standing wateris present in wetlands or ponds. Based on the GWS results, surface soil and sediment areas withinWMA 12 South will be divided into four categories: (1) surface soils where GWS data indicatecontamination above CG w requirements; (2) surface soils where GWS data indicatecontamination, but it is not clear if contamination exceeds surface soil CG w requirement; (3)surface soils where GWS indicate impacts, but those impacts are not expected to exceed surfacesoil CG w standards; and (4) surface soils where there is no indication of impacts abovebackground conditions. The purpose of this data collection is to provide insights into the spatialRev. 1 J-9
WVDP Phase 1 CSAPdistribution of surface contamination, and to guide subsequent soil/sediment sampling.[required]J.9.2Surface Soil SamplingSurface soil sampling will be used to address areas inaccessible to GWS data collection, toresolve hot spots identified by the GWS data, and to evaluate the presence, absence, and/or extentof surface contamination above CG w requirements based on GWS results.• Wetlands. It is possible that standing water in the wetlands and/or seeps downgradientfrom WMA 2 will be present that prevent GWS data collection from those areas.Consequently, soil/sediment sampling will be required for pond footprints and for anyother areas where standing water prevents the collection of GWS data.For every area where standing water or saturated soil conditions prevent GWS datacollection, systematic soil sampling will take place. For wetland areas less than 200 m 2 insize, one sample will be collected. For areas between 200 and 1,000 m 2 in size, onesample per 200 m 2 will be collected. For areas between 1,000 and 2,500 m 2 in size, fivesamples will be collected. For areas exceeding 2,500 m 2 in size, at minimum one samplewill be collected per 500-m 2 area. One sample will be collected from each locationrepresentative of a 0-15 cm depth interval. In the case where an area has more than onelocation, locations will be selected to provide systematic coverage of the area of interest.[contingent]• Hot Spots. If GWS data indicate the presence of contamination that possibly exceeds“hot spot” (CG emc ) standards or an isolated elevated area is identified that appearsindicative of a discrete release, the location of concern will be sampled with a biasedsample. If biased samples are collected from a particular location (soil or sediment), theywill be collected from two depth intervals: 0-15 cm, and 15 cm-1 m. The 0-15 cmsamples will be analyzed for the 12 radionuclides of potential interest in addition to the18 ROI. In the case of surface soils, one down-hole gamma scan will be conducted fromeach biased location. The purpose of these samples is to resolve GWS anomalies,evaluate the appropriateness of the current ROI list, and verify the absence of additionalROI. [contingent]Rev. 1 J-10
WVDP Phase 1 CSAP• CG w Sampling. Surface soil sampling may be conducted after the GWS to further clarifyresults, with the level and nature of sampling dependent on GWS results. If GWS resultsindicate no evidence of contamination impacts above background levels, no additionalsurface soil sampling will be required other than to address areas too wet to perform agamma walkover survey. Based on historical direct gamma measurements, the area mostlikely to have contamination exceeding surface soil CG w requirements is along the WMA2 border.oIf GWS results indicate contamination impacts above background levels but thatsurface soil contaminant levels exceeding CG w requirements are unlikely, thearea of interest will be systematically sampled using a triangular grid with adensity of one sample per 400 m 2 . One sample will be collected from eachlocation representative of a 0-15 cm depth interval. Locations will be selected toprovide systematic coverage of the area of interest. The purpose is to documentthe maximum activity concentrations present in surface soils within WMA 12South. [contingent]oIf GWS results indicate surface soil contaminant levels exceeding CG wrequirements likely exist, one sampling location will be selected at the highestgross activity level to confirm CG w exceedances and another set of samplinglocations will be identified to spatially bound the extent of contamination (i.e.,along the boundary of what is considered likely above CG w requirements) if thisis not obvious from the GWS data. Two samples will be collected from thelocation targeting high gross activity levels, one representative of a 0-15 cmdepth interval, and one representative of a 15 cm-1 m depth interval. One samplewill be collected from each location intended to laterally bound contamination,representative of a 0-15 cm depth interval. In addition, the location targeting highgross activity levels will have one down-hole gamma scan conducted at thecenter of the location with static measurements taken every 15 cm. Locations willbe selected so that each representative area does not overlap. The purpose is todocument CG w requirement exceedances and bound the lateral extent ofcontamination. [contingent]Rev. 1 J-11
WVDP Phase 1 CSAPoIf GWS results indicate areas with surface soil contamination impacts but it isunclear whether CG w requirement exceedances are present, at most five samplinglocations will be selected that systematically cover the areas of interest. Onesample will be collected from each location representative of a 0-15 cm depthinterval. Locations will be selected to provide systematic coverage of the area ofinterest with a maximum sample density of one sample per 200 m 2 area. Thepurpose is to resolve the question of whether CG w requirement exceedances existfor areas where GWS results are ambiguous. [contingent]oIf any 0-15 cm interval yields a sample result indicating a CG w requirementsexceedance and that sample location is not laterally bounded either by existingsampling locations with results less than CG w requirements or by GWS data thatclearly indicate contamination is not a concern, additional sampling locationswill be selected so that the contamination encountered is spatially bounded. Thepurpose is to laterally bound contamination that is above CG w requirements.[contingent]J.9.3Subsurface Soil SamplingThe purpose of subsurface soil sampling within WMA 12 South is to determine the vertical extentof contamination impacts above background levels.• If any 0-15 cm surface soil sample result indicates contamination impacts abovebackground levels and there was not a 15 cm-1 m sample collected from that location, a15 cm-1 m sample will be collected from that location following the protocols used forthe original 0-15 cm surface soil sample. In addition, each soil location will have onedown-hole gamma scan conducted at the center of the location with static measurementstaken every 15 cm. [contingent]• If a surface soil sample indicates contamination impacts above background levels for the15 cm-1 m depth interval, an additional sample from a depth of 1-2 m will be collectedand analyzed from that location. This process will continue until the vertical extent ofcontamination above background is bounded. One down-hole gamma scan will beconducted from each soil location requiring deeper investigation with a static readingRev. 1 J-12
WVDP Phase 1 CSAPtaken every 15 cm vertically. The purpose of these samples is to define the vertical extentof contamination. [contingent]J.9.4Sediment SamplingThe purpose of sediment sampling within WMA 12 South is to determine the presence and lateralextent of contamination above sediment CG w requirements, and the vertical extent of sedimentcontamination impacts above background levels, for those portions of Erdman Brook and FranksCreek where the sediment CG requirements apply. The areas shaded as part of the sediment CSMin Figure J.13 indicate the portions of Erdman Brook and Franks Creek to which sediment CGrequirements apply. For all other portions of Erdman Brook and Franks Creek, and any otherdrainage feature in WMA 12 South, the surface soil CG requirements apply.• One surface sediment sample will be collected to a depth of 15 cm from a biased locationin the vicinity of the confluence of Erdman Brook and Franks Creek. The location will beselected based on GWS data. Its location will be selected so that it targets the locationmost likely to contain significant contamination. Besides the 18 ROI it will also beanalyzed for the 12 radionuclides of potential interest. The purpose of this sample is toevaluate the appropriateness of the current ROI list and to verify the absence of additionalROI. [required]• One surface sediment sample will be collected to a depth of 15 cm from a biased locationimmediately downstream of the Equalization Basin discharge to Erdman Brook. Thelocation will be selected based on GWS data. Its location will be selected so that it targetsthe location most likely to contain significant contamination. Besides the 18 ROI it willalso be analyzed for the 12 radionuclides of potential interest. The purpose of this sampleis to evaluate the appropriateness of the current ROI list and to verify the absence ofadditional ROI. [required]• Systematic sediment sampling will focus on those portions of Erdman Brook consideredmost likely (based on GWS and historical sampling) to potentially have contaminationabove the CG w requirements for sediments. Figure J.13 shows the portions of ErdmanBrook and Franks Creek where the sediment CG requirements apply and the portion ofErdman Brook that possibly has contamination above sediment CG w requirements basedRev. 1 J-13
WVDP Phase 1 CSAPon historical information; these footprints may change based on GWS data collection. Ifthe footprints change significantly, the number of samples described below may alsochange. The goal is to have one sampling location per 10 m stretch of streambed. Aminimum of three sampling locations per each stream stretch will be required regardlessof how long the finalized stretches are. 21 sampling locations currently are expected fromthe eastern portion of Erdman Brook that is of concern (approximately 10 m betweensamples). It is not expected that Franks Creek will require this sampling. Each samplinglocation will have two samples collected from the center line of the streambed, one froma depth of 0-15 cm and one from a depth of 15 cm – 1m. The purpose of this sampling isto determine the level and extent of sediment contamination above the sediment CG wrequirement. [required]• Historical direct gamma measurements did not identify significant contamination inFranks Creek sediments. Consequently only one sediment sample will be collected fromFranks Creek. This sample will be biased in its selection, based on GWS data. If GWSdata do not identify an obvious biased location, then the sample will be drawn from aportion of the streambed where deposition appears to have taken place. The sample willbe collected from a depth of 0-15 cm. The purpose of this sampling is to determinewhether contamination above sediment CG w requirements is potentially present in FranksCreek sediments. [required]• If the results from the Erdman Brook and/or Franks Creek sampling effort indicatesediment CG w exceedances that stretch into the area of the creek designated as unlikelyor very unlikely to have contamination above sediment CG w requirements, systematicsampling of those remaining stretches of the creeks where sediment CG requirementsapply will be conducted with a spacing of one sampling location per 30 m. The purposeof this sampling is to determine the level and extent of sediment contamination.[contingent]• If any 0-15 cm sediment sample result indicates contamination impacts abovebackground levels, a 15 cm-1 m sample will be collected from that location following theprotocols used for the original 0-15 cm sediment sample if one has not already beencollected. [contingent]Rev. 1 J-14
WVDP Phase 1 CSAP• If a sediment sample indicates contamination impacts above background levels for the 15cm-1 m depth interval, an additional sample from a depth of 1-2 m will be collected andanalyzed from that location. This will be repeated, as necessary, until the vertical extentof contamination impact is bounded at that location. [contingent]J.9.5Drainage Feature SamplingFigure J.13 identifies those portions of Erdman Brook and Franks Creek where sediment CGrequirements apply. For the remaining portions of these streams within the WVDP premises aswell as other drainage features surface soil CG requirements apply. Some of these features lie inareas of WMA 12 South where contamination concerns are not significant (e.g. the far easternend of Franks Creek). There are other portions, however, where contamination impacts are likely.These include the western end of Erdman Brook and the ditches feeding Erdman Brook from thenorth and from WMA 7.• Samples representing a 0-15 cm depth interval will be collected from ditch sediments forthose ditches that have potential contamination concerns. Samples will be systematiclocated using a random start, separated by 30 m for those ditch portions that are morethan 30 m in length. [required]• If any 0-15 cm sample result indicates contamination impacts above background levels, a15 cm-1 m sample will be collected from that location following the protocols used forthe original 0-15 cm sample. [contingent]• If a sample indicates contamination impacts above background levels for the 15 cm-1 mdepth interval, an additional sample from a depth of 1-2 m will be collected and analyzedfrom that location. This will be repeated, as necessary, until the vertical extent ofcontamination impact is bounded at that location. [contingent]J.9.6Required <strong>Laboratory</strong> AnalysesAll samples will be submitted for analysis of all 18 ROI.Rev. 1 J-15
WVDP Phase 1 CSAPA select portion of the samples as described above will be analyzed for the additional12 radionuclides of potential interest. If these sample results indicate the presence of the one ormore of those radionuclides at levels of potential significance, then the balance of samples fromWMA 12 South will also be analyzed for the additional radionuclides that were identified.Table J.2 summarizes the required sample numbers and the estimated number of contingencysamples for WMA 12 South.This sampling plan assumes that quick turn-around analyses are available for Sr-90 and Cs-137and that soil samples will be screened for Sr-90 and Cs-137 prior to being analyzed for thebalance of the ROI. Contingency sampling requirements as described above may be undertakenbased on these screening data.J.9.7Decision-Making SummaryA summary of decision-making based on the WMA 12 South data is as follows:• If GWS indicate anomalies are present, biased samples will be selected to target thoseanomalies.• If biased sample results for the 15 cm-1 m depth interval indicate contamination impactsabove background, an additional sample from that location representing the depth interval1-2 m will be collected and this process repeated until contamination is verticallybounded.• The WMA 12 South surface soil area classification as contained in Figure J.12, and thesediment classification as contained in Figure J.13, will be adjusted based on GWSresults. These adjustments may affect systematic sample number requirements,particularly for sediments.• If the results from the biased sediment sample taken from the confluence of Franks Creekand Erdman Brook indicate one or more of the twelve radionuclides of potential interestRev. 1 J-16
WVDP Phase 1 CSAPare a concern, then the analyte list for all remaining samples from this area will bemodified to include those contaminants.• If systematic sediment samples from Erdman Brook indicate contamination near to orabove sediment CG w levels at the boundary of the area of concern being sampled,systematic sampling will be extended to the balance of Erdman Brook within the WVDPpremises.• If the biased sample from Franks Creek indicates contamination near to or abovesediment CG w requirements, systematic sampling will be conducted along the balance ofFranks Creek within the WVDP premises.• If systematic surface soil samples exceed sediment CG w requirements, sampling willcontinue to depth until the encountered contamination is vertically bounded, andsampling will continue laterally until contamination is laterally bounded.J.10 ReferencesDOE 2009. Phase I Decommissioning Plan for the West Valley Demonstration Project, Rev 2,prepared by Washington Safety Management Solutions, URS Washington Division,Science Applications International Corporation, prepared for DOE, December 2009.DOE 2010. Final Environmental Impact Statement for Decommissioning and/or Long-TermStewardship at the West Valley Demonstration Project and Western New York NuclearService Center, Vol 1, DOE/EIS-0226, January 2010.Rev. 1 J-17
WVDP Phase 1 CSAPTable J.1 Historical Data AnalysesNuclide# of SurfaceSoilLocations# ofSubsurfaceSoilLocations# of SedimentLocationsAm-241 1 2 9C-14 0 1 0Cm-243 0 1 0Cm-244 0 1 0Cs-137 8 3 11I-129 1 1 0Np-237 0 1 0Pu-238 1 2 8Pu-239 1 2 8Pu-240 1 2 8Pu-241 1 2 7Sr-90 8 3 11Tc-99 0 1 0U-232 1 2 8U-233 1 2 8U-234 1 2 8U-235 1 2 8U-238 1 2 8Rev. 1 J-18
WVDP Phase 1 CSAPTable J.2 Sample Number EstimatesRequired Contingent TotalSystematic Sediment Samples66 10 76(0-15 cm)Systematic Sediment Samples (1542 10 52cm-1 m)Biased Sediment Samples (0-152 3 5cm)Biased Sediment Samples (150 3 3cm-1 m)Biased Surface Soil Samples0 5 5(0-15 cm)Biased Surface Soil Samples (150 5 5cm-1 m)Contingent Surface Soil Samples 20 20Systematic Subsurface Soil0 2 2Samples (1-m intervals)Biased Subsurface Soil Samples0 1 1(1-m intervals)Total: 110 59 169Rev. 1 J-19
WVDP Phase 1 CSAPFigure J.1 WMA 12 SouthRev. 1 J-20
WVDP Phase 1 CSAPFigure J.2 WMA 12 South Aerial Photograph from 1962Rev. 1 J-21
WVDP Phase 1 CSAPFigure J.3 WMA 12 South Aerial Photograph from 1966Rev. 1 J-22
WVDP Phase 1 CSAPFigure J.4 WMA 12 South 2007 Aerial PhotoRev. 1 J-23
WVDP Phase 1 CSAPFigure J.5 1982 WMA 12 South Direct Gamma Exposure Measurement ResultsRev. 1 J-24
WVDP Phase 1 CSAPFigure J.6 WMA 12 South 1990 – 1991 Direct Gamma Exposure Measurement ResultsRev. 1 J-25
WVDP Phase 1 CSAPWMA 12 NorthWMA 12Figure J.7 WMA 12 South Historical Surface Sampling Locations (Phase 1 DP Fig 4-6)Rev. 1 J-26
WVDP Phase 1 CSAPWMA 12Figure J.8 WMA 12 South Historical Subsurface Sampling Locations (Phase 1 DP Fig 4-7)Rev. 1 J-27
WVDP Phase 1 CSAPFigure J.9 WMA 12 South Surface Cs-137 Activity ConcentrationsRev. 1 J-28
WVDP Phase 1 CSAPFigure J.10 WMA 12 South Surface Sr-90 Activity ConcentrationsRev. 1 J-29
WVDP Phase 1 CSAPFigure J.11 WMA 12 South Historical Groundwater Sampling LocationsRev. 1 J-30
WVDP Phase 1 CSAPFigure J.12 WMA 12 South Initial Surface Soil CSMRev. 1 J-31
WVDP Phase 1 CSAPFigure J.13 WMA 12 South Initial Sediment CSMRev. 1 J-32
WVDP Phase 1 CSAPAPPENDIX KWMA 12 (NORTHERN PORTION) PRE-REMEDIATION DATA COLLECTIONK.1 BackgroundThe northern portion of Waste Management Area 12 (WMA 12 North) is approximately 7 acresin size (see Figure K.1 for map).K.2 Physical SettingWMA 12 North is located on the North Plateau. It is bounded to the west, north, and east by theWVDP fence line and to the south by WMA 4.WMA 12 North is vegetated. A significant portion of its surface is a wetland that is orientedalong a southwest to northeast axis and is approximately 1.6 acres in size. A portion of this areahas standing water for most of the year. Surface drainage is towards the southwest through theNP-1 gully into Quarry Creek.The subsurface of WMA 12 North is comprised of the sand and gravel unit, a relativelypermeable unit that carries groundwater, which overlays the Lavery Till, a relatively impermeableunit that is a barrier to vertical groundwater flow. Because there has been no intrusive samplingwithin the boundaries of WMA 12 North, the thickness of the sand and gravel unit in this area isnot known. Groundwater likely flows to the northwest, north, and northeast following surfacetopography, discharging to seeps along Quarry Creek to the north, Franks Creek to the east,and/or to the wetlands/surface drainage features within WMA 12 North.There are no facilities in WMA 12 North.K.3 Area HistoryWMA 12 North was not used for any structural purposes during the lifespan of the NFSreprocessing activities on-site or for any known WVDP-related activities. As will be discussedRev. 1 K-1
WVDP Phase 1 CSAPlater in this section, there is evidence that portions of the surface have been reworked, althoughthe reason is unclear.Figure K.2 shows WMA 12 North in 1962 prior to NFS development. At this time WMA 12North was grassland and woodland.Figure K.3 shows WMA 12 North in 1966. A road leads into WMA 12 North from the southwestand terminates in what appears to be a cleared area. The purpose of the clearing is not known.Based on the fact that in later years ponds are present, this may have been a soils borrow area tosupport construction on the main NFS site.Figure K.4 shows WMA 12 North in 1968. The clearing is more defined than in 1966, as is theentry road from the southwest.Figure K.5 shows WMA 12 North in 1977. Ponds with standing water are present that were not inexistence in 1968. The ponds are located in the previously cleared areas.Figure K.6 shows WMA 12 North in 1984. In this photograph, ponds with standing water areclearly visible.Figure K.7 shows WMA 12 North in 1995. There is no visible change in WMA 12 North since1984.Figure K.8 shows WMA 12 North in 2007. There is no visible change in WMA 12 North since1995.K.4 Known and Suspected ReleasesK.4.1 Cesium ProngPotentially Affected Media:Potentially Affected WMAs:surface soil, subsurface soil, sediments1, 2, 3, 4, 5, 6, 10, 12 (northern portion)Rev. 1 K-2
WVDP Phase 1 CSAPIn 1968, a ventilation system filter in the Process Building (in WMA 1) failed, releasingcontaminated particulate up the Process Building stack. A mixture of radionuclides was released,with Cs-137 predominant. Approximately 0.33 Ci particulate gross beta radioactivity wasreleased. The contaminated particulate was deposited on surface soils, resulting in a large area ofcontamination around the Process Building and to the north-northwest. Detectable depositsextend several miles, including beyond the WVDP premises. WMAs 1, 2, 3, 4, 5, 6, 10, and 12North likely are affected. Because Cs-137 is predominant, this area of contamination is known as“the cesium prong” (DOE 2009 Table 2-17, DOE 2010 Section 3.11.5).As originally deposited, surface soil activity concentrations should have decreased towards thenorth, away from WMA 1. However, the surface features of many areas within the WVDPpremises have been reworked significantly since the release; as a result, the current spatial anddepth distribution of soil contamination may be significantly different than the original footprint.In addition, the surface soil contamination likely has been naturally spread by erosion and runoffinto surface drainage features; this phenomenon may have enlarged the area impacted bydeposition, although detailed data regarding this effect are not available (DOE 2010Section 3.11.5).Finally, other releases from the Process Building stack may have produced minor impacts. Theseother releases include the 1968 failure of a dissolver off-gas system filter, resulting in 0.28 Ci ofparticulate activity, and the 1968 failure of a vessel off-gas system filter, resulting in the March1968 releases to exceed the monthly allowance by 15 percent (DOE 2010 Section 3.11.5).K.4.2 Other Known and Suspected ReleasesThere are no known or suspected releases that originated within WMA 12 North.K.5 Existing DataExisting data sets for this area include:Rev. 1 K-3
WVDP Phase 1 CSAP• Direct measurement gamma surveys were conducted over portions of the WVDPpremises in 1982 and 1990-1991; however, no direct measurement gamma data werecollected for the WMA 12 North area.• There has been no sediment or soil sampling from within the WMA 12 North footprintavailable in the ELIMS database.• There has been no groundwater data collection from within the WMA 12 North footprintthat is reported in the ELIMS database.K.6 Planned Phase 1 DP ActivitiesThere are no planned Phase 1 decommissioning activities for WMA 12 North.K.7 <strong>Conceptual</strong> <strong>Site</strong> <strong>Model</strong>Based on the very limited available information, the conceptual site model (CSM) for WMA 12North is as follows. No environmental releases of contamination within WMA 12 North arebelieved to have occurred. However, environmental media within WMA 12 North likely havebeen affected to some degree by releases elsewhere on the WVDP premises. These include airdeposition contamination on surface soils, most likely along the western and southern portions ofWMA 12 North since these were in closest proximity to WMA 1, and potential reworking of thatcontamination by erosional processes in the vicinity of WMA 12 North.Pond sediments may be of concern since these ponds would have served as a settling basin forcontaminated soils eroded from surrounding surface soils. The ponds appear to have been presentfor forty years.Figure K.9 shows the current CSM for surface soils. Figure K.10 shows the CSM for soils deeperthan 1 m. The assumption is that it is unlikely that there is soil contamination deeper than onemeter within WMA 12 North. The assumption also is that there are no significant groundwaterimpacts within WMA 12 North; the most likely source of groundwater contamination would havebeen migration associated with the North Plateau Groundwater Plume. 2008 characterizationRev. 1 K-4
WVDP Phase 1 CSAPactivities to the south in adjacent WMA 4 did not identify plume impacts as far north as WMA 12North.K.8 WMA 12 North-Specific Characterization Goals• Evaluate appropriateness of the current list of Radionuclides of Interest (ROI)• Determine level and extent of surface contamination• Determine level and extent of sediment contamination• Identify soil waste stream characteristics• Obtain data to support Phase 2 planningK.9 CSAP Pre-Remediation Data Collection and Associated Decision-MakingCSAP pre-remediation data collection will consist of a number of components described in moredetail below.K.9.1 Gamma Walkover Survey DataThe purpose of performing a gamma walkover survey of the WMA 12 North area is to identifythe level and extent of surface contamination. This includes both general trends in averageactivity concentrations pertinent to the CG w requirement, as well as the identification of isolated,more-elevated anomalies that might be indicative of discrete releases and/or CG emc concerns.A complete (100%) logged gamma walkover survey (GWS) will be conducted for WMA 12North for accessible areas. Examples of areas that would not be accessible are areas wherestanding water is present in wetlands or ponds. Based on the GWS results, surface soils withinWMA 12 North will be divided four categories: (1) surface soils where GWS data indicatecontamination above CG w requirements; (2) surface soils where GWS data indicatecontamination, but it is not clear if contamination exceeds surface soil CG w requirement; (3)surface soils where GWS indicate impacts, but those impacts are not expected to exceed surfacesoil CG w standards; and (4) surface soils where there is no indication of impacts abovebackground conditions. The purpose of this data collection is to provide insights into the spatialdistribution of surface contamination, and to guide subsequent soil sampling. [required]Rev. 1 K-5
WVDP Phase 1 CSAPK.9.2 Surface Soil SamplingSurface soil sampling will be used to address areas inaccessible to GWS data collection, toresolve hot spots identified by the GWS data, and to evaluate the presence, absence, and/or extentof surface contamination above CG w requirements based on GWS results.• Wetlands. It is highly likely that standing water will be present in the ponds/wetlandsthat prevent GWS data collection from those areas. Consequently, soil/sediment samplingwill be required for pond footprints and for any other areas where standing water preventsthe collection of GWS data.For every area where standing water or saturated soil conditions prevent GWS datacollection, systematic soil sampling will take place. For wetland areas less than 200 m 2 insize, one sample will be collected. For areas between 200 and 1,000 m 2 in size, onesample per 200 m 2 will be collected. For areas between 1,000 and 2,500 m 2 in size, fivesamples will be collected. For areas exceeding 2,500 m 2 in size, at minimum one samplewill be collected per 500-m 2 area. One sample will be collected from each locationrepresentative of a 0-15 cm depth interval. In the case where an area has more than onelocation, locations will be selected to provide systematic coverage of the area of interest.[contingent]• Hot Spots. If GWS data indicate the presence of contamination that possibly exceeds“hot spot” (CG emc ) standards or an isolated elevated area is identified that appearsindicative of a discrete release, then the location of concern will be sampled with a biasedsample. If biased samples are collected from a particular location, they will be collectedfrom two depth intervals: 0-15 cm, and 15 cm-1 m. Sufficient soil mass will be collectedto allow for the analysis of all 18 ROI. All samples will be analyzed for all 18 ROI. Onedown-hole gamma scan will be conducted from each soil biased location with staticmeasurements taken every 15 cm. The purpose of these samples is to resolve GWSanomalies and evaluate the appropriateness of the current ROI list. [contingent]• CG w Sampling. Surface soil sampling may be conducted after the GWS to further clarifyresults, with the level and nature of sampling dependent on GWS results. If GWS resultsindicate no evidence of contamination impacts above background levels, no additionalRev. 1 K-6
WVDP Phase 1 CSAPsurface soil sampling will be required other than to address areas too wet to perform agamma walkover survey.oIf GWS results indicate contamination impacts above background levels but thatsurface soil contaminant levels exceeding CG w requirements are unlikely, thearea of interest will be systematically sampled using a triangular grid with adensity of one sample per 400 m 2 . One sample will be collected from eachlocation representative of a 0-15 cm depth interval. Locations will be selected toprovide systematic coverage of the area of interest. The purpose is to documentthe maximum activity concentrations present in surface soils within WMA 12North. [contingent]oIf GWS results indicate surface soil contaminant levels exceeding CG wrequirements likely exist, one sampling location will be selected at the highestgross activity level to confirm CG w exceedances and another set of samplinglocations will be identified to spatially bound the extent of contamination (i.e.,along the boundary of what is considered likely above CG w requirements) if thisis not obvious from the GWS data. Two samples will be collected from thelocation targeting high gross activity levels, one representative of a 0-15 cmdepth interval, and one representative of a 15 cm-1 m depth interval. One samplewill be collected from each location intended to laterally bound contamination,representative of a 0-15 cm depth interval. In addition, the location targeting highgross activity levels will have one down-hole gamma scan conducted at thecenter of the location with static measurements taken every 15 cm. Locations willbe selected so that each representative area does not overlap. The purpose is todocument CG w requirement exceedances and bound the lateral extent ofcontamination. [contingent]oIf GWS results indicate areas with surface soil contamination impacts but it isunclear whether CG w requirement exceedances are present, at most five samplinglocations will be selected that systematically cover the areas of interest. Onesample will be collected from each location representative of a 0-15 cm depthinterval. Locations will be selected to provide systematic coverage of the area ofinterest with a maximum sample density of one sample per 200 m 2 area. TheRev. 1 K-7
WVDP Phase 1 CSAPpurpose is to resolve the question of whether CG w requirement exceedances existfor areas where GWS results are ambiguous. [contingent]oIf any 0-15 cm interval yields a sample result indicating a CG w requirementsexceedance and that sample location is not laterally bounded either by existingsampling locations with results less than CG w requirements or by GWS data thatclearly indicate contamination is not a concern, additional sampling locationswill be selected so that the contamination encountered is spatially bounded. Thepurpose is to laterally bound contamination that is above CG w requirements.[contingent]K.9.3 Subsurface Soil SamplingThe purpose of subsurface soil sampling within WMA 12 North is to determine the vertical extentof contamination impacts above background levels.• If any 0-15 cm surface soil sample result indicates contamination impacts abovebackground levels and there was not a 15 cm-1 m sample collected from that location, a15 cm-1 m sample will be collected from that location following the protocols used forthe original 0-15 cm surface soil sample. In addition, each soil location will have onedown-hole gamma scan conducted at the center of the location with static measurementstaken every 15 cm. [contingent]• If a surface soil sample indicates contamination impacts above background levels for the15 cm-1 m depth interval, an additional sample from a depth of 1-2 m will be collectedand analyzed from that location. This process will continue until the vertical extent ofcontamination above background is bounded. One down-hole gamma scan will beconducted from each soil location requiring deeper investigation with a static readingtaken every 15 cm vertically. The purpose of these samples is to define the vertical extentof contamination. [contingent]K.9.4 Required <strong>Laboratory</strong> AnalysesRev. 1 K-8
WVDP Phase 1 CSAPAll samples will be submitted for analysis of all 18 ROI. No samples will require analysis of thetwelve potential radionuclides of concern.Table K.1 summarizes the number of required samples and the estimated number of contingencysamples for WMA 12 North.This sampling plan assumes that quick turn-around analyses (within 48 hours) are available forSr-90 and Cs-137 and that soil samples will be screened for Sr-90 and Cs-137 prior to beinganalyzed for the balance of the ROI. Contingency sampling requirements as described above maybe undertaken based on these screening data.K.9.5 Decision-Making SummaryA summary of decision-making based on the WMA 12 North data is as follows:• If GWS indicate anomalies are present, biased samples will be selected to target thoseanomalies.• The WMA 12 North surface soil area classification as contained in Figure K.9 will beadjusted based on GWS results. These adjustments may affect systematic sample numberrequirements.• If the GWS data identify areas likely exceeding CG w requirements, one sample will beplaced to verify contamination and another set of surface soil samples used to laterallybound contamination. Additional locations may be selected, as necessary, to laterallybound contamination extent.• If GWS data indicate impacts exist but that it is unlikely that contamination exceeds CG wrequirements, five biased locations will be selected based on GWS data to verify thisconclusion.• If GWS data identify areas where contamination impacts exist but CG w compliance isunclear, at most five systematic surface soil samples will be allocated to each area toverify contamination status.Rev. 1 K-9
WVDP Phase 1 CSAP• If a portion of the WMA 12 North area is too wet to conduct a GWS, at most fivesystematic sampling locations will be selected per area to evaluate the presence ofcontamination above CG w requirements.• If sample results from 0-15 cm intervals are above background and there was not a 15cm-1 m sample collected for that location, a 15 cm-1 m sample will be collected andanalyzed.• If sample results for the 15 cm-1 m depth interval are above background, an additionalsample from that location representing the depth interval 1-2 m will be collected and thisprocess repeated until contamination is vertically bounded.• If a surface soil sample indicates contamination above CG w requirements and thatlocation is not bounded either by GWS data that indicate conditions are clearly belowCG w requirements or other surface soil sample locations that indicate activityconcentrations below CG w requirements, then additional surface soil sampling locationswill be selected to bound the contamination encountered.K.10 ReferencesDOE 2009. Phase I Decommissioning Plan for the West Valley Demonstration Project, Rev 2,prepared by Washington Safety Management Solutions, URS Washington Division,Science Applications International Corporation, prepared for DOE, December 2009.DOE 2010. Final Environmental Impact Statement for Decommissioning and/or Long-TermStewardship at the West Valley Demonstration Project and Western New York NuclearService Center, Vol 1, DOE/EIS-0226, January 2010.Rev. 1 K-10
WVDP Phase 1 CSAPTable K.1 Sample Number EstimatesRequired Contingent TotalSystematic Sediment Samples14 0 14(0-15 cm)Systematic Sediment Samples (150 5 5cm-1 m)Biased Surface Soil Samples0 3 3(0-15 cm)Biased Surface Soil Samples (150 3 3cm-1 m)Contingent Surface Soil Samples 0 20 20Total: 14 31 45Rev. 1 K-11
WVDP Phase 1 CSAPFigure K.1 WMA 12 NorthRev. 1 K-12
WVDP Phase 1 CSAPFigure K.2 WMA 12 North Aerial Photograph from 1962Rev. 1 K-13
WVDP Phase 1 CSAPFigure K.3 WMA 12 North Aerial Photograph from 1966Rev. 1 K-14
WVDP Phase 1 CSAPFigure K.4 WMA 12 North Aerial Photograph from 1968Rev. 1 K-15
WVDP Phase 1 CSAPFigure K.5 WMA 12 North Aerial Photograph from 1977Rev. 1 K-16
WVDP Phase 1 CSAPFigure K.6 WMA 12 North Aerial Photograph from 1984Rev. 1 K-17
WVDP Phase 1 CSAPFigure K.7 WMA 12 North Aerial Photograph from 1995Rev. 1 K-18
WVDP Phase 1 CSAPFigure K.8 WMA 12 North Aerial Photograph from 2007Rev. 1 K-19
WVDP Phase 1 CSAPFigure K.9 Initial WMA 12 North Surface Soil CSMRev. 1 K-20
WVDP Phase 1 CSAPFigure K.10 Initial WMA 12 North Subsurface Soil CSMRev. 1 K-21