Q1âQ3 2008 - PALFINGER
Q1âQ3 2008 - PALFINGER
Q1âQ3 2008 - PALFINGER
Create successful ePaper yourself
Turn your PDF publications into a flip-book with our unique Google optimized e-Paper software.
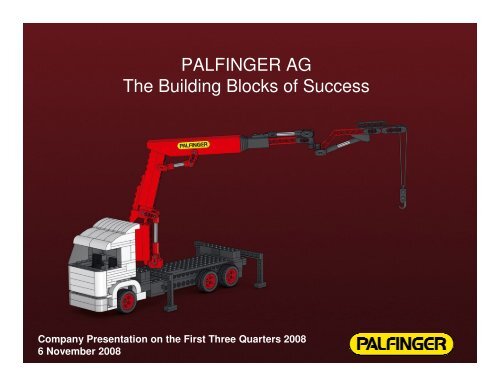
<strong>PALFINGER</strong> AGThe Building Blocks of SuccessCompany Presentation on the First Three Quarters <strong>2008</strong>16 November <strong>2008</strong>
<strong>PALFINGER</strong> FinancialsQ1–Q3 <strong>2008</strong> Q1–Q3 2007 %Revenue 607.2 504.6 + 20.3%EBIT 75.1 73.3 + 2.3%EBIT margin 12.4% 14.5% –Capital employed 453.6 316.6 + 43.2%Gearing 41.7% 14.2% –Equity ratio 51.1% 57.8% –Average payroll during the reporting period * 4,522 3,786 + 19.4%Acc. to IFRS in million EURMinor rounding differences may occur.3* Consolidated Group companies excluding equity shareholdings, as well as excludingapprentices, temporary workers, and workers employed for only very short periods.
4Strategy
<strong>PALFINGER</strong> at a Glance• Leading international manufacturer of hydraulic lifting, loading,and handling systems at each interface of the transport chain• Innovation and diversification in 9 product groups• World market leader in knuckle boom cranes, timber and recycling cranes,and container handling systems• Number two in tail lifts and transportable forklifts• Leading specialist in high-tech railway applications• Internationalisation• Global sales and service network(4 areas, more than 200 general importers/dealers and 4,000 sales and service centresworldwide)• Global procurement, production, and assembly (23 production and assembly locations)Focus on profitable growth and shareholder value5
Objectives Pursued by the CompanyControlled profitable growth (organic and through acquisitions)Objectives:• Secure and establish/expand major product divisions and areas• Seize market opportunities, especially in Eastern Europe, Russia, Asia,and South America• Focus on future projects (VENTURES segment)• Positive earnings contribution in all product groups• Ranking among the top three market players in all product groups6
Strategic Highlights – Production• Investment programme (2006–<strong>2008</strong>) completed to a large extent• Investment volume approx. EUR 80 million (excl. replacement investments)• Capacity expansion measures, process enhancement, quality• Expansion of the site in Shenzhen, China• Production capacities created• First hook loaders manufactured at this plant in <strong>2008</strong>• Adjustment of capacities to market situation• Reduction in the number of temporary personnel• Use of flexible working time models• Keeping structures and processes flexible7
Strategic Highlights – Acquisitions• MBB Group (since 1 January <strong>2008</strong>)• Phase-out of the former PALGATE tail lifts• Bundling of Continental European tail lift activities in Germany• Exploitation of synergy potential• WUMAG ELEVANT (since 1 August <strong>2008</strong>)• Supplement to the former BISON access platform portfolio• Production and distribution capacities in Germany• Acquisition makes <strong>PALFINGER</strong> the number one in Central Europe8
Acquisition of Omaha Standard• Leading producer of truck bodies andpick-up tail lifts in the US• Annual revenues of approx. EUR 55 million• Highly-qualified staff of 450• Distribution network with approx. 400 serviceand sales centres• Consolidation of <strong>PALFINGER</strong>’s market position• Doubling of annual revenues in this areato EUR 100 million• Increase in local value creation• Platform for future growth in the US9
10Key Financial Figures
Financial Highlights• Revenue increased by 20.3% to EUR 607.2 million• High order backlog at the beginning of the year• Capacity expansion• Acquisitions contributed approximately EUR 58 million• EBIT rose only by 2.3% to EUR 75.1 million• Changing markets due to economic situation• Acquisitions increase the share of hydraulic systems• Accounting rules for initial consolidations• EBIT margin decreased to 12.4%11
Quarterly Figures2502001501005011112.212217.113220.313215.413412.3Revenue140149 14821.520.317.5EBIT16214824.017.717827.016422.419126.320921529.6 30.018415.44035302520151050EBITmarginQ4/04 Q1/05 Q2/05 Q3/05 Q4/05 Q1/06 Q2/06 Q3/06 Q4/06 Q1/07 Q2/07 Q3/07 Q4/07 Q1/08 Q2/08 Q3/0811.0% 14.1% 15.3% 11.7% 9.2% 12.5% 14.5% 13.7% 12.0% 14.8% 15.2% 13.6% 13.8% 14.2% 14.0% 8.4%014Acc. to IFRS in million EURMinor rounding differences may occur.
InvestmentInvestment in property, plant, and equipmentDepreciation, amortisation, and impairment5048.34038.63020108.38.610.08.313.09.910.715.30Q1–Q3 2004 Q1–Q3 2005 Q1–Q3 2006 Q1–Q3 2007 Q1–Q3 <strong>2008</strong>Investments in process optimisations15Acc. to IFRS in million EUR.Minor rounding differences may occur.
Capital EmployedNon-current operating assetsNet working capitalCapital employed5004003002001000453.6316.6172.7239.3 243.4116.6180.397.9 94.364.9280.9200.0115.4 141.4 149.1Q3 2004 Q3 2005 Q3 2006 Q3 2007 Q3 <strong>2008</strong>16Acc. to IFRS in million EURMinor rounding differences may occur.
Gearing and EquityNet debt Equity Gearing %350300250200150100500320.1277.3 41.7%228.0189.9150.220.0%24.4%133.514.2%30.046.46.8%15.439.4Q3 2004 Q3 2005 Q3 2006 Q3 2007 Q3 <strong>2008</strong>50%40%30%20%10%0%Gearing at low level despite investments and acquisitions17Acc. to IFRS in million EURMinor rounding differences may occur.
Cash Flow StatementGrowth equity-financed from operating profitsQ1–Q3 <strong>2008</strong> Q1–Q3 2007 Q1–Q3 2006 Q1–Q3 2005EBTDA 87.4 83.2 66.5 58.4+ / – Cash flows for working capital (31.1) (20.8) (19.4) (28.1)+ / – Cash flows for tax payments (24.5) (13.4) (8.9) (9.6)Cash flows from operating activities 31.8 49.0 38.2 20.7Cash flows for investing activities (55.3) (48.5) (13.7) (29.6)Cash flows after changes inworking capital & investmentsCash flows from equity /investor capitalCash flows fromnet financial liabilities(23.5) 0.5 24.5 (8.9)(28.3) (20.8) (15.9) (11.6)51.8 20.3 (8.6) 20.5Free cash flows (20.2) 3.7 26.9 ( 6.4)18Acc. to IFRS in million EURMinor rounding differences may occur.
Payroll*Promotion of Staff is Core Success Factor30/9/<strong>2008</strong> 31/12/2007 31/12/2006 31/12/2005 31/12/2004Austria 1,093 1,057 933 861 816Rest of Western Europe 1,238 1,034 826 846 628Central/Eastern Europe 1,549 1,611 1,259 1,111 873North America 215 197 157 128 107South America 490 454 384 380 372Asia 40 24 10 – –Total 4,625 4,377 3,569 3,326 2,79619* Consolidated Group companies excluding equity shareholdings, as well as excluding apprentices,temporary workers, and workers employed for only very short periods.
Performance of <strong>PALFINGER</strong> Share since 2007200180160140120100806040202/1/200728/12/2007 31/10/<strong>2008</strong>DAX<strong>PALFINGER</strong> AGEUR 12.40ATX20
Shareholder Information• ISINAT0000758305• Number of shares 35,730,000Q1–Q3 <strong>2008</strong> 2007 2006 2005High in EUR 28.37 42.84 23.56 18.40Low in EUR 12.80 22.95 15.00 9.63Share price as of end of the period in EUR 12.80 25.62 23.25 16.00Average price in EUR 20.53 32.82 18.83 13.80Market capitalisation as of end of the periodin million EUR (excl. own shares)452.53 905.15 820.48 563.97Number of own shares 376,000 1,805,000 1,845,644 1,886,9241,405,000 own shares cancelled on 28 May <strong>2008</strong>21The figures for the same period of the previous yearshave been adjusted pursuant to the stock split.
22Outlook
Outlook and Objectives – Internally• Development and expansion of product divisions and areas of strategic importance• Completion of the investment programme• Turnaround achieved in HYDRAULIC SYSTEMS & SERVICES• Shift of the product mix towards systems with lower margins• Adjustment of structures and processes to the market situationUsing the strong position to exploit market opportunities23
Outlook and Objectives – Externally• Macroeconomic development – a substantial factor• Significant decline in demand in some core markets• Seasonal differences with lower growth figures in the second half yearDouble-digit growth expected for <strong>2008</strong>,results lower than in the previous year24
Investor RelationsHerbert Ortner, CEOPhone: +43 662 46 84-2222h.ortner@palfinger.comHannes Roither, Company SpokespersonPhone: +43 662 46 84-2260h.roither@palfinger.com<strong>PALFINGER</strong> AGFranz-Wolfram-Scherer-Strasse 245101 Bergheim/SalzburgFax: +43 662 46 84-228025The product illustrated is not part of the LEGO® range. We would like to point out that this modelis not available for purchase and that the LEGO Group has not marketed or purchased thisproduct.


