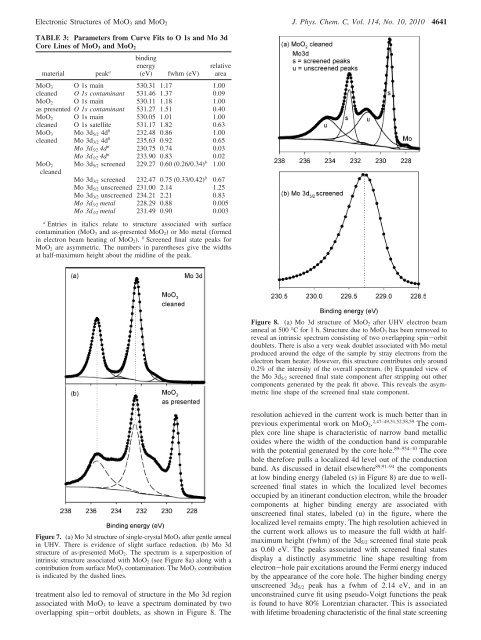
<strong>Electronic</strong> <strong>Structures</strong> <strong>of</strong> MoO 3 <strong>and</strong> MoO 2 J. Phys. Chem. C, Vol. 114, No. 10, 2010 4641TABLE 3: Parameters from Curve Fits to O 1s <strong>and</strong> Mo 3dCore Lines <strong>of</strong> MoO 3 <strong>and</strong> MoO 2material peak a (eV)bindingenergyfwhm (eV)relativeareaMoO 3 O 1s main 530.31 1.17 1.00cleaned O 1s contaminant 531.46 1.37 0.09MoO 2 O 1s main 530.11 1.18 1.00as presented O 1s contaminant 531.27 1.51 0.40MoO 2 O 1s main 530.05 1.01 1.00cleaned O 1s satellite 531.17 1.82 0.63MoO 3 Mo 3d 5/2 4d 0 232.48 0.86 1.00cleaned Mo 3d 3/2 4d 0 235.63 0.92 0.65Mo 3d 5/2 4d n 230.75 0.74 0.03Mo 3d 3/2 4d n 233.90 0.83 0.02MoO 2cleanedMo 3d 5/2 screened 229.27 0.60 (0.26/0.34) b 1.00Mo 3d 3/2 screened 232.47 0.75 (0.33/0.42) b 0.67Mo 3d 5/2 unscreened 231.00 2.14 1.25Mo 3d 3/2 unscreened 234.21 2.21 0.83Mo 3d 5/2 metal 228.29 0.88 0.005Mo 3d 3/2 metal 231.49 0.90 0.003a Entries in italics relate to structure associated with surfacecontamination (MoO 3 <strong>and</strong> as-presented MoO 2 ) or Mo metal (formedin electron beam heating <strong>of</strong> MoO 2 ). b Screened final state peaks forMoO 2 are asymmetric. The numbers in paren<strong>the</strong>ses give <strong>the</strong> widthsat half-maximum height about <strong>the</strong> midline <strong>of</strong> <strong>the</strong> peak.Figure 8. (a) Mo 3d structure <strong>of</strong> MoO 2 after UHV electron beamanneal at 500 °C for 1 h. Structure due to MoO 3 has been removed toreveal an intrinsic spectrum consisting <strong>of</strong> two overlapping spin-orbitdoublets. There is also a very weak doublet associated with Mo metalproduced around <strong>the</strong> edge <strong>of</strong> <strong>the</strong> sample by stray electrons from <strong>the</strong>electron beam heater. However, this structure contributes only around0.2% <strong>of</strong> <strong>the</strong> intensity <strong>of</strong> <strong>the</strong> overall spectrum. (b) Exp<strong>and</strong>ed view <strong>of</strong><strong>the</strong> Mo 3d 5/2 screened final state component after stripping out o<strong>the</strong>rcomponents generated by <strong>the</strong> peak fit above. This reveals <strong>the</strong> asymmetricline shape <strong>of</strong> <strong>the</strong> screened final state component.Figure 7. (a) Mo 3d structure <strong>of</strong> single-crystal MoO 3 after gentle annealin UHV. There is evidence <strong>of</strong> slight surface reduction. (b) Mo 3dstructure <strong>of</strong> as-presented MoO 2 . The spectrum is a superposition <strong>of</strong>intrinsic structure associated with MoO 2 (see Figure 8a) along with acontribution from surface MoO 3 contamination. The MoO 3 contributionis indicated by <strong>the</strong> dashed lines.treatment also led to removal <strong>of</strong> structure in <strong>the</strong> Mo 3d regionassociated with MoO 3 to leave a spectrum dominated by twooverlapping spin-orbit doublets, as shown in Figure 8. Theresolution achieved in <strong>the</strong> current work is much better than inprevious experimental work on MoO 2 . 2,47–49,51,52,58,59 The complexcore line shape is characteristic <strong>of</strong> narrow b<strong>and</strong> metallicoxides where <strong>the</strong> width <strong>of</strong> <strong>the</strong> conduction b<strong>and</strong> is comparablewith <strong>the</strong> potential generated by <strong>the</strong> core hole. 89–954–10 The corehole <strong>the</strong>refore pulls a localized 4d level out <strong>of</strong> <strong>the</strong> conductionb<strong>and</strong>. As discussed in detail elsewhere 89,91–94 <strong>the</strong> componentsat low binding energy (labeled (s) in Figure 8) are due to wellscreenedfinal states in which <strong>the</strong> localized level becomesoccupied by an itinerant conduction electron, while <strong>the</strong> broadercomponents at higher binding energy are associated withunscreened final states, labeled (u) in <strong>the</strong> figure, where <strong>the</strong>localized level remains empty. The high resolution achieved in<strong>the</strong> current work allows us to measure <strong>the</strong> full width at halfmaximumheight (fwhm) <strong>of</strong> <strong>the</strong> 3d 5/2 screened final state peakas 0.60 eV. The peaks associated with screened final statesdisplay a distinctly asymmetric line shape resulting fromelectron-hole pair excitations around <strong>the</strong> Fermi energy inducedby <strong>the</strong> appearance <strong>of</strong> <strong>the</strong> core hole. The higher binding energyunscreened 3d 5/2 peak has a fwhm <strong>of</strong> 2.14 eV, <strong>and</strong> in anunconstrained curve fit using pseudo-Voigt functions <strong>the</strong> peakis found to have 80% Lorentzian character. This is associatedwith lifetime broadening characteristic <strong>of</strong> <strong>the</strong> final state screening
4642 J. Phys. Chem. C, Vol. 114, No. 10, 2010 Scanlon et al.process. The energy separation between screened <strong>and</strong> unscreened3d 5/2 peaks is 1.63 eV, which is almost exactly equal to <strong>the</strong>plasmon energy <strong>of</strong> 1.56 eV for MoO 2 45 measured by electronenergy loss spectroscopy. The unscreened final state peaks may<strong>the</strong>refore be regarded as unusually strong plasmon satellites, asfirst proposed by Wer<strong>the</strong>im. 92 Our interpretation <strong>of</strong> <strong>the</strong> core levelstructure in terms <strong>of</strong> intrinsic final state screening effects is verydifferent to that popular in <strong>the</strong> catalytic literature, which hasmostly ignored <strong>the</strong> narrow b<strong>and</strong> metallic nature <strong>of</strong> MoO 2 <strong>and</strong>attempted to associate what we believe to be intrinsic satelliteswith “Mo 2 O 5 ” surface contamination 47–49,51,52 even though <strong>the</strong>reis no known Mo(V) oxide bulk phase. We note here thatChambers <strong>and</strong> co-workers studied <strong>the</strong> photoelectron diffractionpr<strong>of</strong>iles <strong>of</strong> satellites found in Ru 3d core XPS <strong>of</strong> metallic RuO 2 . 96The satellites were very similar to those observed in <strong>the</strong> currentwork, <strong>and</strong> it was shown that <strong>the</strong> angular variation in <strong>the</strong> satelliteintensity mirrored that <strong>of</strong> <strong>the</strong> main peak. This establishesdefinitively that <strong>the</strong> satellite intensity derives from Ru ionsoccupying identical sites to those responsible for <strong>the</strong> main peak<strong>and</strong> that <strong>the</strong> satellite structure is <strong>the</strong>refore intrinsic to RuO 2 <strong>and</strong>does not arise from ill-defined surface phases with oxidationstates greater than than (IV).Fur<strong>the</strong>r support for our interpretation is provided by <strong>the</strong> factthat <strong>the</strong> O 1s spectrum <strong>of</strong> MoO 2 also contains a very strongsatellite separated from <strong>the</strong> main peak by 1.12 eV, as shown inFigure 9. This is a little lower than <strong>the</strong> satellite energy for <strong>the</strong>Mo 3d core lines, but it is not unreasonable to expect that <strong>the</strong>screening response upon generation <strong>of</strong> an O 1s core hole shouldbe different than that in response to generation <strong>of</strong> a Mo 3d corehole because <strong>the</strong> conduction b<strong>and</strong> is composed mainly <strong>of</strong> Mo4d states. We can rule out <strong>the</strong> possibility that <strong>the</strong> O 1s satellitearises from OH or carbonate surface contamination (which cangive peaks to high binding energy <strong>of</strong> <strong>the</strong> main peak in oxides)on <strong>the</strong> basis that (i) <strong>the</strong> satellite is much more intense than <strong>the</strong>contaminant high binding energy structure found for MoO 3 , eventhough <strong>the</strong> latter has been subject to in situ surface cleaning ata lower temperature than MoO 2 , (ii) <strong>the</strong> satellite intensity forMoO 2 increases after in situ cleaning (this is compatible withremoval <strong>of</strong> a surface layer <strong>of</strong> MoO 3 , which does not have astrong satellite, but difficult to underst<strong>and</strong> if <strong>the</strong> satellite isassociated with surface contamination), (iii) <strong>the</strong> satellite peakhas a dominantly Lorentzian line shape (80% Lorentziancontribution to <strong>the</strong> pseudo-Voigt pr<strong>of</strong>ile in an unconstrained fit)as expected for a plasmon loss peak, (iv) similar O 1s structureis found for o<strong>the</strong>r metallic oxides, such as <strong>the</strong> sodium tungstenbronzes, 92 Sb-doped SnO 2 , 97 <strong>and</strong> defect doped PbO 2-x . 98 Theclosely related nonmetallic oxides WO 3 , undoped SnO 2 , <strong>and</strong>PbO do not display a pronounced O 1s satellite.Valence B<strong>and</strong> Spectra. Valence b<strong>and</strong> X-ray photoemissionspectra <strong>of</strong> MoO 3 <strong>and</strong> MoO 2 are shown in Figure 10. The spectramay be compared with <strong>the</strong> computed density <strong>of</strong> states but with<strong>the</strong> different partial densities <strong>of</strong> states weighted by one-electronionization cross sections. At hν ) 1486.6 eV, <strong>the</strong> relevant oneelectroncross section for ionization <strong>of</strong> O2pstates is 0.06 kB,whereas <strong>the</strong> cross section for Mo 4d states is 0.92 kB. The crosssectionweighted density <strong>of</strong> states is <strong>the</strong>refore very muchdominated by <strong>the</strong> Mo 4d contribution which is weighted by afactor <strong>of</strong> 15 relative to O 2p. 99For MoO 3 <strong>the</strong> biggest Mo 4d contribution to <strong>the</strong> occupieddensity <strong>of</strong> states is found in regions I <strong>and</strong> II toward <strong>the</strong> middle<strong>and</strong> bottom <strong>of</strong> <strong>the</strong> valence b<strong>and</strong> (see Figure 10), with only asmall contribution in region IV where <strong>the</strong> O 2p partial density<strong>of</strong> states is at a maximum. In agreement with <strong>the</strong> calculation<strong>the</strong> structure associated with III <strong>and</strong> IV appears as a shoulderFigure 9. (a) O 1s core level structure <strong>of</strong> MoO 3 after cleaning samplesin UHV at 300 °C. (b) O 1s core line <strong>of</strong> as-presented MoO 2 .(c)O1score line <strong>of</strong> MoO 2 after in situ cleaning. Note that <strong>the</strong> intensity <strong>of</strong> <strong>the</strong>high binding energy satellite peak <strong>of</strong> MoO 2 increases after <strong>the</strong> cleaningprocedure.on <strong>the</strong> low binding energy side <strong>of</strong> II in <strong>the</strong> experimentalspectrum ra<strong>the</strong>r than IV appearing as a maximum, as in <strong>the</strong>unweighted density <strong>of</strong> states. This situation is reversed in lowerenergy ultraviolet photoemission spectra where peak IV dominates<strong>the</strong> valence b<strong>and</strong> photoemission. 23 In agreement with <strong>the</strong>core level data a weak peak associated with occupied Mo 4dstates appears close to <strong>the</strong> Fermi energy. This must be associatedwith O vacancy defects to give MoO 3-x , which is no longer4d 0 . 23 Linear extrapolation <strong>of</strong> <strong>the</strong> valence b<strong>and</strong> edge to zerointensity gives a valence b<strong>and</strong> onset energy <strong>of</strong> 2.8 eV. If it isassumed that <strong>the</strong> defect states pin <strong>the</strong> Fermi energy close to <strong>the</strong>bottom <strong>of</strong> <strong>the</strong> conduction b<strong>and</strong> this onset energy is in agreementwith an indirect gap <strong>of</strong> 2.82 eV as determined by absorptionmeasurements on single crystals. 10 The width <strong>of</strong> <strong>the</strong> valenceb<strong>and</strong> is calculated to be ∼6.3 eV, which is just under <strong>the</strong> value<strong>of</strong> 7 eV measured in <strong>the</strong> present work <strong>and</strong> in ref 23. The small