

Theoretical and Experimental Study of the Electronic Structures of ...
Theoretical and Experimental Study of the Electronic Structures of ...
Theoretical and Experimental Study of the Electronic Structures of ...

You also want an ePaper? Increase the reach of your titles
YUMPU automatically turns print PDFs into web optimized ePapers that Google loves.
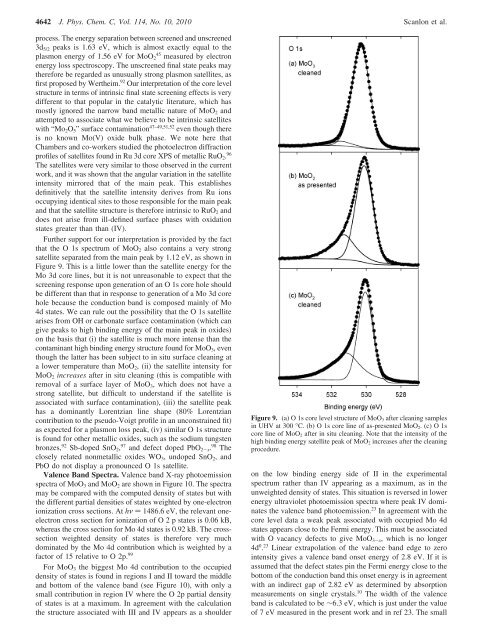
4642 J. Phys. Chem. C, Vol. 114, No. 10, 2010 Scanlon et al.process. The energy separation between screened <strong>and</strong> unscreened3d 5/2 peaks is 1.63 eV, which is almost exactly equal to <strong>the</strong>plasmon energy <strong>of</strong> 1.56 eV for MoO 2 45 measured by electronenergy loss spectroscopy. The unscreened final state peaks may<strong>the</strong>refore be regarded as unusually strong plasmon satellites, asfirst proposed by Wer<strong>the</strong>im. 92 Our interpretation <strong>of</strong> <strong>the</strong> core levelstructure in terms <strong>of</strong> intrinsic final state screening effects is verydifferent to that popular in <strong>the</strong> catalytic literature, which hasmostly ignored <strong>the</strong> narrow b<strong>and</strong> metallic nature <strong>of</strong> MoO 2 <strong>and</strong>attempted to associate what we believe to be intrinsic satelliteswith “Mo 2 O 5 ” surface contamination 47–49,51,52 even though <strong>the</strong>reis no known Mo(V) oxide bulk phase. We note here thatChambers <strong>and</strong> co-workers studied <strong>the</strong> photoelectron diffractionpr<strong>of</strong>iles <strong>of</strong> satellites found in Ru 3d core XPS <strong>of</strong> metallic RuO 2 . 96The satellites were very similar to those observed in <strong>the</strong> currentwork, <strong>and</strong> it was shown that <strong>the</strong> angular variation in <strong>the</strong> satelliteintensity mirrored that <strong>of</strong> <strong>the</strong> main peak. This establishesdefinitively that <strong>the</strong> satellite intensity derives from Ru ionsoccupying identical sites to those responsible for <strong>the</strong> main peak<strong>and</strong> that <strong>the</strong> satellite structure is <strong>the</strong>refore intrinsic to RuO 2 <strong>and</strong>does not arise from ill-defined surface phases with oxidationstates greater than than (IV).Fur<strong>the</strong>r support for our interpretation is provided by <strong>the</strong> factthat <strong>the</strong> O 1s spectrum <strong>of</strong> MoO 2 also contains a very strongsatellite separated from <strong>the</strong> main peak by 1.12 eV, as shown inFigure 9. This is a little lower than <strong>the</strong> satellite energy for <strong>the</strong>Mo 3d core lines, but it is not unreasonable to expect that <strong>the</strong>screening response upon generation <strong>of</strong> an O 1s core hole shouldbe different than that in response to generation <strong>of</strong> a Mo 3d corehole because <strong>the</strong> conduction b<strong>and</strong> is composed mainly <strong>of</strong> Mo4d states. We can rule out <strong>the</strong> possibility that <strong>the</strong> O 1s satellitearises from OH or carbonate surface contamination (which cangive peaks to high binding energy <strong>of</strong> <strong>the</strong> main peak in oxides)on <strong>the</strong> basis that (i) <strong>the</strong> satellite is much more intense than <strong>the</strong>contaminant high binding energy structure found for MoO 3 , eventhough <strong>the</strong> latter has been subject to in situ surface cleaning ata lower temperature than MoO 2 , (ii) <strong>the</strong> satellite intensity forMoO 2 increases after in situ cleaning (this is compatible withremoval <strong>of</strong> a surface layer <strong>of</strong> MoO 3 , which does not have astrong satellite, but difficult to underst<strong>and</strong> if <strong>the</strong> satellite isassociated with surface contamination), (iii) <strong>the</strong> satellite peakhas a dominantly Lorentzian line shape (80% Lorentziancontribution to <strong>the</strong> pseudo-Voigt pr<strong>of</strong>ile in an unconstrained fit)as expected for a plasmon loss peak, (iv) similar O 1s structureis found for o<strong>the</strong>r metallic oxides, such as <strong>the</strong> sodium tungstenbronzes, 92 Sb-doped SnO 2 , 97 <strong>and</strong> defect doped PbO 2-x . 98 Theclosely related nonmetallic oxides WO 3 , undoped SnO 2 , <strong>and</strong>PbO do not display a pronounced O 1s satellite.Valence B<strong>and</strong> Spectra. Valence b<strong>and</strong> X-ray photoemissionspectra <strong>of</strong> MoO 3 <strong>and</strong> MoO 2 are shown in Figure 10. The spectramay be compared with <strong>the</strong> computed density <strong>of</strong> states but with<strong>the</strong> different partial densities <strong>of</strong> states weighted by one-electronionization cross sections. At hν ) 1486.6 eV, <strong>the</strong> relevant oneelectroncross section for ionization <strong>of</strong> O2pstates is 0.06 kB,whereas <strong>the</strong> cross section for Mo 4d states is 0.92 kB. The crosssectionweighted density <strong>of</strong> states is <strong>the</strong>refore very muchdominated by <strong>the</strong> Mo 4d contribution which is weighted by afactor <strong>of</strong> 15 relative to O 2p. 99For MoO 3 <strong>the</strong> biggest Mo 4d contribution to <strong>the</strong> occupieddensity <strong>of</strong> states is found in regions I <strong>and</strong> II toward <strong>the</strong> middle<strong>and</strong> bottom <strong>of</strong> <strong>the</strong> valence b<strong>and</strong> (see Figure 10), with only asmall contribution in region IV where <strong>the</strong> O 2p partial density<strong>of</strong> states is at a maximum. In agreement with <strong>the</strong> calculation<strong>the</strong> structure associated with III <strong>and</strong> IV appears as a shoulderFigure 9. (a) O 1s core level structure <strong>of</strong> MoO 3 after cleaning samplesin UHV at 300 °C. (b) O 1s core line <strong>of</strong> as-presented MoO 2 .(c)O1score line <strong>of</strong> MoO 2 after in situ cleaning. Note that <strong>the</strong> intensity <strong>of</strong> <strong>the</strong>high binding energy satellite peak <strong>of</strong> MoO 2 increases after <strong>the</strong> cleaningprocedure.on <strong>the</strong> low binding energy side <strong>of</strong> II in <strong>the</strong> experimentalspectrum ra<strong>the</strong>r than IV appearing as a maximum, as in <strong>the</strong>unweighted density <strong>of</strong> states. This situation is reversed in lowerenergy ultraviolet photoemission spectra where peak IV dominates<strong>the</strong> valence b<strong>and</strong> photoemission. 23 In agreement with <strong>the</strong>core level data a weak peak associated with occupied Mo 4dstates appears close to <strong>the</strong> Fermi energy. This must be associatedwith O vacancy defects to give MoO 3-x , which is no longer4d 0 . 23 Linear extrapolation <strong>of</strong> <strong>the</strong> valence b<strong>and</strong> edge to zerointensity gives a valence b<strong>and</strong> onset energy <strong>of</strong> 2.8 eV. If it isassumed that <strong>the</strong> defect states pin <strong>the</strong> Fermi energy close to <strong>the</strong>bottom <strong>of</strong> <strong>the</strong> conduction b<strong>and</strong> this onset energy is in agreementwith an indirect gap <strong>of</strong> 2.82 eV as determined by absorptionmeasurements on single crystals. 10 The width <strong>of</strong> <strong>the</strong> valenceb<strong>and</strong> is calculated to be ∼6.3 eV, which is just under <strong>the</strong> value<strong>of</strong> 7 eV measured in <strong>the</strong> present work <strong>and</strong> in ref 23. The small