Transactions - FBI - Vysoká Å¡kola báÅská - Technická univerzita ...
Transactions - FBI - Vysoká Å¡kola báÅská - Technická univerzita ...
Transactions - FBI - Vysoká Å¡kola báÅská - Technická univerzita ...

You also want an ePaper? Increase the reach of your titles
YUMPU automatically turns print PDFs into web optimized ePapers that Google loves.
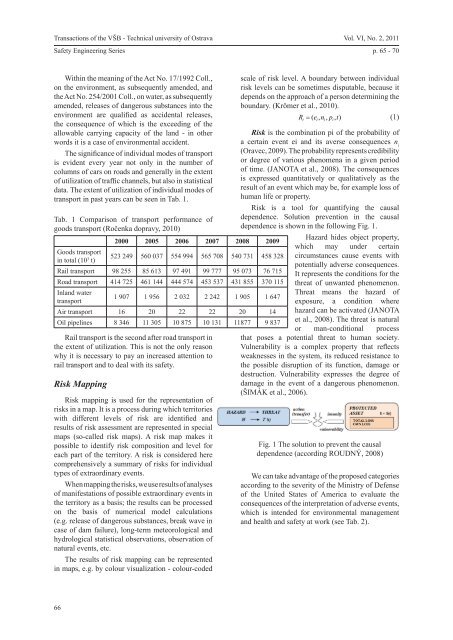
<strong>Transactions</strong> of the VŠB - Technical university of OstravaSafety Engineering SeriesVol. VI, No. 2, 2011p. 65 - 70Within the meaning of the Act No. 17/1992 Coll.,on the environment, as subsequently amended, andthe Act No. 254/2001 Coll., on water, as subsequentlyamended, releases of dangerous substances into theenvironment are qualified as accidental releases,the consequence of which is the exceeding of theallowable carrying capacity of the land - in otherwords it is a case of environmental accident.The significance of individual modes of transportis evident every year not only in the number ofcolumns of cars on roads and generally in the extentof utilization of traffic channels, but also in statisticaldata. The extent of utilization of individual modes oftransport in past years can be seen in Tab. 1.Tab. 1 Comparison of transport performance ofgoods transport (Ročenka dopravy, 2010)Goods transportin total (10 3 t)Rail transport is the second after road transport inthe extent of utilization. This is not the only reasonwhy it is necessary to pay an increased attention torail transport and to deal with its safety.Risk Mapping2000 2005 2006 2007 2008 2009523 249 560 037 554 994 565 708 540 731 458 328Rail transport 98 255 85 613 97 491 99 777 95 073 76 715Road transport 414 725 461 144 444 574 453 537 431 855 370 115Inland watertransport1 907 1 956 2 032 2 242 1 905 1 647Air transport 16 20 22 22 20 14Oil pipelines 8 346 11 305 10 875 10 131 11877 9 837Risk mapping is used for the representation ofrisks in a map. It is a process during which territorieswith different levels of risk are identified andresults of risk assessment are represented in specialmaps (so-called risk maps). A risk map makes itpossible to identify risk composition and level foreach part of the territory. A risk is considered herecomprehensively a summary of risks for individualtypes of extraordinary events.When mapping the risks, we use results of analysesof manifestations of possible extraordinary events inthe territory as a basis; the results can be processedon the basis of numerical model calculations(e.g. release of dangerous substances, break wave incase of dam failure), long-term meteorological andhydrological statistical observations, observation ofnatural events, etc.The results of risk mapping can be representedin maps, e.g. by colour visualization - colour-codedscale of risk level. A boundary between individualrisk levels can be sometimes disputable, because itdepends on the approach of a person determining theboundary. (Krömer et al., 2010).R ( e, n, p , t)(1)i i i iRisk is the combination pi of the probability ofa certain event ei and its averse consequences n i(Oravec, 2009). The probability represents credibilityor degree of various phenomena in a given periodof time. (JANOTA et al., 2008). The consequencesis expressed quantitatively or qualitatively as theresult of an event which may be, for example loss ofhuman life or property.Risk is a tool for quantifying the causaldependence. Solution prevention in the causaldependence is shown in the following Fig. 1.Hazard hides object property,which may under certaincircumstances cause events withpotentially adverse consequences.It represents the conditions for thethreat of unwanted phenomenon.Threat means the hazard ofexposure, a condition wherehazard can be activated (JANOTAet al., 2008). The threat is naturalor man-conditional processthat poses a potential threat to human society.Vulnerability is a complex property that reflectsweaknesses in the system, its reduced resistance tothe possible disruption of its function, damage ordestruction. Vulnerability expresses the degree ofdamage in the event of a dangerous phenomenon.(ŠIMÁK et al., 2006).Fig. 1 The solution to prevent the causaldependence (according ROUDNÝ, 2008)We can take advantage of the proposed categoriesaccording to the severity of the Ministry of Defenseof the United States of America to evaluate theconsequences of the interpretation of adverse events,which is intended for environmental managementand health and safety at work (see Tab. 2).66