A single-channel seismic reflection method for quantifying lateral ...
A single-channel seismic reflection method for quantifying lateral ...
A single-channel seismic reflection method for quantifying lateral ...

You also want an ePaper? Increase the reach of your titles
YUMPU automatically turns print PDFs into web optimized ePapers that Google loves.
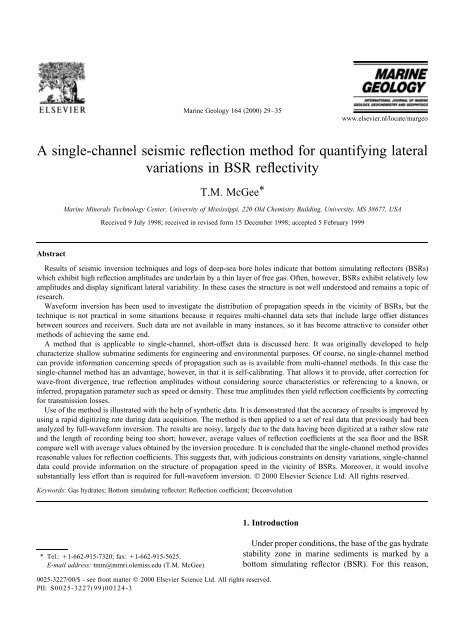
MARGO 2709Marine Geology 164 (2000) 29–35www.elsevier.nl/locate/margeoA <strong>single</strong>-<strong>channel</strong> <strong>seismic</strong> <strong>reflection</strong> <strong>method</strong> <strong>for</strong> <strong>quantifying</strong> <strong>lateral</strong>variations in BSR reflectivityT.M. McGee*Marine Minerals Technology Center, University of Mississippi, 220 Old Chemistry Building, University, MS 38677, USAReceived 9 July 1998; received in revised <strong>for</strong>m 15 December 1998; accepted 5 February 1999AbstractResults of <strong>seismic</strong> inversion techniques and logs of deep-sea bore holes indicate that bottom simulating reflectors (BSRs)which exhibit high <strong>reflection</strong> amplitudes are underlain by a thin layer of free gas. Often, however, BSRs exhibit relatively lowamplitudes and display significant <strong>lateral</strong> variability. In these cases the structure is not well understood and remains a topic ofresearch.Wave<strong>for</strong>m inversion has been used to investigate the distribution of propagation speeds in the vicinity of BSRs, but thetechnique is not practical in some situations because it requires multi-<strong>channel</strong> data sets that include large offset distancesbetween sources and receivers. Such data are not available in many instances, so it has become attractive to consider other<strong>method</strong>s of achieving the same end.A <strong>method</strong> that is applicable to <strong>single</strong>-<strong>channel</strong>, short-offset data is discussed here. It was originally developed to helpcharacterize shallow submarine sediments <strong>for</strong> engineering and environmental purposes. Of course, no <strong>single</strong>-<strong>channel</strong> <strong>method</strong>can provide in<strong>for</strong>mation concerning speeds of propagation such as is available from multi-<strong>channel</strong> <strong>method</strong>s. In this case the<strong>single</strong>-<strong>channel</strong> <strong>method</strong> has an advantage, however, in that it is self-calibrating. That allows it to provide, after correction <strong>for</strong>wave-front divergence, true <strong>reflection</strong> amplitudes without considering source characteristics or referencing to a known, orinferred, propagation parameter such as speed or density. These true amplitudes then yield <strong>reflection</strong> coefficients by correcting<strong>for</strong> transmission losses.Use of the <strong>method</strong> is illustrated with the help of synthetic data. It is demonstrated that the accuracy of results is improved byusing a rapid digitizing rate during data acquisition. The <strong>method</strong> is then applied to a set of real data that previously had beenanalyzed by full-wave<strong>for</strong>m inversion. The results are noisy, largely due to the data having been digitized at a rather slow rateand the length of recording being too short; however, average values of <strong>reflection</strong> coefficients at the sea floor and the BSRcompare well with average values obtained by the inversion procedure. It is concluded that the <strong>single</strong>-<strong>channel</strong> <strong>method</strong> providesreasonable values <strong>for</strong> <strong>reflection</strong> coefficients. This suggests that, with judicious constraints on density variations, <strong>single</strong>-<strong>channel</strong>data could provide in<strong>for</strong>mation on the structure of propagation speed in the vicinity of BSRs. Moreover, it would involvesubstantially less ef<strong>for</strong>t than is required <strong>for</strong> full-wave<strong>for</strong>m inversion. 2000 Elsevier Science Ltd. All rights reserved.Keywords: Gas hydrates; Bottom simulating reflector; Reflection coefficient; Deconvolution1. Introduction* Tel.: 1-662-915-7320; fax: 1-662-915-5625.E-mail address: tmm@mmri.olemiss.edu (T.M. McGee).Under proper conditions, the base of the gas hydratestability zone in marine sediments is marked by abottom simulating reflector (BSR). For this reason,0025-3227/00/$ - see front matter 2000 Elsevier Science Ltd. All rights reserved.PII: S0025-3227(99)00124-3
30T.M. McGee / Marine Geology 164 (2000) 29–35BSRs are commonly relied upon as indicators of gashydrates in the sea floor. The distribution of propagationspeeds in the vicinity of BSRs, as revealed by<strong>seismic</strong> reflectivity, has been investigated at severallocations worldwide by applying full-wave<strong>for</strong>minversion to multi-offset <strong>reflection</strong> data. Resultsfrom several locations indicate that BSRs characterizedby high <strong>reflection</strong> amplitudes are underlain by athin layer of free gas (Singh et al., 1993). This hasbeen confirmed by drilling (MacKay et al., 1994;Holbrook et al., 1996).Reflections from BSRs are not always high amplitude,however, and they commonly display strong<strong>lateral</strong> variability. The reasons <strong>for</strong> this are not wellunderstood. The use of wave<strong>for</strong>m inversion to investigateBSRs is limited due to the requirement ofrelatively large source/receiver offset distances. The<strong>method</strong> also involves a significant level of ef<strong>for</strong>t <strong>for</strong>processing and interpretation.This paper discusses a <strong>method</strong> <strong>for</strong> determiningvariations in BSR reflectivity that is fast and applicableto <strong>single</strong>-<strong>channel</strong> data. The <strong>method</strong> was originallydeveloped <strong>for</strong> environmental and engineeringapplications as part of the European CommunitiesMAST-1 Project GISP (Theilen et al., 1993). Itrequires that the source/receiver offset distance besmall compared to the water depth and that reflectordips not exceed a few degrees; prerequisites which areusually satisfied in the context of BSRs. It alsorequires that the data be recorded digitally untilthe onset of the second water-layer multiple; a prerequisitethat is satisfied less often.The <strong>method</strong> produces best results if the water isdeep enough that the so-called “primary sequence”,i.e. the water-bottom <strong>reflection</strong> and the coda thatfollows it (including shallow subsurface <strong>reflection</strong>s,the BSR and attendant interbed multiples) decay toinsignificance prior to the onset of the first waterlayermultiple. Also, results are improved if digitizationis done at a rapid rate, i.e. fast enough to place atleast 10 samples within the dominant wavelength ofthe <strong>seismic</strong> signal. This improves the coherencebetween the primary sequence and the analogous“first multiple sequence” that begins with the firstwater-layer multiple of the water-bottom <strong>reflection</strong>.If the coherence is high enough, a deconvolution ofthe first multiple sequence to the primary sequencecompensates <strong>for</strong> the source pulse and provides, aftercorrection <strong>for</strong> wave front divergence, a measure of thetrue amplitude of each reflected arrival. These trueamplitudes then yield <strong>reflection</strong> coefficients whencorrected <strong>for</strong> transmission losses.2. The <strong>single</strong>-<strong>channel</strong> <strong>method</strong>If the signal-to-noise ratio is high, the frequencydomain representation of the primary sequence,P… f †; may be approximated as a multiplication ofthe spectral response of the system, S… f †; with thatof the geologic layering, G… f †; i.e.:P… f †ˆS… f †G… f †…1†Under calm conditions, the surface of the water is anearly perfect (negative) reflector which reflects theupward traveling primary sequence back toward thesea floor to produce what is called a “water-layermultiple”. Each time the sequence of propagatingwavelets is reflected from the water surface, the effectof the sea floor and subbottom layers can be representedin the frequency domain as an additional multiplicationby G… f †; the minus sign accounting <strong>for</strong> thepolarity reversal that accompanies <strong>reflection</strong> from theunderside of the water surface. Thus the spectrum ofthe first multiple sequence can be written:M… f †ˆS… f †G… f †G… f †…2†At frequencies <strong>for</strong> which P… f † is not zero, Eq. (2)may be divided by Eq. (1) to obtain the negative of thespectral response of the geologic layering:M… f †=P… f †ˆG… f †…3†which may be inversely trans<strong>for</strong>med to obtain a timeseries containing the negative of the true amplitudesof primary <strong>reflection</strong>s from the sea floor and subbottominterfaces. This time series also containsmultiple <strong>reflection</strong>s internal to the geologic layers,so some interpretation is required to identify theprimary <strong>reflection</strong>s. After that is done, the <strong>reflection</strong>coefficient of any layer interface may be determinedby dividing the true amplitude of the primary<strong>reflection</strong> from that interface by the product of thetransmission coefficients of all interfaces above it.
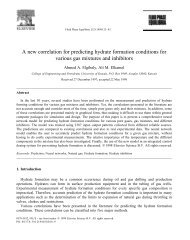
T.M. McGee / Marine Geology 164 (2000) 29–35 31Fig. 1. (a) Three portions of the two-layer synthetic <strong>reflection</strong> seismogram described in the text. (b)–(e) Convolutions of (a) with a real <strong>seismic</strong>source signature digitized at intervals of 1, 2, 3 and 4 ms, respectively. Note the progressive degradation of wavelet shape as the samplingbecomes coarser.3. Illustration using synthetic dataThe trace in Fig. 1(a) shows three intervals of aone-dimensional synthetic <strong>reflection</strong> seismogramcalculated <strong>for</strong> two layers between half-spaces. Bothsource and receiver are located immediately below thesurface of the upper layer. Two-way travel timethrough the upper layer is 3000 ms and that throughFig. 2. Results of applying the <strong>single</strong>-<strong>channel</strong> <strong>method</strong> to the traces in Fig. 1. Note the negative polarity due to <strong>reflection</strong> from the underside of thesea surface. Also note the progressive degradation of times of peak amplitudes as the sampling becomes coarser.
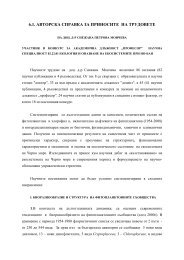
32T.M. McGee / Marine Geology 164 (2000) 29–35Fig. 3. Subset of short-offset traces from a profile offshore Costa Rica. This profile has been analyzed using full-wave<strong>for</strong>m inversion by Pecher etal. (1998). The sea floor <strong>reflection</strong>, the BSR and the first water-layer multiple are indicated.the lower is 449 ms. Reflection coefficients used in thecalculations are 1.0 at the top of the upper layer (tosimulate an air–water interface), 0.2 between thelayers (to simulate a water–sediment interface) and0.5 at the bottom of the lower layer (to simulate aBSR). The magnitudes of the coefficients have beendefined a bit larger than what would usually be realisticin order that the internal multiple between the twointerfaces be clearly visible. Theoretical values of thetrue amplitudes of the synthetic primary <strong>reflection</strong>sare calculated to be 0.20 <strong>for</strong> the sea-floor <strong>reflection</strong>and 0.48 <strong>for</strong> the BSR.The traces of Fig. 1(b)–(e) were created byconvolving Fig. 1(a) with a real <strong>seismic</strong> source signaturedigitized at sampling intervals of 1, 2, 3, and4 ms, respectively. It may be observed that the shapeof the signature becomes progressively moredegraded as the sampling becomes coarser. Thetrace of Fig. 1(d) is particularly noteworthy in thisregard. The maximum (negative) excursion of thesea-floor <strong>reflection</strong> appears truncated because no digitalsample happens to coincide with it. The maximum(positive) excursion of the BSR is also distorted, butin a different way because the time between the BSR
T.M. McGee / Marine Geology 164 (2000) 29–35 33excursions are shifted to erroneous times and theiramplitudes are as much as 20% in error.4. Application to real dataFig. 4. Enlarged portion of Fig. 3 plotted as wiggle traces.and the sea-floor <strong>reflection</strong> is not an integral multipleof the sampling interval. Such differences betweendigital wave<strong>for</strong>ms degrade their coherence and constitutea source of processing error that is entirely due tothe digitizing rate being inadequate.The traces in Fig. 2 display the result of applyingthe spectral division of Eq. (3) and inverse trans<strong>for</strong>mationto the traces in Fig. 1. Amplitudes on thetrace of Fig. 2(a) occur at the correct times and arewithin 0.1% of the theoretical values except that theyare negative due to the effect of the water surface.Amplitudes on traces of Fig. 2(b)–(e) describe waveletsthat are approximately symmetrical about theirmaximum excursions. The symmetry results fromboth primary and multiple wavelets having the samestructure, i.e. that of the source signature, and thequotient in Eq. (3) being equivalent to a deconvolutionof that structure. The symmetry degrades atcoarser sampling rates due to reduced coherencebetween numerator and denominator of Eq. (3).When the degradation is negligible, i.e. Fig. 2(b),the maximum excursions occur near the correctonset times of the reflected wavelets and the amplitudesare within a few percent of the theoreticalvalues. When the degradation is substantial, as it isin Fig. 2(d) and (e), the times of the maximumIn order to compare results obtained with real data,the <strong>single</strong>-<strong>channel</strong> <strong>method</strong> described above wasapplied to short-offset traces from a multi-<strong>channel</strong>data set previously analyzed by Pecher et al. (1998)using full-wave<strong>for</strong>m inversion.The data were acquired offshore Costa Rica inabout 3 s of water at a location where a BSR occursabout 0.5 s below the sea floor. The source was atuned airgun array and the received signals weredigitized at a 4 ms sampling interval over a totalrecording time of 8 s.A gray-scale image of 57 short-offset traces fromthe data set is shown in Fig. 3. The sea floor <strong>reflection</strong>occurs slightly below 3 s, the BSR at about 3.6 s andthe first water-layer multiple slightly below 6 s.The primary sequence extends from 3 to 6 s,approximately, and the first multiple sequencewould extend from slightly below 6 s to more than9 s had the recording time been that long. Sincecalculation of the spectral quotient of Eq. (3) is greatlysimplified when the numerator and denominator are ofthe same length, one second of zero values wasappended to the data. Undoubtedly, this is a sourceof numerical noise and introduces some error into theresults. In an ef<strong>for</strong>t to reduce such noise, data values attimes greater than 7.8 s were linearly tapered tosmooth the transition from non-zero to zero values.An enlarged portion of Fig. 3 is plotted in Fig. 4 aswiggle-traces to illustrate the wave<strong>for</strong>ms thatcomprise the sea floor and BSR <strong>reflection</strong>s. It can beseen that the dominant period of the signal is about25 m. This indicates a dominant frequency of about40 Hz.The data in Fig. 3 were corrected <strong>for</strong> sphericalspreading (at 1500 m/s which is close to the speedof propagation in water) and the spectral quotient ofEq. (3) computed after appending zeros to each trace.An enlarged portion of the output, Fig. 5, illustratesthe wave<strong>for</strong>ms from which true amplitudes weremeasured. The dominant period at the sea floor andthe BSR remains 25 ms, indicating that the deconvolutionwas not able to collapse the wave<strong>for</strong>m to any
T.M. McGee / Marine Geology 164 (2000) 29–35 35density, i.e. that there is no change in speed of propagationacross the water bottom, in order to produceprofiles of compressional speed versus depth. Fig. 6shows such a profile at the location of trace 39. Theythen calculated a <strong>reflection</strong> coefficient from the speeddecrease at the BSR by assuming that there is nochange in density across the BSR and obtained avalue of 0.057. The <strong>single</strong>-<strong>channel</strong> <strong>method</strong> producesa <strong>reflection</strong> coefficient of 0.060 at the BSR bycorrecting <strong>for</strong> transmission loss at the sea floor. Thesevalues are in good agreement. It should be noted,however, that the spectral quotient value was obtainedwithout any assumptions concerning speed or densitychanges across either the sea floor or the BSR.It can be seen in Figs. 4 and 5 that some reflectedevents occur between the sea floor and the BSR. Ifthey are primary <strong>reflection</strong>s, they would representtransmission losses that should be included in thecalculation and thereby increase the magnitude ofthe <strong>reflection</strong> coefficient obtained <strong>for</strong> the BSR. Theevents in question are rather weak, so the increasewould not be great, perhaps changing the quotedvalue to about 0.062, and there would still begood agreement with the value obtained by fullwave<strong>for</strong>minversion.It is concluded that, given proper data acquisition,the spectral quotient <strong>method</strong> can produce <strong>reflection</strong>coefficients that agree well with those produced byfull-wave<strong>for</strong>m inversion.If reasonable constraints are placed on densityvariations, the <strong>single</strong>-<strong>channel</strong> <strong>reflection</strong> coefficientscan then be used to study the structure of propagationspeed in the vicinity of BSRs. Moreover, since only<strong>single</strong>-<strong>channel</strong> data are involved, such studies wouldinvolve a significantly lower level of ef<strong>for</strong>t than domulti-<strong>channel</strong> <strong>method</strong>s.AcknowledgementsThe assistance and encouragement of Ingo Pecherin per<strong>for</strong>ming this work and the suggestions of KarinAndreassen concerning the final manuscript aregratefully acknowledged.ReferencesAndreassen, K., Hart, P.E., Grantz, A., 1995. Seismic studies of abottom simulating reflector related to gas hydrate beneath thecontinental margin of the Beau<strong>for</strong>t Sea. J. Geophys. Res. 100,12659–12673.Holbrook, W.S., Hoskins, H., Wood, W.T., Stephen, R.A.,Lizzarralde, D., 1996. Methane hydrate and free gas on the BlakeRidge from vertical <strong>seismic</strong> profiling. Science 273, 1840–1843.Hyndman, R.D., Spence, G.D., 1992. A <strong>seismic</strong> study of methanehydrate marine bottom simulating reflectors. J. Geophys. Res.97, 6683–6698.MacKay, M.E., Jarrard, R.D., Westbrook, G.K., Hyndman, R.D.,1994. Origin of bottom simulating reflectors: geophysicalevidence from the Cascadia accretionary prism. Geology 22,459–462.Pecher, I.A., Ranero, C.R., von Huene, R., Minshull, T.A., Singh,S.C., 1998. The nature and distribution of bottom simulatingreflectors at the Costa Rican convergent cargin. Geophys. J.Int. 133, 219–229.Singh, S.C., Minshull, T.A., Spence, G.D., 1993. Velocity Structureof a Gas Hydrate Reflector. Science 260, 204–207.Theilen, Fr., Ollier, G., McGee, T.M., Brussaard, P., De Batist, M.,Missiaen, T., Ori, G.G., Perini, L., Kogler, F.-Chr., Neben, S.,Omlin, A. 1993. GISP—Geophysical In-Situ Probe, FinalReport <strong>for</strong> Contract CT90-0057 of the European CommunitiesMAST-1 Programme.