A Visual Dashboard for Linked Data - Semantic Web Journal
A Visual Dashboard for Linked Data - Semantic Web Journal
A Visual Dashboard for Linked Data - Semantic Web Journal

Create successful ePaper yourself
Turn your PDF publications into a flip-book with our unique Google optimized e-Paper software.
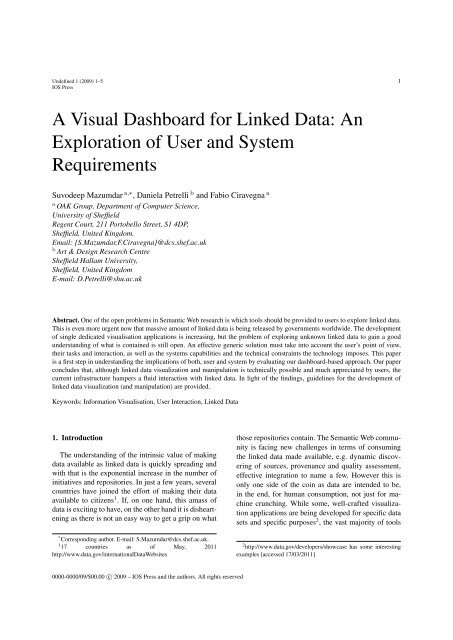
Undefined 1 (2009) 1–5 1IOS PressA <strong>Visual</strong> <strong>Dashboard</strong> <strong>for</strong> <strong>Linked</strong> <strong>Data</strong>: AnExploration of User and SystemRequirementsSuvodeep Mazumdar a,∗ , Daniela Petrelli b and Fabio Ciravegna aa OAK Group, Department of Computer Science,University of SheffieldRegent Court, 211 Portobello Street, S1 4DP,Sheffield, United Kingdom.Email: {S.Mazumdar,F.Ciravegna}@dcs.shef.ac.ukb Art & Design Research CentreSheffield Hallam University,Sheffield, United KingdomE-mail: D.Petrelli@shu.ac.ukAbstract. One of the open problems in <strong>Semantic</strong> <strong>Web</strong> research is which tools should be provided to users to explore linked data.This is even more urgent now that massive amount of linked data is being released by governments worldwide. The developmentof single dedicated visualisation applications is increasing, but the problem of exploring unknown linked data to gain a goodunderstanding of what is contained is still open. An effective generic solution must take into account the user’s point of view,their tasks and interaction, as well as the systems capabilities and the technical constraints the technology imposes. This paperis a first step in understanding the implications of both, user and system by evaluating our dashboard-based approach. Our paperconcludes that, although linked data visualization and manipulation is technically possible and much appreciated by users, thecurrent infrastructure hampers a fluid interaction with linked data. In light of the findings, guidelines <strong>for</strong> the development oflinked data visualization (and manipulation) are provided.Keywords: In<strong>for</strong>mation <strong>Visual</strong>isation, User Interaction, <strong>Linked</strong> <strong>Data</strong>1. IntroductionThe understanding of the intrinsic value of makingdata available as linked data is quickly spreading andwith that is the exponential increase in the number ofinitiatives and repositories. In just a few years, severalcountries have joined the ef<strong>for</strong>t of making their dataavailable to citizens 1 . If, on one hand, this amass ofdata is exciting to have, on the other hand it is dishearteningas there is not an easy way to get a grip on what* Corresponding author. E-mail: S.Mazumdar@dcs.shef.ac.uk.1 17 countries as of May, 2011http://www.data.gov/international<strong>Data</strong><strong>Web</strong>sitesthose repositories contain. The <strong>Semantic</strong> <strong>Web</strong> communityis facing new challenges in terms of consumingthe linked data made available, e.g. dynamic discoveringof sources, provenance and quality assessment,effective integration to name a few. However this isonly one side of the coin as data are intended to be,in the end, <strong>for</strong> human consumption, not just <strong>for</strong> machinecrunching. While some, well-crafted visualizationapplications are being developed <strong>for</strong> specific datasets and specific purposes 2 , the vast majority of tools2 http://www.data.gov/developers/showcase has some interestingexamples [accessed 17/03/2011]0000-0000/09/$00.00 c⃝ 2009 – IOS Press and the authors. All rights reserved
2 S. Mazumdar, D. Petrelli and F.Ciravegna / A <strong>Visual</strong> <strong>Dashboard</strong> <strong>for</strong> <strong>Linked</strong> <strong>Data</strong>: An Exploration of User and System Requirementsto explore linked data are based on a variation of anaggregated list. In some cases this is the best optionas the abstraction of the data itself make it difficult todisplay it otherwise, e.g. in<strong>for</strong>mation about a personand their work is properly displayed as a (web)pageand applications like Sig.ma 3 are a good example ofuser-centred display. However, although this is a solutioneasy to generalise, it cannot be considered thebest one as the aggregation of data into a list flattenthe depth of the linked data itself and could hide itsmost important characteristics. For example numericdata may be more meaningful and revealing when visualizedas graphs or plots or pie charts than as a tableor list. [5] describes that finding the right visualization<strong>for</strong> a given set of data is not a trivial task: “One mustdetermine which questions to ask, identify the appropriatedata, and select effective visual encoding to mapdata values to graphical features such as position, size,shape, and colour.”. To facilitate this investigation specifictools are needed that support looking at the samedata from different angles and, eventually, take a decisionon which visualization is the most effective <strong>for</strong>the task in hand.We propose a tool that, in a dashboard metaphor,provides consumers of linked data different visualizationsto be used simultaneously. We define “consumersof linked data” as both potential users and applicationdevelopers interested in understanding what a specificlinked data set is about. To be effective, such a tool hasto be easy to use but also easy to plug into any linkeddata set made available. This paper discusses the implementationof a generic dashboard-based visualizationframework, Points of View (.views.) and reportson the exploration of two fundamental aspects: Userneeds and System requirements. On the bases of thelessons learnt, we provide basic guidelines <strong>for</strong> the designof generic linked data applications. The paper isorganized as follows: Section 2 discusses related workand section 3 the design rationale. Section 4 discussesthe user interactions involved in the system. Section5 provides an insight into the implementation. Sections6 and 7 report our findings of user and system<strong>for</strong>mative evaluation. Section 8 discusses the proposedguidelines. An outline of the future work concludes thepaper.3 Sig.ma <strong>Semantic</strong> In<strong>for</strong>mation Mash-up http://sig.ma/ [accessed18/03/2011]2. Related Work<strong>Visual</strong>ization of linked data has focussed so farmainly on providing browsers <strong>for</strong> visualizing RDF.Applications like mSpace [14], user-composed facetsbrowsing <strong>for</strong> a classical music database, or MuseumFinland[10], a web-based pre-defined facet browsing<strong>for</strong> museum collections, provide browsing functionalitieson specific data sets. Some researchers haveaddressed the visualization of data in a generic way:Longwell [2] provides faceted browsing <strong>for</strong> arbitrarydata, but requires a domain-expert to configure the differentfacets, while Welkin 4 loads RDF models andprovides a graphical representation of the data alongwith lists of predicates and resources. Both RDF Gravity5 and IsaViz 6 are graph-based visualizations of RDFOWL graphs or ontologies: the latter uses graph visualizationsto help authoring RDF data, the <strong>for</strong>mer providesa visualization of existing RDF data. Experimentationwith large scale RDF is progressing with severaltools available to try graph 7 .In order to be generic, all these examples map thedata onto highly abstract visualisation structures likegraphs, missing out on the advantage of visual display<strong>for</strong> understanding and reasoning [5]. To providedomain-independent tools that are at the same time familiar,some approaches started from the standard webcontent and enrich it with semantic. PowerMagpie 8adds semantics to web browsing sessions by analyzingthe text of a web-page and maps the extracted conceptsto existing semantic web ontologies. Similarly, Piggy-Bank ([8]) extracts concepts from browsed pages andstores them in a local database <strong>for</strong> later facet browsingor search, e.g. sorted lists of subsequent links, dates,times etc.Closer to our intended goal of providing a generic,in<strong>for</strong>mative and intuitive visualizations on large linkeddatasets are Tabulator [11], /facet [7] and <strong>Semantic</strong>Wonder Cloud [12]. Tabulator [11] visualizes RDFdata on geographical maps, timelines and calendarviews; /facet [7] is a generic semantic browser that al-4 Welkin, http://simile.mit.edu/welkin/ [Accessed 17/03/2011]5 RDF Gravity, http://semweb.salzburgresearch.at/apps/rdfgravity/[Accessed 17/03/2011]6 IsaViz, http://www.w3.org/2001/11/IsaViz/ [Accessed17/03/2011]7 Large-scale RDF Graph <strong>Visual</strong>ization Tools,http://www.mkbergman.com/414/large-scale-rdf-graphvisualization-tools[accessed 17/03/2011]8 PowerMagpie, http://powermagpie.open.ac.uk/ [Accessed17/03/2011]
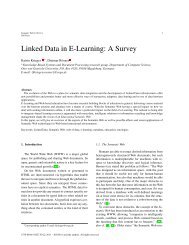
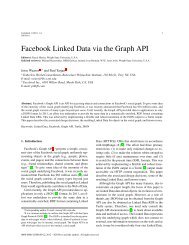
S. Mazumdar, D. Petrelli and F.Ciravegna / A <strong>Visual</strong> <strong>Dashboard</strong> <strong>for</strong> <strong>Linked</strong> <strong>Data</strong>: An Exploration of User and System Requirements 3lows the user to select the facet sequence, results arevisualized as list or on timeline enriched by concepts;and the <strong>Semantic</strong> Wonder Cloud [12] provides a mindmaplike visualization on DBpedia with large centralconcepts and satellite ones. Although closer to our intent,these three systems differ in core design decisions.Tabulator provides multiple views in differenttabs on a single page thus loading the user with thecognitive ef<strong>for</strong>t of remembering the content of a visualizationfrom one tab to the next when exploring thedata, while we intend to support visual comparison byproviding simultaneous views.As /facet and <strong>Semantic</strong> Wonder Cloud, we intendto provide visualizations of different facets, but ratherthan just displaying a preconceived view, (e.g. a timelinein /facet) or as related concepts in a simplifiedgraph (<strong>Semantic</strong> Wonder Cloud), we go a step furthermapping the data on several, specific and intuitive visualframeworks (as we attempted in [13]). However,the possibilities <strong>for</strong> visualizing data are multiple [5],many more of those we explored in [13], there<strong>for</strong>e alarger range of views is considered here. Worth noticingas it points out in the opposite direction, is the workdone in Exhibit [9]. Instead of a generic visualizationframework, Exhibit offers to the owner a simple environment<strong>for</strong> publishing data visually that a genericuser could look at and interact with. Although this approachis particularly relevant with the current trend of<strong>Web</strong> 2.0 tools and amateur web authorship, it fails insituations where the data owner is just interested in releasingit, but cannot spend ef<strong>for</strong>t on (or does not knowhow to) making that data visually accessible. This isthe case <strong>for</strong> the government data that rely on the goodwill of others to make it graphically accessible.3. The <strong>Dashboard</strong> Design RationaleA tool that provides the user with a flexible wayto look at the data from many perspectives needs tobe customizable as the most effective type of visualizationhighly depends on the data type and the taskin hand [5]. This design decision on effective customisationled to the adoption of a dashboard layout[3]. A dashboard provides simultaneous visual summariesof large sets of in<strong>for</strong>mation in a limited amountof space (here, a single web page). Effective dashboardsshould be able to provide all the in<strong>for</strong>mationin a meaningful, correct and intuitive way [3]. Whilewidely used in business in<strong>for</strong>mation systems since the80s, dashboard-like user interfaces are becoming increasinglycommon in other domains only now. Popularwebsites like igoogle 9 and BBC 10 use a design inspiredby dashboard layout, by providing contextualwidgets, each tuned to display a specific set of in<strong>for</strong>mation.The design rationale embedded in our visualisationsystem Points of View, abbreviated as .views., isto create a dashboard <strong>for</strong> generic linked data by makingvisualizations available in customizable widgets asshown in Figure 1.As linked data is given <strong>for</strong> public consumption, itis not predictable which visualization users will findmore useful given their task. For example, governmentdata on schools per<strong>for</strong>mance would be better visualizedas individual items on a map <strong>for</strong> parents tryingto decide the best choice <strong>for</strong> their children, but wouldbe more meaningful to public servants who want tocompare schools per<strong>for</strong>ming trends across the countryif it was aggregated in tables. There<strong>for</strong>e multipleviews over the same data seem to be indispensable tosupport the understanding of the value of linked dataand facilitate its use and consumption. Although weacknowledge that not all visualizations are equal andthat a specific view can show or hinder interesting phenomenain the data [5,3], we think it is important to explorethe issue of visualizing linked data as broadly aspossible, leaving the introduction of visualization constraints(i.e. which data type should be visualized, howand <strong>for</strong> which purpose) <strong>for</strong> a later stage when the basicframework has been understood. So in this work wefocus on:1. Understanding how a dashboard approach couldsupport the user in exploring unknown datasetsand appreciate the multi-faceted nature of the underlyinglinked data in a short span of time.2. Understand which are the technical implicationsand constraints to provide a generic visualizationservice over linked data, both stored locally or remotelyaccessible via endpoints, and which technicalcontraints affect the user interaction.In summary, our aim is to facilitate the visualizationof a generic linked data set in a way that is familiar,easy to understand and customise.4. User InteractionFigure 1 and Figure 2 show the same interface appliedon different data sets. The different visualisa-9 igoogle interface, http://www.google.com/ig10 BBC website, http://www.bbc.co.uk/
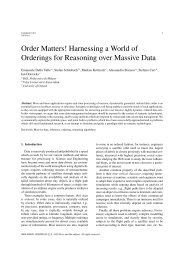
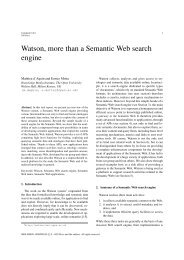
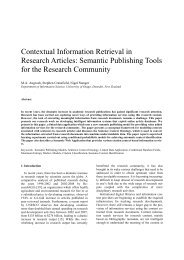
4 S. Mazumdar, D. Petrelli and F.Ciravegna / A <strong>Visual</strong> <strong>Dashboard</strong> <strong>for</strong> <strong>Linked</strong> <strong>Data</strong>: An Exploration of User and System RequirementsFig. 1. The <strong>Web</strong>-based interface <strong>for</strong> grass data with generic filters (top) and four different views on the retrieved data set, namely: tag cloud,result list, pie chart and geo-plot. (<strong>Data</strong> is courtesy of the GrassPortal(http://www.grassportal.org/) Project and Kew Gardens)tions provide complementary in<strong>for</strong>mation to the useras shown in Figure 2: the most discussed topic wasthe police (from the tag cloud top left), two areaswere affected (from the geographical view, mid right),and when twitter and flickr registered higher activities(timeline, bottom right). The different visual widgetsact on the same data set, each parsing it according tothe type of visualization they provide, e.g. geo-plottingextracting geo in<strong>for</strong>mation, timeline focussing on timevalues, etc.It is important to notice that some visualizationscould be meaningless with certain data, e.g. if timeis not provided a timeline would be empty. There<strong>for</strong>eusers can enable or disable widgets or re-arrange them(via drag-and-drop) depending on their needs and thedata in hand. For example, a numeric data would bebetter visualized as table, a pie chart or a bar chartthan as a list. The visualization widgets developed sofar include: a tag-cloud; a result list with links; a geographicalplot; a timeline; a pie chart; a bar chart (allin Figure 2). Although this list is surely not exhaustive,we were at this point more interested in providing ageneric framework that could be expanded with othervisual widgets then an exhaustive, but closed, tool. Indeed.views., acts as a visualization plat<strong>for</strong>m <strong>for</strong> linkeddata where new visualization widgets can be pluggedinas and when they are developed.Essential <strong>for</strong> an effective use is to provide simplemechanisms to query the data set. As first experimentedin [13], .views. uses the concept of dynamicquery [1]: the interface provides graphical direct manipulationwidgets, e.g. lists or slide-bars; while interacting,the user automatically queries the underliningdatabase and the data in the filtered set is displayed.This approach supports Schneidermans wellknowndesign paradigm “overview first, zoom and filter,then details-on-demand” [15]: the full set is displayedfirst, the user uses the filters to select the subsetof interest, then clicks on a view to dig into the details,e.g. at individual instances..views. provides two different types of filteringmechanisms: global and local. Global filters act on thewhole data set and affect all of the visualization widgets;local filters are attached to a single view (or widget),e.g. zooming in a geographical view to see details;clicking on a slice of a pie chart to see the relevantsubset of data. Global filters are automaticallygenerated out of the data set, while local filters could
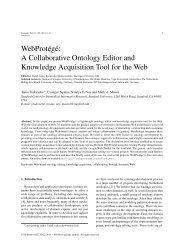
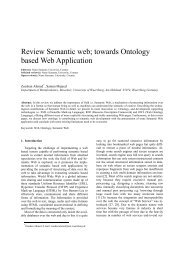
S. Mazumdar, D. Petrelli and F.Ciravegna / A <strong>Visual</strong> <strong>Dashboard</strong> <strong>for</strong> <strong>Linked</strong> <strong>Data</strong>: An Exploration of User and System Requirements 5Fig. 2. Social data after the flood in Cumbria, UK in 2007 visualised using .views. (<strong>Data</strong> harvested from Flickr(http://flickr.com) and Twitter(http://twitter.com))be already imbedded in some views (e.g. on maps) butsome need implementation (e.g. pie chart selection).Global filters are composed to retrieve the result set:items selected from a drop-down menu can be set to aspecific value <strong>for</strong> data querying (Figure 3). Local filterssupport digging-into the retrieved set from differentperspectives.Fig. 3. Global filtering <strong>for</strong> user-defined queries on the DBpediadataset. On entering the values <strong>for</strong> filters, the number of results availableis displayed in brackets.Once the system has initialized, the user makes useof the global filters to select a subset of interest fromthe entire dataset. This is done by selecting filters froma drop-down list of all the available filters. This list isautomatically generated during initialization by queryingthe backend <strong>for</strong> all the query-able concepts. Selectinga filter from the list adds the filter to the filteringinterface, and the user can type the values <strong>for</strong> the respectivefilters. The backend is then queried by makinguse of the filter values set by the user. The results ofthe query are then visualized in all of the visualizationwidgets that are available to the user. The user can thenchoose to explore individual visualizations by makinguse of local filters- like clicking on sections of aggregateplots (e.g. bar charts, pie charts etc.), zooming intogeographical maps etc. This provides a generic way ofquerying and visualizing linked data, as the user interfaceand visualizations are always shaped on the basisof the data and its strucuture and not on pre-determineddomain-specific document templates..views. provides automatic suggestions: while theuser enters the values <strong>for</strong> each global filter, SPARQLqueries are sent to the backend to provide suggestionsto the user. Figure 4 shows an example taken from thegrass data set: typing pa provides Paniceae, Parianeaeand Pappophoreae as possible values, with the num-
6 S. Mazumdar, D. Petrelli and F.Ciravegna / A <strong>Visual</strong> <strong>Dashboard</strong> <strong>for</strong> <strong>Linked</strong> <strong>Data</strong>: An Exploration of User and System Requirementsber of occurrences in the data in brackets 11 . The suggestionslisted while typing are automatically extractedfrom the data and provide an insight into the underlyingdata that could foster understanding if the user isnot familiar with the content of the set.tend, upon receiving this response, parses the JSON 13object to populate its list of concepts that will supportthe user in selecting the global filters.Fig. 4. Automatic suggestions guide users <strong>for</strong> providing the rightquery5. Architecture.views. is composed of two sub-systems: the frontendprovides visualizations and user interactions, thebackend deals solely with querying the endpoints (Figure5, backend on the left, frontend on the right).To explain the process, lets consider the flow startingfrom the user interaction when querying the DBpediaSPARQL endpoint. The user is shown an HTMLpage with default widgets: on loading the page, a scriptsends a SPARQL query to the back end to retrieveall the concepts in the dataset. An example SPARQLquery would be as follows:SELECT DISTINCT ?conceptWHERE {?s a .?s ?location.?s ?concept ?value.} ORDER BY (?concept)The example query looks <strong>for</strong> all places in DBpediathat have a reference-able geo-location, but any otherconfigurable constrain, e.g. a time frame, could be usedtoo. Once the query is passed to the backend, a PHPscript passes the query to the SPARQL endpoint usingARC 12 classes. The response from the endpoint isthen parsed by the backend and converted to JSON <strong>for</strong>mat,which is then passed to the frontend. The fron-11 This feature is disabled while querying SPARQL endpoints, asdiscussed in section 7.12 ARC RDF system, http://arc.semsol.org/Fig. 5. Architecture of the visualization interfaceOnce the user has selected the global filters and implicitlybuilt the query (as in Figure 3), .views. immediatelydisplays the number of matches in the database,number returned after another query is sent to the endpoint.An example would be:SELECT COUNT (DISTINCT ?s) AS ?count WHERE {?s .?s }This query counts the unique instances of publicuniversities that are located in the United Kingdom 14 .Clicking on the filtering interface (on 68 results availablein Figure 3) triggers the simultaneous display ofthe widgets.Unique queries (tuned by the individual widgets)are passed to the backend, which then responds withthe results provided by the endpoint (which are furtherconverted to JSON). The JSON objects are then parsedby each of the widgets in their own way to provide thespecialized visualizations 15 .13 JavaScript Object Notation, http://www.json.org/14 All the references to the filter values are as URIs and not plaintext to improve system per<strong>for</strong>mance, as discussed in Section 815 Several open-source JavaScript libraries have been used toimplement the different visualization widgets, namely Highchartscharting library, http://www.highcharts.com/ <strong>for</strong> timeline and barchart,Raphaël http://g.raphaeljs.com/ <strong>for</strong> the pie-chart and GoogleMaps http://code.google.com/apis/maps/index.html <strong>for</strong> the geovisualization.
S. Mazumdar, D. Petrelli and F.Ciravegna / A <strong>Visual</strong> <strong>Dashboard</strong> <strong>for</strong> <strong>Linked</strong> <strong>Data</strong>: An Exploration of User and System Requirements 7Once the individual widgets are loaded with theirvisualizations, the user can further interact with localfilters and drill down to individual instances or groupof homogeneous instances as in the case of maps andtag cloud. On clicking an instance, queries will be sentto the backend, which will respond with a JSON objectcontaining all the in<strong>for</strong>mation regarding that instance.JS modules then parse the object to create an HTMLstring that gets rendered on a popup dialog, as shownin Figure 6.Fig. 6. Popup dialog providing details on individual instances - here,the details on grass.This allows a separation of the user from the rawdata instances. The approach of providing aggregatedviews and combinations of data instances as visualizationsenables users to have a high-level overview of thedata. However, users can also drill-down to individualinstances of data, which provides them direct access tothe underlying data. The benefit of such a mechanismis that the users would not need to be semantic-web ordatabase experts - their interactions would identify thesubset of the data they are interested in.6. User Needs: A focus group validationAs discussed previously, it is essential <strong>for</strong> any visualizationof linked data to take into account user needs.Following a user-centred design approach [6], a groupof potential end users has been involved in the <strong>for</strong>mativeevaluation of .views. A <strong>for</strong>mative evaluation differsfrom a summative evaluation in several ways 16 : it16 A summative evaluation occurs later in the development phase,when decisions have been already taken, and aims at ascertain thestatus of the system, e.g. by measuring its usability.is done earlier in the design-development cycle, it aimsat exploring the design space (e.g. alternative possibilities)and to have an overall sense of the user reactionto the system under design. As such it uses less <strong>for</strong>maltechniques than a summative evaluation, but providericher data to support understanding and, eventually,redesign.Two sets of <strong>for</strong>mative evaluations were carried outover one year: the first evaluation used a focus grouptechnique with hands-on sessions and provided evidenceof use (via observations), participants’ commentsand suggestions that were used to re-design thesystem; the second evaluation was a usability test conductedin pairs in order to provoke a natural discussionbetween the participants and reveal what is in theirmind better than other techniques, e.g. think aloud.<strong>Data</strong> collected in this way, narratives and discussionswere analysed qualitatively, looking <strong>for</strong> emerging patternsof consensus across groups.While <strong>for</strong> the system evaluations .views. has beentested on 4 different data sets, only the grass data set 17was used <strong>for</strong> the user evaluation. The set holds ecologicaland evolutionary data collected by biologistsaround the world, grass species descriptions and theirglobal distribution and is of high interest to biologists:these were the participants involved in the two <strong>for</strong>mativeuser evaluation.The goal of the evaluation was to understand how.views. matched expert users expectations, as well asgaining feedback on its usability. Over a period of aweek, 8 students from the Animal and Plant Sciencesdepartment took part in 5 focus groups, each involving1 to 3 participants 18 . Each session lasted between1.5 hours and 2 hours; the screen interaction and thecomments were recorded <strong>for</strong> future analysis. Participantsranged from first year BSc to MSc graduates.They were first briefed on the project as a whole anda 15-minute demonstration of the data and system wasgiven. Then it was their turn to have their hands onthe system: a trace provided as a set of questions. Auser satisfaction questionnaire was then used to startthe conversation around their experience. Questions ona 5-point Likert scale were targeted to rate differentcriteria in the system ranging from ease of use to reliability.The response was overall positive: the system17 The grass data set was kindly provided by the Kew Gardens viathe GrassPortal project.18 Sessions with one participant only were due to the partner missingthe meeting. Although this is not the ideal setting, we believevaluable data were collected in the individual sessions.
8 S. Mazumdar, D. Petrelli and F.Ciravegna / A <strong>Visual</strong> <strong>Dashboard</strong> <strong>for</strong> <strong>Linked</strong> <strong>Data</strong>: An Exploration of User and System Requirementswas judged easy (72%), satisfying (72%), stimulating(78%), fast (90%) and reliable (72%).The comments from all the users were then collatedand analysed, which led to several interesting ideasemerging: users appreciated the option of adding customizedfilters to select the data of their choice. Commentslike “You can use a large number of filters andso be as specific or vague as you want. All the in<strong>for</strong>mationwas displayed well and linked together well” wereencouraging and show that our intuition about userselectedquerying was right in spite of the high number(1,090 19 ) of filter choices they had to deal with.However, the long list had drawbacks: comments like“Hard to find the required filter in the list” clearlyshow that the filtering interface needs some furtherthoughts.Apart from an alphabetical order, participants suggestedproviding frequently used filters (“Query boxcould contain a few of the more commonly used filterregion, leaf size, synonyms”) and to group theminto categories and sub-categories (e.g. general characteristics(plant duration, sexuality, height etc), region(Africa, Europe, Asia etc), part of plant (anthers,spikelets, caryopsis etc)).Some participants suggested new visualization featureswe did not <strong>for</strong>esee during the design phase:“Comparisons could be useful side by side visualizations?i.e. <strong>for</strong> one species distribution of annuals vsperennials. Could be very useful to show basic climatedata on map”. Other interesting suggestions includeto overlay the geographical map with other imageries(e.g. street map, satellite and 3D imagery) or the useof a C-S-R triangle (Competitor, Stress tolerator, Ruderal)used by ecologists and botanists to show the per<strong>for</strong>manceof a plant respect to these categories[4]. <strong>Data</strong>could then be plotted on the triangle that would becomean alternative, topological view over the data.The results from the focus group was analyzed toidentify what are the areas that needed improvements..views. was then modified to include new features,bug fixes and cosmetic changes. Features that wereadded were enabling users to replot visualization widgetson the basis of the variables that they select (afeature identified by users as essential), mechanismsto improve transferring of queries and resultsets andimproved backend to better handle different types ofqueries as well as larger results. Cosmetic changes in-19 This list, containing properties like flower color, sepal length,height of plant etc. is gathered while loading up the interface byquerying <strong>for</strong> all the properties of grassclude modifying the look-and-feel of the user interfaceto provide improved readability, adding domainspecificlabels to help domain experts understand theinterface better, removing certain pre-defined filters(that were pointed out as unhelpful by students) andimproved interaction mechanisms. The new version ofthe system was then used in the user test with computerscientists and domain experts. This was conducted sixmonths later, once the improved version of the systemwas ready <strong>for</strong> user testing. The study was conductedin three sessions of two experts working in pairs - acomputer scientist and a biologist. This pairing wasinstrumental to understand how each expert looks atand interprets the visualizations and foster discussionamong the experts. Each session lasted 30-40 minutes,and the mouse control was swapped mid-way. No prescriptivetask was given: participants were invited totry out tasks and queries that they would per<strong>for</strong>m intheir daily activities. User interactions and conversationswere logged and recorded and a user satisfactionquestionnaire was collected. Finally, all 6 participantsdiscussed their comments and suggestions as a group.The observations show a marked improvement fromthe previous focus group with students. .views. wasjudged easy to use (83%), reliable (83%), fast (83%),stimulating(87%) and satisfying(87%). Figure 7 showsthe user-satisfaction questionnaire responses of domainexperts and computer scientists(Right) as comparedto the responses <strong>for</strong> students.Inspite of the general consensus indicating a markedimprovement in the user experience of the software,it is important to assess how individual experts withdifferent expertise appreciated the system. The usersrated the system on several criteria(ten) on a 5-pointLikert scale, which were then analyzed. In the Figure8, the odd numbered users (Users 1,3,5) werecomputer science experts, whereas the even numberedusers (Users 2,4,6) were biologists. It was observedthat in general, computer science experts found difficultywith the filters and interpreting some of the visualizations.Biologists found the system easier to learn comparedto computer science experts, which could explaintheir higher level of satisfaction with the filtersand the system in general. This is likely to be due to thepartial familiarity with the data as some of the featuresused are common across the discipline.In the follow up group discussions, users commentedpositively on the intuitiveness and the generallook-and-feel of the system. Users also appreciatedthe way in which they can “quickly see how data
S. Mazumdar, D. Petrelli and F.Ciravegna / A <strong>Visual</strong> <strong>Dashboard</strong> <strong>for</strong> <strong>Linked</strong> <strong>Data</strong>: An Exploration of User and System Requirements 9Fig. 7. User-satisfaction questionnaire responses <strong>for</strong> students(Left) and domain and computer science experts(Right) show the overall improvementof the modified system.Fig. 8. User-satisfaction responses <strong>for</strong> domain experts on a 5-point Likert scale.is distributed” and “got straight to where I neededto be”. Though users seemed to have difficulty inquerying the interface, some appreciated the abilityto “click on the menu to see all the possibilities” insteadof a taxonomic view, while others disliked thedrop-down list approach. Comments like “too muchtime lost scrolling through all morphological characteristics”and “Character list should be hierarchicalso that it is easier to navigate” indicate that there issome re-thinking required regarding the filtering interface.Few users mentioned that they would like to seemore data <strong>for</strong> example, “Lack of specimen date in<strong>for</strong>mation(Collection dates)”. “The current version onlylists Accepted Names” and “The taxonomic data wasnot clear in that will the final system include both AcceptedNames and Synonyms” indicate the users wouldlike to per<strong>for</strong>m disambiguation tasks like relate severalspecies to each other.Some users found the large number of available widgetswas not always useful (“too many widgets at first,which get you a bit lost”)and showed explicit preferences(“tag clouds seem to be less useful than otherfeatures” and “geographical map not useful”) thatcould be incorporated in user profiles.The self-selected tasks showed biologists could relatethe tool to their daily work, however they expressedthe need <strong>for</strong> more datasets to be visualized.They appreciated the ability to visualize a particularfacet of the data in an aggregate visualization, and thenswap the view to a completely different facet. This wasa feature that was added in the improved version ofthe system, an outcome of the first focus group sessionwith students. Participants saw such visualization approachesas a step <strong>for</strong>ward from traditional search engines,as they could be empowered to find patterns ordistributions in very little time.Overall the two <strong>for</strong>mative evaluations were verypositive. Comments like “There is a huge amount ofin<strong>for</strong>mation available and after a while playing withthe system it is rather intuitive” and “Clear layout,
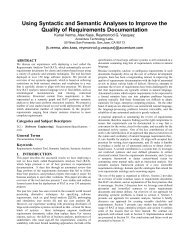
10 S. Mazumdar, D. Petrelli and F.Ciravegna / A <strong>Visual</strong> <strong>Dashboard</strong> <strong>for</strong> <strong>Linked</strong> <strong>Data</strong>: An Exploration of User and System Requirementseasy to understand and use” indicate that the dashboardapproach holds much potential. A rather interstingcomment from an expert “Clear colour presentation,gives pretty pictures very fast!” indicates theproximity of our approach to the ideal goal of an interfacedeveloper - efficiently provide aesthetically pleasingvisualizations to communicate essential in<strong>for</strong>mationto the user. Often, users are interested in gatheringa high level understanding of large datasets, ratherthan looking at individual data instances. A few commentssuch as “It was on occasion rather “hard touse” (though this may have just been inexperience)”show that there is probably room <strong>for</strong> improvement inthe intuitiveness of some parts, like the filter selection.However it should be noted that some of the difficultiescould come from the data itself, <strong>for</strong> example thelong list of filters (1,090!) the user has to go throughto select the interesting item, is an essential part of thedata structure. This evaluation clearly showed how thiskind of details have to be considered be<strong>for</strong>ehand if ageneric tool to visualize linked data has to be provided.7. System Requirements: Validation via publiclinked dataAs linked data become available from differentsources, a visualization tool should be able to take differentsets and visualize them without too much tuning,ideally without any tuning. Porting a system ontoanother domain might not be straight<strong>for</strong>ward and thetechnical implications of using a different infrastructurehave to be understood in full as certain aspectsof the interaction, e.g. system reaction time, must bekept between accepted thresholds to assure users acceptability.For example, a system is perceived as interactiveif the response time is under 2 seconds, but<strong>for</strong> direct manipulation of data the reaction time mustbe under 2 milliseconds. The portability of .views. wastested on different domains and data sources: SQLdatabases, RDF triple stores and SPARQL endpoints.To better understand the limitations developers wouldface while building user-interfaces <strong>for</strong> open linkeddata,we used a realistic and large dataset: DBpediacontains almost three and a half million resources,stored in over a billion RDF triples (version 3.5.1, releasedApr 28, 2010). This provided an excellent usecase<strong>for</strong> our research. Be<strong>for</strong>e we started implementingour system on SPARQL endpoints, we per<strong>for</strong>med severaltests on large SQL databases. These tests had indicatedthat in order to provide a fluent interaction withthe data via a user-interface, there are certain compromisesthat are required. For example, dragging a sliderto continuously query the database would cause thesystem to slow down, as it has to continuously sendqueries and parse the results. Instead, sending queriesonly when the user finishes dragging the slider (indicatedby a release of the slider handle) would makea significant improvement on the system. The systemevaluation was composed of two parts both logged andtime-stamped:1. Querying the endpoints and retrieving resultsfrom the filtering interface;2. <strong>Visual</strong>izing the result sets into 5 widgets textualresults, geographical map, pie chart, bar chart,tag cloud.The setup consisted of four cases based on the numberof results returned 100, 600, 1100 and 2200. Samplequeries like Select all the public Universities inthe United Kingdom, or Select all the places in UnitedKingdom were passed from the interface to the backend.For each case, four individual tasks were measured:time to transfer queries to the backend, timeto execute query, time to parse results and convert toJSON, and time to transfer JSON objects to the frontend.The frontend was evaluated by timing the per<strong>for</strong>manceof each visualization widget. Figure 9 shows therelative response times <strong>for</strong> the DBpedia endpoint (increasein the result size maps: 100=1, 600=2, 1100=3,2200=4). The time taken <strong>for</strong> the backend to process thequery and send the results to the frontend varied from123.78ms to 6.9s, with the query execution time varyingfrom 98ms to 6.85s. For most of the cases (60%),the time taken <strong>for</strong> executing the query took more than70% of the backend processing time. In order to see ifthere were computational bottlenecks or patterns thatcould be optimized, data was normalized to highlightthe proportion among the different phases. Figure 9plots the distribution of the 4 tasks and show severalinteresting points:– The overall time taken by the backend is highlydependent on either the query execution time orthe time taken to transfer the results to the frontendas they take the maximum time to complete.– The overall time taken by the backend is highlyvariant.– The time taken <strong>for</strong> transferring the query to thebackend and the time <strong>for</strong> converting the results toJSON objects is negligible compared to the othertwo.
S. Mazumdar, D. Petrelli and F.Ciravegna / A <strong>Visual</strong> <strong>Dashboard</strong> <strong>for</strong> <strong>Linked</strong> <strong>Data</strong>: An Exploration of User and System Requirements 11Fig. 9. Plots showing the extremely high variation of query execution phase (98ms to 6.85s) in the backend processing. The size of the results (1- 2200 results returned, 2 - 1100 results returned, 3 - 600 results returned and 4 - 100 results returned) are shown as individual bars on the y-axis,and the differently shaded x axis bars show the time taken to per<strong>for</strong>m individual functions to retrieve the respective results. The plots show therelative times in different parts of the systemA major concern is the query execution time, the variationof which is alarming and cannot be controlled.While it this could be attributed to high server loador the way queries are distributed, this is an importantaspect that user interface developers need to take intoconsideration. The system tests show that though thequery execution phase often takes a lot of time to complete,there are other phases in the backend processingthat can be significantly improved. More investigationis needed to understand the causes of the delays intransferring the result objects to the frontend and furtheroptimize this step.This high variability in the query processing stage isin contrast to the per<strong>for</strong>mance achieved by traditionaldatabases. In a similar experiment with a MYSQLdatabase, we tested how the backend per<strong>for</strong>ms withsimilar query-result sets. The speed, in general variedbetween 0.00026ms and 6.48ms. However, the relativetime taken by the query processing stage has mostlybeen consistent. It is however important to note thatthe tests conducted with a MYSQL database are not intendedto compare the absolute times taken by a linkeddata endpoint and a traditional database, but is to highlightthat in comparison with a traditional database, interfacedevelopers may face challenges with high variabilityin the response times. Figure 10 shows the contrastingper<strong>for</strong>mance of a traditional database.
12 S. Mazumdar, D. Petrelli and F.Ciravegna / A <strong>Visual</strong> <strong>Dashboard</strong> <strong>for</strong> <strong>Linked</strong> <strong>Data</strong>: An Exploration of User and System RequirementsFig. 10. A traditional database being used as the backend - as expected, most of the times the query processing stage takes the longest times,however this is a consistent behaviour.8. Discussion and GuidelinesTo better understand the constraints <strong>for</strong> an effectiveand generic approach to the user-centred visualizationof linked data, both user and system aspects have tobe taken into account. There<strong>for</strong>e both a <strong>for</strong>mative userevaluation and a testing of the backend per<strong>for</strong>mancewere needed to better understand pitfalls and potential.This section pulls together the results of the two evaluationsand discusses which points have to be taken intoaccount when designing user interfaces to linked data.Our initial intuition was that the response from publiclyavailable SPARQL endpoints would be quite slowas compared to querying a local database; the systemtests proved that the real problem is the inconsistenttime laps of the query execution phase, a far greaterchallenge, as it cannot be fully controlled. Reflectingon the implications <strong>for</strong> the user interface and the interaction,these basic guidelines can be considered:8.1. Instance CountsProviding instance counts (while entering textualqueries, slider actions or selecting checkboxes etc)should be handled with care. We have often found thatdue to the delay (in processing of a previous query) inthe backend, the results being passed to the frontend(thereby parsed and rendered in the frontend) over-
S. Mazumdar, D. Petrelli and F.Ciravegna / A <strong>Visual</strong> <strong>Dashboard</strong> <strong>for</strong> <strong>Linked</strong> <strong>Data</strong>: An Exploration of User and System Requirements 13write the recent results. For our implementation, timeoutsof 200ms from the frontend were introduced sothat it would prevent delayed results from previousqueries over-writing recent results. Another suggestionwould be to add user interventions be<strong>for</strong>e sendingqueries to the backend e.g. pressing enter to retrieveinstance counts.8.2. Dynamic QueryingReal-time querying via generic filters (e.g. draggingsliders to update visualizations dynamically) couldcause the system severe delays as queries are continuouslyfired creating a backing of unresolved requests.To overcome this problem three solutions are possible:provide user interventions be<strong>for</strong>e passing queriesto the backend; prevent continuous dynamic queryingby providing only discreet interface items; cache theresult of a query and use the dynamic filtering on theretrieved set, but in this case only restrictions of theset will be possible. Our implementation focussed onthe first solution mainly due to the fact that it does notpose any restrictions on the interactivity of the queryinginterface.8.3. Automatic SuggestionsAutomatic suggestions were disabled, as responsesfrom the backend were often late and could overwritemore recent suggestions, as explained in a previouspoint. As the backend processing was time-exhaustive,we decided to disable searching using regular expressions.Instead, queries are presently per<strong>for</strong>med usingURIs. Doing so does not put any demands on the endpointto process regular expressions, thereby makingthe backend respond quickly.8.4. Aggregate QueriesWhen large result sets were returned from the backend,there was a significant delay in loading up aggregatevisualizations pie chart, bar chart and tag clouds.We perceive two solutions to this limit the response todisplay the top few results or provide the results progressively.We decided to take the first approach as itprovides a comparatively lesser amount of data (oftenthe most important bit) to process. In our implementation,the users however have the option of the entireresult set, if they choose to do so. Doing so improvedthe per<strong>for</strong>mance significantly to an average of30.5 ms from 1059.6 ms. However, the inconsistencyof the SPARQL endpoints still remain. Apart from reducingthe time taken to process the queries (and results),this helped in providing a more readable visualization.Figure 11 shows the improvement in the barchart widget when this was done. The figure on the leftshows the aggregate results be<strong>for</strong>e any limits applied.The figure on the right shows the improved readabilityachieved by applying limits.8.5. Textual ResultsAs can be seen from Figure 9, the query executiontime <strong>for</strong> the text result widget was high. Further on,higher instance matches result in further delays sinceit takes more time to process large data objects. Textualresult can then be presented on request in a separateoverlapping layer i.e by providing only a window(as a page) of the entire result set (Figure 12). This solutionreduces time and improves readability. Thereby,instead of sending one highly time consuming query,we modified the system to send several short querieswhen required.The above mentioned guidelines are often adoptedby software developers in order to cope with unreliableor slow databases. Several other software engineeringapproaches can be adopted <strong>for</strong> improving the systemper<strong>for</strong>mance like caching results, interacting with localdatasets, engineering SPARQL queries to providequicker responses etc. However, our intention of evaluatingthe system limitations is to understand how goodpractices in visualization can be harmonically alignedwith the current system infrastructure, keeping the userexpectations in mind. We have realized that the unreliabilityof the linked data endpoints may create issues(like delays, timeouts etc) in user interfaces as well asdeactivation of essential functionalities, which can adverselyaffect the user experience. In order to adhere tospecific guidelines established by the in<strong>for</strong>mation visualizationcommunity, the backend infrastructure needsto provide a consistent per<strong>for</strong>mance. Our ef<strong>for</strong>ts arein understanding what are the existing infrastructureproblems faced by interface developers, and to benchmarksuch systems against the per<strong>for</strong>mance of traditionaldatastores, from a developer/consumer’s point ofview.Our focus group sessions have been instrumentalin identifying how we can generalize user needs andexpectations <strong>for</strong> exploring unknown datasets and domains- trans<strong>for</strong>ming an intuition into a concrete approach.The discussions with domain experts, computerscience professionals and students have indi-
14 S. Mazumdar, D. Petrelli and F.Ciravegna / A <strong>Visual</strong> <strong>Dashboard</strong> <strong>for</strong> <strong>Linked</strong> <strong>Data</strong>: An Exploration of User and System RequirementsFig. 11. Improving readability (and speed) by limiting results <strong>for</strong> aggregate queries. Both figures show identical in<strong>for</strong>mation (e.g., most resourcesare in London). However, the first widget is almost illegible.Fig. 12. Improving readability <strong>for</strong> textual results providing a page view of large result sets. Note the scroll bar <strong>for</strong> both figures indicating thenumber of textual results contained in the widget.cated that such a generic approach is much appreciated,specially when data is provided to users unfamiliarwith semantic web technologies. Majority of thefocus-group participants were not conversant with semanticweb principles and query languages - in orderto be accepted by a wide audience, there mustbe a complete separation of users from raw semanticdata. By providing multiple means of querying theunderlying data (global filters and local filters), weequip users with different interaction mechanisms toexplore their datasets. However, being completely unawarethat each subsequent interactive step results inSPARQL queries being sent to the backend. This transparencyis important to a user - as end user’s interestlies in understanding their data - not by writing complexscripts and queries, but by quick, seamless andfluid navigational and interaction techniques. However,by being able to drill down into individual datainstances, the users will always have access to theirdata.Apart from understanding the potential impact ofthe system architecture on user expectations and experience,our approach has also been to understand howwe can provide a generic visualization framework. Thedashboard approach has been applied over the years tocater to different requirements <strong>for</strong> different domains..views. is capable of porting to several backends - traditionaldatabases as well as linked data or triplestores.The flexibility offered by such systems seems to beideal <strong>for</strong> a linked data visualization framework - developerscan contribute by creating ‘add-on’ visualizationwidgets that cater to specific domains or data types;users can select which visualization widgets they preferto use and in which order; users can select sectionsof the visualizations within individual widgetsto further investigate areas of interest; data owners
S. Mazumdar, D. Petrelli and F.Ciravegna / A <strong>Visual</strong> <strong>Dashboard</strong> <strong>for</strong> <strong>Linked</strong> <strong>Data</strong>: An Exploration of User and System Requirements 15can use such framework to quickly explore their owndatasets, shared data or even organizational data. It isalso the familarity of the users with systems followingthe dashboard approach that has influenced our designchoices - the users would not need to be trained in usingdashboards as they almost unknowingly use suchsystems daily (BBC, igoogle, etc).9. ConclusionEveryday more linked data is made available to thepublic <strong>for</strong> consumption, e.g. citizens interested in governmentpolicy or developers of linked data applications.However, there is no generic interface <strong>for</strong> exploringunknown linked data set available today, and,as a matter of fact, only <strong>Semantic</strong> <strong>Web</strong> people couldlook into those repositories and, even them, with difficulties.To be able to create effective interactive visualizations,a deeper and better understanding of the implicationsof the current technical setting and the userrequirements are needed. Our portability experimentswith several different domains indicate that we can use.views. as a generic exploratory tool. This paper is afirst step in this direction: the idea of multiple and simultaneousvisualizations was well received by users,but when the setting effective and efficient on a localdatabase was tested with public SPARQL endpoints(DBpedia) the poor and patchy result push us to reconsidersome design proposals. A <strong>for</strong>mative user evaluationwas carried out in focus group sessions in orderto define which interface features were considered essential.One was the automatic suggestion of possiblevalues <strong>for</strong> selected filters, as this would allow a preexplorationof the available data. However this featureis not available <strong>for</strong> online data sets, due to the slownessand unpredictability of the endpoint reply. A possiblesolution would be to load all the possible unique instancesof a concept during initiation, but the implicationsof this approach <strong>for</strong> a large datasets such as DBpedianeed to be understood. Indeed the type of dataand the technical setting (local vs. endpoints) has asubstantial impact on the user interface. For examplesa data set may not have in<strong>for</strong>mation <strong>for</strong> certain visualizationwidgets, e.g. no date as in the grass data set.A final remark goes to the flexibility of multiple visualizationsavailable to the user. If this on one handis considered very positively on the other could generatemisinterpretation of data if an unsuitable visualizationis applied to a given data set [5,3]. More workis needed to better understand which type of visualizationwould fit which type of linked data so that thevisualization interface could embed those constraintsand reduce the risk of data misinterpretation.10. AcknowledgementsThis research is funded by the Samulet projectfunded by Rolls-Royce plc. and the Technology StrategyBoard. We gratefully acknowledge their support.We thank our focus group attendees <strong>for</strong> their cooperationand extremely helpful suggestions and we aregrateful to the GrassPortal project <strong>for</strong> providing uswith invaluable support.References[1] Christopher Ahlberg, Christopher Williamson, and Ben Shneiderman.Dynamic queries <strong>for</strong> in<strong>for</strong>mation exploration: an implementationand evaluation. In Proceedings of the SIGCHIconference on Human factors in computing systems, CHI ’92,pages 619–626, New York, NY, USA, 1992. ACM.[2] M. Butler, D. Huynh, B. Hyde, R. Lee, and S. Mazzocchi.Longwell project page, 2006.[3] Stephen Few. In<strong>for</strong>mation <strong>Dashboard</strong> Design: The Effective<strong>Visual</strong> Communication of <strong>Data</strong>. Number 3900693099.O’Reilly Media, 2006.[4] J. P Grime. Vegetation classification by reference to strategies.Nature, 250:26 – 31, 1974.[5] Jeffrey Heer, Michael Bostock, and Vadim Ogievetsky. A tourthrough the visualization zoo. Communications of the ACM,53(10.1145/1743546.1743567):59–67, 2010.[6] M. D. Helen Sharp, D. Yvonne Rogers Ph, and M. D.Jenny Preece. Interaction Design: Beyond Human-ComputerInteraction. Wiley, 2 edition, March 2007.[7] Michiel Hildebrand, Jacco van Ossenbruggen, and LyndaHardman. /facet: A Browser <strong>for</strong> Heterogeneous <strong>Semantic</strong> <strong>Web</strong>Repositories. In Isabel Cruz, Stefan Decker, Dean Allemang,Chris Preist, Daniel Schwabe, Peter Mika, Mike Uschold, andLora M. Aroyo, editors, The <strong>Semantic</strong> <strong>Web</strong> - ISWC 2006, volume4273 of Lecture Notes in Computer Science, chapter 20,pages 272–285. Springer Berlin Heidelberg, Berlin, Heidelberg,2006.[8] D. Huynh, S. Mazzocchi, and D. Karger. Piggy bank: Experiencethe semantic web inside your web browser. <strong>Web</strong> <strong>Semantic</strong>s:Science, Services and Agents on the World Wide <strong>Web</strong>,5(1):16–27, March 2007.[9] David F. Huynh, David R. Karger, and Robert C. Miller. Exhibit:lightweight structured data publishing. In Proceedings ofthe 16th international conference on World Wide <strong>Web</strong>, WWW’07, pages 737–746, New York, NY, USA, 2007. ACM.[10] Eero Hyvönen, Eetu Mäkelä, Mirva Salminen, Arttu Valo, KimViljanen, Samppa Saarela, Miikka Junnila, and Suvi Kettula.Museumfinland–finnish museums on the semantic web. <strong>Web</strong><strong>Semantic</strong>s: Science, Services and Agents on the World Wide<strong>Web</strong>, 3(2-3):224 – 241, 2005. Selcted Papers from the International<strong>Semantic</strong> <strong>Web</strong> Conference, 2004 - ISWC, 2004.
16 S. Mazumdar, D. Petrelli and F.Ciravegna / A <strong>Visual</strong> <strong>Dashboard</strong> <strong>for</strong> <strong>Linked</strong> <strong>Data</strong>: An Exploration of User and System Requirements[11] Tim B. Lee, Yuhsin Chen, Lydia Chilton, Dan Connolly, RuthDhanaraj, James Hollenbach, Adam Lerer, and David Sheets.Tabulator: Exploring and analyzing linked data on the semanticweb. In In Procedings of the 3rd International <strong>Semantic</strong> <strong>Web</strong>User Interaction Workshop (SWUI06), page 06, 2006.[12] Roberto Mirizzi, Azzurra Ragone, Tommaso Di Noia, and EugenioDi Sciascio. <strong>Semantic</strong> wonder cloud: Exploratory searchin dbpedia. In Florian Daniel and Federico Facca, editors, CurrentTrends in <strong>Web</strong> Engineering, volume 6385 of Lecture Notesin Computer Science, pages 138–149. Springer Berlin / Heidelberg,2010. 10.1007/978-3-642-16985-4_13.[13] Daniela Petrelli, Suvodeep Mazumdar, Aba-Sah Dadzie, andFabio Ciravegna. Multi visualization and dynamic query <strong>for</strong>effective exploration of semantic data. In Abraham Bernstein,David Karger, Tom Heath, Lee Feigenbaum, Diana Maynard,Enrico Motta, and Krishnaprasad Thirunarayan, editors, The<strong>Semantic</strong> <strong>Web</strong> - ISWC 2009, volume 5823 of Lecture Notes inComputer Science, pages 505–520. Springer Berlin / Heidelberg,2009. 10.1007/978-3-642-04930-9_32.[14] M.C. Schraefel, Max Wilson, Alistair Russell, and Daniel A.Smith. mspace: improving in<strong>for</strong>mation access to multimediadomains with multimodal exploratory search. Commun. ACM,49:47–49, April 2006.[15] Ben Shneiderman. The eyes have it: A task by data type taxonomy<strong>for</strong> in<strong>for</strong>mation visualizations. In VL ’96: Proceedings ofthe 1996 IEEE Symposium on <strong>Visual</strong> Languages. IEEE ComputerSociety, 1996.