Statistical DSP (pdf) - jdsp
Statistical DSP (pdf) - jdsp
Statistical DSP (pdf) - jdsp
- No tags were found...

Create successful ePaper yourself
Turn your PDF publications into a flip-book with our unique Google optimized e-Paper software.
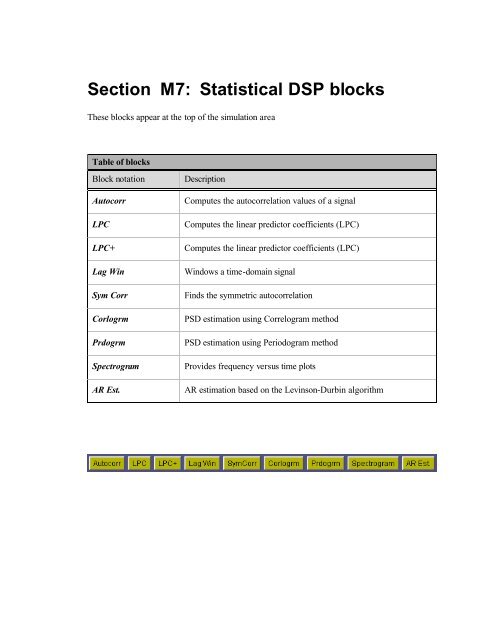
M7.2Block name : Linear prediction coefficients Notation: LPCDescription: This block computes the linear predictor coefficients (LPC) based on the Levinson-Durbin algorithm.Pin assignment:3> Pin Description1 Time-domain signal, x(n)>1 2 Autocorrelation sequence, r xx (m)4> 3 LP coefficients, a i>2 4 Residual signal, e(n)56Dialog window(s):(a)LPC dialog windowScript use:Name: LPCExample code: Equation(s) Implemented :Residual signal is given by, en ( ) = xn ( ) − axn ( −i)p∑i=11LP synthesis filter is given by, H()z =p1+ ∑az−i iii=1iM7-3
M7.4Block name : Lag window Notation: Lag. WinDescription: This block windows the input signal with a user-defined window function. Thewindow functions available are: Hamming, Hanning, rectangular, Bartlett, Blackman, and Kaiser.The maximum window length is 256 samples.Pin assignment:Pin Description1 Autocorrelation sequence, r xx (m)2 Windowed autocorrelation, r w (m)>1 2> 3456Dialog window(s):(a)Lag. Win dialog windowScript use:Name: lagwindowExample code: Equation(s) Implemented :wrxx( m) = wmr ( )xx( m)r xx (m) is the autocorrelation sequence and r w xx(m) the windowed autocorrelation.M7-5
M7.5Block name : Symmetric correlation Notation: Sym. Corr.Description: This block makes the autocorrelation lags, r xx symmetric so that they can be usedwith the FFT block in order to calculate the power spectral density (PSD). Symmetry of theautocorrelation sequence around 0 is modified to symmetry around the edgesPin assignment:Pin Description1 Autocorrelation sequence, r xx (m)2 Symmetric autocorrelation sequence, r (s) xx (m)>1 2> 3456Dialog window(s):(a)Sym.Corr. dialog window and output valuesScript use:Name: symcorrExample code: Equation(s) Implemented:r(s)xx(N-m) = r (m);where n = FFT size and m = number of lagsFor example if the FFT size, N = 8, and the number of lags is 3, thenr (s) xx(8) = r xx (0), r (s) xx(7)= r xx (1), r (s) xx(6)= r xx (2), and so on.xxM7-6
M7.6Block name : Correlogram Notation: CorrelogramDescription: This block computes a PSD estimate by performing an FFT on the symmetricautocorrelation sequence.Pin assignment:Pin Description1 Symmetric autocorrelation sequence, r (s) xx (m)2 PSD estimate, R xx (k)>1 2> 3456Dialog window(s):(a)Correlogram dialog windowScript use:Name: corrlogExample code: Equation(s) Implemented :N = the length of the sequenceN 1⎡j2πkm⎤1 ⎡ − −(s)⎢ N ⎥⎤⎣ ⎦Rxx( k) = ⎢∑rxx(m) e ⎥N ⎢⎣m= 0⎥⎦M7-7
M7.7Block name : Periodogram Notation: Prdogm.Description: This block estimates the power spectral density (PSD) by operating directly on thedata set. Two different periodograms can be used to estimate the PSD: sample spectrum or Welchperiodogram. The user can specify the number of “smooth over” points to implement the Daniellperiodogram over the sample or the Welch periodograms.Pin assignment:Pin Description1 Input x(n)2 PSD estimate, R xx (k)>1 2> 3456Dialog window(s):(a) Prdogm dialog window and output valuesScript use:Name: periodgmExample code: Equation(s) Implemented :The sample spectrum of the p th frame is given by,22N −1j π kn1−p p Nxx( ) ( ) ( )N n=0R k = ∑ wnx ne ,Welch periodogram,Pw 1 pRxx( k) = ∑ Rxx( k)P p = 1w(n) = window, x p (n) = The p th frame of the time-domain input signal.RRwxxpxx( k ) = Welch PSD estimate of all the frames.( k ) = Sample PSD estimate of the p th frame.M7-8
M7.8Block name : Spectrogram Notation: SpectrogramDescription: This block calculates the spectrogram (frequency versus time plot) of the giveninput signal. The window types available are: Hamming, Hanning, rectangular, Gaussian,Bartlett, and Kaiser. The window length, the number of FFT points and the resolution can bespecified by the user. By moving the cursor on the plot, the normalized magnitude, and the x-ycoordinates can be viewed.Pin assignment:Pin Description1 Time-domain signal, x(n)2>1 3456Dialog window(s):(a) Spectrogram dialog windowScript use:Name: specgramExample code: M7-9
M7.10Block name : AR estimator Notation: AR Est.Description: This block computes the AR coefficients and plots the auto-regressive spectrum ofthe input signal using the Levinson-Durbin algorithm. The following lag windows are available:rectangular, Hamming, triangular, and Gaussian. The maximum number of AR coefficientsallowed = 64.Pin assignment:3> Pin Description1 Time-domain signal, x(n)2 LPC spectrum, R AR xx(k)>1 2> 3 AR coefficients, a i456Dialog window(s):(a) AR Est. dialog windowScript use:Name: AREstExample code: Equation(s) Implemented :2RARxx1(k) =P1 + ∑ az −iHere, a i = Linear Prediction (LP) coefficients and N is the order of the LP filteri = 1iM7-10