Public Health Planning - Baw Baw Shire Council
Public Health Planning - Baw Baw Shire Council
Public Health Planning - Baw Baw Shire Council
- No tags were found...
Create successful ePaper yourself
Turn your PDF publications into a flip-book with our unique Google optimized e-Paper software.
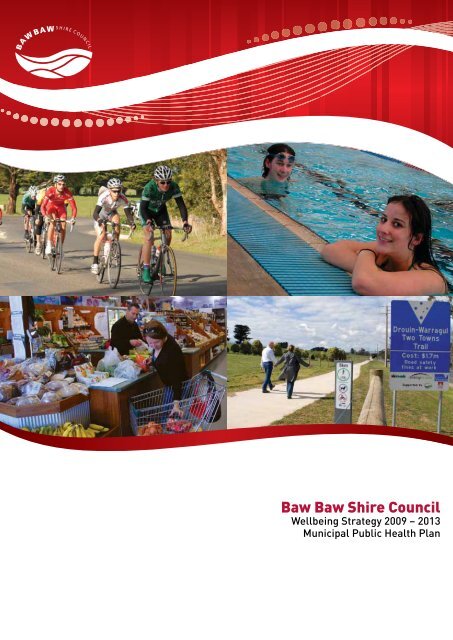
Challenge the boundaries, be the difference<strong>Baw</strong> <strong>Baw</strong> <strong>Shire</strong> <strong>Council</strong>Wellbeing Strategy 2009 – 2013Municipal <strong>Public</strong> <strong>Health</strong> Plan
Document ControlOriginal Author: Leslie SmithVersion: 1.0Save Date: 13/03/09VersionsVersion Release Date Author Summary of changes made1.0 13 Feb 2009 Leslie Smith Initial Release to <strong>Council</strong>1.1 13 March 2009 Leslie Smith Initial Release for CommunityConsultation2.0 12 August 2009 Yvonne Magyar Draft for <strong>Council</strong> Briefing2.1 23 September 2009 Yvonne Magyar Final draft
Mayor’s noteThe local Government sector is responsible for a range of services that affect the day today welfare of our community including garbage collection, safe street lighting, cleanparks and the provision of libraries and sporting grounds. <strong>Baw</strong> <strong>Baw</strong> shire is no different.One area that is extremely important to our people’s happiness is health and well being.In our shire, council is duty bound to deliver a range of health services to keep peoplewell and/or improve their health. These services include home and personal care tovulnerable, older or disabled people, childcare, community health centres, also providingadvice to new parents and immunisation services. With the unprecedented growth in ourshire we need to be on top of our changing demographics and population profile so theseservices are adequate and able to cope with the demands put on them. With that ourservices need to be coordinated and guided by an overarching strategy which is focused,relevant, and puts people’s health and wellbeing at the forefront of council’s decisionmaking.This strategy, the <strong>Baw</strong> <strong>Baw</strong> Wellbeing Plan 2009 – 2013, has been developed to guide thedirection of the provision of health services to help keep our community happy and well.The strategies and actions that are outlined in this plan will enable better planning andcoordination of services throughout our local community and will enable the greatest ofhealth outcomes.This strategy is a key component of our <strong>Baw</strong> <strong>Baw</strong> <strong>Shire</strong> <strong>Council</strong> Plan (2009-2013), whichhas a key objective to “create healthy and proud communities” by improving health andwellbeing for everyone. We aim to achieve this by encouraging the whole communityto enjoy and contribute to an attractive and culturally vibrant community. We are alsoplanning and budgeting to improve the infrastructure and facilities that the communityuses in conjunction with this plan.<strong>Council</strong> intends to use the Strategy and Action Plan as the blueprint to address healthand wellbeing issues over the next five years. The plan will help us identify where thepriorities are to improve wellness in our community and also sets out the strategies weneed to put in place to get us there.I would like to congratulate all those who have been involved or contributed to developingthis plan, especially the forward thinking community members who worked with councilstaff and other stakeholders to put up their ideas and suggestions for the plan.Embrace the plan; it is your guide for helping improve the health and wellbeing of <strong>Baw</strong><strong>Baw</strong> shire residents.If we are all healthy then we are all happy.Yours truly, Cr. Adam TysonMayor <strong>Baw</strong> <strong>Baw</strong> <strong>Shire</strong> <strong>Council</strong>I iii
Executive Summary<strong>Baw</strong> <strong>Baw</strong> <strong>Shire</strong> is located in West Gippsland about an hour SouthEast of the Melbourne CBD. The <strong>Shire</strong> is made up of over 100localities with Warragul the largest town closely followed by Drouin.Rolling green hills, towns, mountains and high agricultural landmake up this 3,855 square kilometre municipality. With a currentpopulation of 37,180 (2006 Census data) this figure is expected togrow to almost 48,000 by 2031.Local government is in a unique position to create positivechange in the health and wellbeing of local people, and has astrong commitment to improve health and wellbeing through itsimportant role in health promotion, strategic planning, leadership,advocacy and service delivery across the <strong>Baw</strong> <strong>Baw</strong> <strong>Shire</strong>. <strong>Council</strong>has the ability to contribute to and utilise its networks and workcollaboratively with the community and Integrated <strong>Planning</strong>stakeholder agencies to positively address key health and wellbeingpriority areas at a local level. This is why the <strong>Baw</strong> <strong>Baw</strong> WellbeingStrategy 2009 – 2013 has been developed in partnership with adiverse range of groups, community and stakeholder organisations.Priority areas and strategies to protect and improve public healthand wellbeing have been developed based on an analysis of a rangeof key characteristics including projected changes in communitydemographics, income, employment, education, life expectancy,death and morbidity data and disadvantage within the <strong>Baw</strong> <strong>Baw</strong>community.The <strong>Baw</strong> <strong>Baw</strong> Wellbeing Action Plan 2009 – 2013 (hereafter referredto as the action plan) complements the Strategy by outlining in detailkey priority areas, specific strategies, actions, timelines and partnersfor action. An implementation and evaluation plan has also beendeveloped which provides the means for assessing our effectivenessin protecting and promoting health and wellbeing, and mitigatinginequalities into the future.The action plan contains goals and strategies to improve local factorsaffecting health and wellbeing in the <strong>Shire</strong> and is based on social andenvironmental action rather than individual treatment.iv I
Table of ContentsMayor’s note...................................................................................................................iiiExecutive Summary......................................................................................................iv1. Introduction.................................................................................................................12. <strong>Public</strong> <strong>Health</strong> and Wellbeing Plans (Municipal <strong>Public</strong> <strong>Health</strong> Plans)...........................2Social Determinants of <strong>Health</strong>.............................................................................2Framework for <strong>Planning</strong>......................................................................................33. Integrated <strong>Planning</strong>....................................................................................................64. Demographics Characteristics..................................................................................7Population.............................................................................................................7Income.................................................................................................................10Employment........................................................................................................11Education.............................................................................................................12Gambling.............................................................................................................125. <strong>Health</strong> Characteristics.............................................................................................14Burden of Disease...............................................................................................14SEIFA data...........................................................................................................16Community Indicators........................................................................................17General <strong>Baw</strong> <strong>Baw</strong> <strong>Health</strong> and Wellbeing Statistics..........................................186. <strong>Baw</strong> <strong>Baw</strong> Wellbeing Action Plan 2009 – 2013 Priority Areas.................................19Appendix 1 - Further Reading and Resources...........................................................20I v
1. IntroductionMunicipal <strong>Public</strong> <strong>Health</strong> Plans were introduced into Victorian publichealth legislation (<strong>Health</strong> Act 1958) in 1988 as part of world widerecognition of the importance to plan for health and wellbeing at thelocal level. Municipal <strong>Public</strong> <strong>Health</strong> Plans are one of only three plans(<strong>Council</strong> Plan and Municipal Strategic Statement) that council’s arerequired to develop by legislation. While legislation states that every<strong>Council</strong> must develop a Municipal <strong>Public</strong> <strong>Health</strong> Plan, public healthand wellbeing planning for <strong>Baw</strong> <strong>Baw</strong> <strong>Shire</strong> involves much more thanfulfilling these legislative requirements. It is about developing astrategic and integrated plan that is informed by local health needs andpriorities, is responsive to both the community’s current needs and toemerging needs and threats to the health of the <strong>Baw</strong> <strong>Baw</strong> community.<strong>Baw</strong> <strong>Baw</strong> <strong>Shire</strong> is calling its Municipal <strong>Public</strong> <strong>Health</strong> Plan the<strong>Baw</strong> <strong>Baw</strong> Wellbeing Strategy and the <strong>Baw</strong> <strong>Baw</strong> Wellbeing ActionPlan. These titles better reflect the understanding of health asbeing “… a complete state of physical, mental and social wellbeing,and not merely the absence of disease or infirmity” (World <strong>Health</strong>Organisation 1948).The purpose of the <strong>Baw</strong> <strong>Baw</strong> Wellbeing Strategy is to promote astrategic and integrated approach to public health planning. It isintended that the Strategy will be a tool and process for workingacross a range of local plans, informing all other local public healthplanning processes and avoiding the duplication of the planning effort.This strategy provides a background to Municipal <strong>Public</strong> <strong>Health</strong><strong>Planning</strong> and a commitment to ongoing analysis and review of evidencebased statistical data of relevance to the <strong>Baw</strong> <strong>Baw</strong> <strong>Shire</strong>. Researchand analysis undertaken of the current health and well being issuesidentified in both council’s and stakeholder’s plans and, importantly, theplanned strategies for addressing these issues have been used to formthe basis for the <strong>Baw</strong> <strong>Baw</strong> Wellbeing Strategy 2009 – 2013.1 IThe <strong>Baw</strong> <strong>Baw</strong> Wellbeing Action Plan 2009 – 2013 details the keypriorities and outlines strategies to be implemented over the nextfour years in conjunction with our stakeholders. It also containsthe management arrangements for the ongoing review of relevantstatistical data and the identification and exploration of developinghealth and wellbeing issues that will inform ongoing planningprocesses. It outlines a clear commitment to good practice inidentifying and utilising relevant research and data collection and theprovision of processes of ongoing analysis.
2. <strong>Public</strong> <strong>Health</strong> and Wellbeing Plans(Municipal <strong>Public</strong> <strong>Health</strong> Plans)<strong>Council</strong>s have been developing Municipal <strong>Public</strong> <strong>Health</strong> Plans since 1988 and overthat time the conceptual basis for Municipal <strong>Public</strong> <strong>Health</strong> Plans has become moredeveloped and refined. The key concept underpinning Municipal <strong>Public</strong> <strong>Health</strong> Plans isthe social model of health (or social determinants of health) which is concerned withaddressing the many social, cultural, environmental, biological, political, economic andmedical determinants of health. There is unprecedented opportunity to improve healthand wellbeing by tackling the social conditions in which people live and work and whichconstitute the root causes of disease and health inequalities. Municipal <strong>Public</strong> <strong>Health</strong>plans are about developing a strategic and integrated framework that is informed by localneeds and priorities, is responsive to both the community’s current and emerging needsand threats to the health and wellbeing of the <strong>Baw</strong> <strong>Baw</strong> community.The <strong>Baw</strong> <strong>Baw</strong> <strong>Shire</strong> is calling its Municipal <strong>Public</strong> <strong>Health</strong> Plan the <strong>Baw</strong> <strong>Baw</strong> WellbeingPlan as this title better reflects the understanding of health as being “.. a completeabsence of disease or infirmity” (World <strong>Health</strong> Organisation 1948) this provides a basisto aspire to the goal of improved health and wellbeing outcomes for our <strong>Baw</strong> <strong>Baw</strong>Community.Social Determinants of <strong>Health</strong>Ten Social determinants of health were developed by the World <strong>Health</strong> Organisation in 2000,based on an increasing understanding of the significant sensitivity of health to the socialenvironment. The ten social determinants are:1. The Social Gradient –“Life expectancy is shorter and most diseases are morecommon further down the social ladder in each society.”2. Stress – “Stressful circumstances, making people feel worried, anxious and unable tocope, are damaging to health and may lead to premature death.”3. Early Life – “A good start in life means supporting mothers and young children: thehealth impact of early development and education lasts a lifetime.”4. Social Exclusion – “Life is short where its quality is poor. By causing hard-ship andresentment, poverty, social exclusion and discrimination cost lives.”5. Work – “Stress in the workplace increases the risk of disease. People who have morecontrol over their work have better health.”6. Unemployment – “Job security increases health, wellbeing and job satisfaction.Higher rates of unemployment cause more illness and premature death.”7. Social Support – “Friendship, good social relations and strong supportivenetworks improve health at home, at work and in the community.”I 2
8. Addiction- “Drug use is both a response to social breakdown and animportant factor in worsening the resulting inequities in health.”9. Food – “A good diet and adequate food supply are central for promoting health and wellbeing.A shortage of food and lack of variety cause malnutrition and deficiency diseases.”10. Transport – “<strong>Health</strong>y transport means less driving and more walking andcycling, backed up by better public transport. Cycling, walking and the use ofpublic transport promote health in four ways. They provide exercise, reduce fatalaccidents, increase social contact and reduce air pollution.”SOURCE: Determinants of <strong>Health</strong>: the Solid Facts – 2nd edition – World <strong>Health</strong> Organisation 2003 www.health.vic.gov.au/healthpromotion/foundations/determinants.htmFramework for <strong>Planning</strong>A planning framework has been developed to aid the development of Municipal <strong>Public</strong><strong>Health</strong> Plans based on the social model of health which is called Environments for<strong>Health</strong>. In this framework four environments are recognised as providing opportunitiesto directly, or indirectly, influence the health and wellbeing of the community. Byusing this framework <strong>Council</strong> is taking both a systematic and integrated approach toprotecting and improving health and wellbeing outcomes for the <strong>Baw</strong> <strong>Baw</strong> community.The four environments for health are:1. Built/Physical environment which focuses on enhancing our surroundings e.g.parks, facilities, paths and infrastructure;2. Social environment which focuses on creating opportunities for participation incommunity life;3. Economic environment which focuses on encouraging growth and prosperity forall members of the community; and4. Natural environment which focuses on protecting and conserving the naturalenvironment so that it continues to nurture our communities.The four environments for health and wellbeing have been combined with the prioritiesidentified in the <strong>Council</strong> Plan into the <strong>Baw</strong> <strong>Baw</strong> Wellbeing Strategy Model:3 I
<strong>Baw</strong> <strong>Baw</strong> Wellbeing Plan ModelTHRIVINGopportunities. Appropriatelifestyles. Life long learningemployment opportunities.Equitable & prosperous economy.Effective health services. <strong>Health</strong>yRISK FACTORSAvailable, affordable housing.ECONOMY<strong>Baw</strong> <strong>Baw</strong>CommunityWellbeing /Quality of LifeWelcoming environments. Active &engaged community members.Supportive social networks. Inclusive,Fostering positive self esteem.diverse and resilient communities.RISK FACTORSVIBRANTSOCIALRISK FACTORSRISK FACTORSEcologically sustainabledesign. Water quality &conservation. Improved carbonfootprint. Promote biodiversity.Manage waste & reduce landfill.PHYSICALENVIRONMENTALSUSTAINABILITY& RURAL CHARACTERThe model emphasises that to achieve <strong>Council</strong>’s priorities of a vibrant community,a thriving economy and maintaining the rural character of <strong>Baw</strong> <strong>Baw</strong> there needs tobe coordinated and integrated planning between the social, economic and physicalenvironments. This coordinated planning will assist in the management of theinteractions between:c The social and economic environments to achieve improved services, lifestyles,employment, education and housing;ccThe social and physical environment to provide safe, secure and welcomingenvironments, improve social networks and provide opportunities for activecommunity participation while building more inclusive, diverse and resilientcommunities.The economic and physical environments to achieve sustainable growth,ecologically sustainable design, effective waste management, protection of waterquality, promotion of biodiversity and preparedness for climate change.The goal of managing these interactions depicted by the Model is to improve thequality of life and the wellbeing of the <strong>Baw</strong> <strong>Baw</strong> community.I 4
3. Integrated <strong>Planning</strong>The <strong>Baw</strong> <strong>Baw</strong> Wellbeing Plan Model approach to planning for health and wellbeing in<strong>Baw</strong> <strong>Baw</strong> has resulted in a broad range of more than twenty community health andwellbeing focused organisations within <strong>Baw</strong> <strong>Baw</strong> <strong>Shire</strong> working together to providebetter planning and coordination of services and health improvement strategies. Thispartnership and collaborative planning approach strengthens coordination betweenplans, projects and agencies, and is therefore a sustainable approach to communitywellbeing at a local level. The collective aim is to support better health and wellbeingoutcomes for all members of the <strong>Baw</strong> <strong>Baw</strong> community.Key demographic networks of Early Years 0-12, Youth 12-25 and Older Adults 65+ areoperating to address current and emerging issues and opportunities with a focus onpriority areas of Physical Activity, Nutrition, Safety and Mental <strong>Health</strong>. Each of theseareas is viewed through the lens of gender, culture and disability.Snapshot and trends for:Early Years Youth Older Adults21.4% of <strong>Baw</strong> <strong>Baw</strong>population is agedbetween 0-14 comparedwith 19.8% Gippsland wideImmunisation rates in <strong>Baw</strong><strong>Baw</strong> are higher than theState average across allcohorts:<strong>Baw</strong> <strong>Baw</strong> Vic12-15 mths 94% 91.5%24-27 mths 96% 92%72-75 mths 91% 88%As at July 2008 FamilyDay Care had 25 carersworking with a capacity of100 preschool children aweek, plus 75 school agedchildren.<strong>Baw</strong> <strong>Baw</strong> has 362 licensedchildcare places which is 1place for 6 children (0-4).12.5% of <strong>Baw</strong> <strong>Baw</strong>population is agedbetween 15-24 comparedwith 12.1% Gippsland wideCouple families withdependent children/students:<strong>Baw</strong> <strong>Baw</strong> Gippsthan 15yrs 5.6% 5.1%One parent families withdependent children/students:<strong>Baw</strong> <strong>Baw</strong> Gippsthan 15yrs 2.1% 1.9%20.4% of <strong>Baw</strong> <strong>Baw</strong>population is aged 60+compared with 23.0%Gippsland widePopulation projections for65+ age demographic:<strong>Baw</strong> <strong>Baw</strong> Gipps2006 ABS 5,627 41,1102031 projection 14,757 96,863% change 162.3% 135.6%Aged/Mature AgedPension recipients:Year Individuals2000 3,1702001 3,3462002 3,4472003 3,5765 I
4. Demographics Characteristics<strong>Baw</strong> <strong>Baw</strong> <strong>Shire</strong> spans an area of just under 3,900 square kilometres with a populationof 37,180 in 2006 and a projected increase of 28.9% (47,927) by 2031. Significantgrowth is expected in the 65+ age demographic. The <strong>Shire</strong>’s current 65+ population isexpected to grow at a rate of 162.3% (14, 757) by 2031. Warragul is the main retail andservices centre, supported by Drouin and over 100 regional localities.PopulationEstimatedresidentpopulation byage groupsSOURCE:Department ofSustainability andEnvironment &ABS, Census ofPopulation andHousing 2001Township Population Profile 2006Township Population Profile 2006Darnum Drouin WillowGroveLongwarryNeerimSouthRawson Trafalgar Warragul Yarragon2006 Census 367 6,857 222 625 608 280 2,301 11,498 723PopulationAboriginal & 0.0 2.3 0.0 1.4 0.5 0.0 0.2 1.0 0.0TSI (%)Age Structure(%)0-19 yrs 34.2 27.5 31.3 34.1 29.6 28.7 26.2 29.7 28.220-49 yrs 44.3 36.4 36.6 38.4 31.3 32.6 34.6 37.6 36.850-64 yrs 15.6 17.4 25.0 14.4 15.8 23.3 18.5 16.8 18.565+ yrs 6.0 18.7 7.1 13.1 23.4 15.4 20.7 16.0 16.5SOURCE: GRIS, <strong>Baw</strong> <strong>Baw</strong> <strong>Shire</strong> Statistical Profile, Dec 2008, p. 13I 6
Indigenous Profile 2006<strong>Baw</strong> <strong>Baw</strong> <strong>Shire</strong> Gippsland Victoria Australia2006 IndigenousPopulationNo. % No. % No. % No. %347 100.0 3,075 100.0 30,140 100.0 455,016 100.0Age StructurePre-School 41 11.8 377 12.3 3,583 11.9 55,579 12.2(0-4)Primary School 73 21.0 608 19.8 5,283 17.5 81,198 17.8(5-11)Secondary47 13.5 468 15.2 4,337 14.4 65,883 14.5School (12-17)Young Adults 40 11.5 321 10.4 3,584 11.9 54,491 12.0(18-24)Adults (25-54) 106 30.5 1,018 33.1 10,558 35.0 160,554 35.3Mature Adults 24 6.9 167 5.4 1,584 5.3 22,181 4.9(55-64)Senior Adults 16 4.6 116 3.8 1,211 4.0 15,130 3.3(65+)TOTAL 347 100.0 3,075 100.0 30,140 100.0 455,016 100.0SOURCE: GRIS, <strong>Baw</strong> <strong>Baw</strong> <strong>Shire</strong> Statistical Profile, Dec 2008, p. 157 I
Country of Birth by sex 2006Males Females PersonsAustralia 15,458 16,169 31,627Bosnia and Herzegovina 4 0 4Canada 29 16 45China (excl. SARs & Taiwan Province)(b) 16 19 35Croatia 22 11 33Egypt 3 5 8Fiji 7 12 19Former Yugoslav Republic of Macedonia0 4 4(FYROM)Germany 88 105 193Greece 13 11 24Hong Kong (SAR of China)(b) 9 10 19India 30 20 50Indonesia 8 6 14Iraq 4 3 7Ireland 44 19 63Italy 121 95 216Japan 3 7 10Korea, Republic of (South) 0 0 0Lebanon 3 0 3Malaysia 6 13 19Malta 9 17 26Netherlands 170 175 345New Zealand 142 166 308Papua New Guinea 6 7 13Philippines 4 62 66Poland 20 25 45Singapore 8 3 11South Africa 41 36 77South Eastern Europe, nfd(c) 20 17 37Sri Lanka 13 15 28Thailand 0 7 7Turkey 0 0 0United Kingdom(d) 709 836 1,545United States of America 43 34 77Vietnam 4 4 8Born Elsewhere(e) 133 144 277Country of birth not stated 932 983 1,915TOTAL 18,122 19,056 37,178SOURCE: AUSTRALIAN BUREAU OF STATISTICS2006 Census of Population and HousingI 8
Income<strong>Baw</strong> <strong>Baw</strong> <strong>Shire</strong>’s weekly individual income is closely aligned with that of countryVictoria, however there are more residents in <strong>Baw</strong> <strong>Baw</strong> with a low income, $0 - $599per week, when compared to the whole of Victoria. In contrast, when weighing updifferences between all of Gippsland and <strong>Baw</strong> <strong>Baw</strong> <strong>Shire</strong> we see a slight increase inincome for <strong>Baw</strong> <strong>Baw</strong> residents in all cohorts.Weekly Individual Income 2006AreaLow$0-399<strong>Baw</strong> <strong>Baw</strong> <strong>Shire</strong> 13,19045.1%Gippsland 92,29048.1%CountryVictoria488,34646.0%Victoria 1,664,78241.8%Medium-Low$400-5994,53915.5%28,83715.0%164,48315.5%540,33113.6%Medium-High$600-9995,18117.7%20,80916.0%189,90217.9%746,33618.7%SOURCE: GRIS, <strong>Baw</strong> <strong>Baw</strong> <strong>Shire</strong> Statistical Profile, Dec 2008, p. 26High$1,000 +4,08114.0%23,61812.3%133,32312.6%681,08217.1%NotStated2,2447.7%16,5138.6%84,9268.0%349,5048.8%TotalPersons29,235100.0%192,067100.0%1,060,980100.0%3,982,035100.0%Weekly Household Income 2006AreaLow$0-399Medium-Low$400-599Medium-High$600-999High$1,000 +NotStatedTotalPersons<strong>Baw</strong> <strong>Baw</strong> <strong>Shire</strong> 2,98722.1%2,54718.9%4,24631.4%2,18016.1%1,54411.4%13,504100.0%Gippsland 24,03326.5%18,36820.2%26,35129.0%11,84713.0%10,23111.3%90,830100.0%CountryVictoria119,27923.9%98,53619.8%154,90631.1%70,27914.1%55,36311.1%498,363100.0%Victoria 347,45419.5%295,78316.6%551,52731.0%388,36221.8%198,53911.1%1,781,665100.0%SOURCE: GRIS, <strong>Baw</strong> <strong>Baw</strong> <strong>Shire</strong> Statistical Profile, Dec 2008, p. 269 I
EmploymentBy Occupation 2006BAW BAWVICTORIA2,340 13.9%1,280 7.6%1,411 8.4%1,84811%314 1.9%1,4568.6%2,859 17%2,688 16%2,650 15.7%Inadequately described/not statedLabourersMachinery operators & driversSales workersClerical & administrative workersCommunity & personal service workersTechnical & Trades workersProfessionalsManagers224,5439.9%149,2226.6%230,373 10.1%337,41814.8%44,584 2.0%190,4868.4%306,32213.5%472,305 20.8%319.19014%TOTAL 16,846TOTAL 2,274,443SOURCE: GRIS, <strong>Baw</strong> <strong>Baw</strong> <strong>Shire</strong> Statistical Profile, Dec 2008, p. 75SOURCE: GRIS, <strong>Baw</strong> <strong>Baw</strong> <strong>Shire</strong> Statistical Profile, Dec 2008, p. 40I 10
EducationPersons aged 15 years and over, 2006 CensusSOURCE: GRIS, <strong>Baw</strong> <strong>Baw</strong> <strong>Shire</strong> Statistical Profile, Dec 2008, p. 4711 I
Gambling<strong>Baw</strong> <strong>Baw</strong> <strong>Shire</strong> has a total of 175 gaming machines across 4 venues. EGM stands forElectronic Gaming MachineEGM Gambling in <strong>Baw</strong> <strong>Baw</strong> <strong>Shire</strong> was a Net total of $290 per person in 2007/2008,this is lower than both the Regional Victorian and State amounts. This figure equatesto a total of $11,811,040.70 which increased to $12,449,245.13 in 2008/2009.Expenditure data as at June 30 2007Populationper venuePopulation(18+) pervenueNet EGMexpenditureper personNet EGMexpenditureper adultEGM per1000EGM per1000 (+18)<strong>Baw</strong> <strong>Baw</strong><strong>Shire</strong>9,700 7,248 $290 $388 4.51 6.04Regional Vic 7,488 5,683 $384 $505 5.29 6.97Victoria 9,827 7,623 $496 $639 5.32 6.86Source: Victorian Commission for Gambling Regulation www.vcgr.vic.gov.auMonthly Net EGM Expenditure for <strong>Baw</strong> <strong>Baw</strong> <strong>Shire</strong> 2007/08 & 2008/09Financial Year 2008/2009 2007/2008July $1,048,564.63 $987,525.96August $1,056,886.28 $1,127,638.13September $992,638.56 $1,001,021.90October $1,097,618.12 $1,021,978.86November $1,012,214.49 $1,030,731.55December $1,169,658.62 $986,783.50January $985,744.86 $956,783.36February $880,579.56 $888,508.55March $1,070,105.13 $889,567.40April $1,078,298.34 $942,950.30May $1,057,345.14 $1,018,185,04June $999,827.17 $1,018,185.04TOTAL $12,449,245.13 $11,811,040.77Source: Victorian Commission for Gambling Regulation www.vcgr.vic.gov.auI 12
DALY RATE5. <strong>Health</strong> CharacteristicsThe health and wellbeing of <strong>Baw</strong> <strong>Baw</strong> <strong>Shire</strong> cannot be measured by statical dataalone. <strong>Health</strong> statistics measurements are often based around morbidity andmortality data, such as deaths or hospitalisations. Consequently, a range of data setshave been used to identify the <strong>Shire</strong>’s health and wellbeing status, such SEIFA data,burden of disease data and community indicators.Burden of DiseaseThe Burden of Disease data provides statistical information on broad disease groups,specific diseases and life expectancy at birth for the <strong>Baw</strong> <strong>Baw</strong> local government area.Life Expectancy at BirthArea Period Male Female<strong>Baw</strong> <strong>Baw</strong> <strong>Shire</strong> 1997 - 2001 76.2 yrs 82.5 yrs2001 - 2005 78.4 yrs 83.4 yrsGippsland 1997 - 2001 75.9 yrs 81.5 yrs2001 - 2005 77.5 yrs 82.6 yrsVictoria 1997 - 2001 77.4 yrs 82.7 yrs2001 - 2005 79.8 yrs 84.3 yrsSOURCE: ABS, State & Regional Indicators, Victoria, Cat No. 1367.2, Dec Qtr 2007Death and Disability 2006The top 5 causes of death in <strong>Baw</strong> <strong>Baw</strong> <strong>Shire</strong> The top 5 causes of disability in <strong>Baw</strong> <strong>Baw</strong> <strong>Shire</strong>1. Malignant cancers 1. Mental disorders2. Cardiovascular diseases 2. Neurological disorders3. Unintentional injuries 3. Chronic respiratory disease4. Chronic respiratory diseases 4. Diabetes mellitus5. Intentional injuries 5. Malignant cancersSOURCE: Victorian Dept. Human Services. <strong>Planning</strong> for a <strong>Health</strong>ier Gippsland: Key <strong>Planning</strong> Indicators,www.dhs.vic.gov.auDALYMALE DALY RATEDALY stands for Disability Adjusted LifeYear, which combines a measurement200of premature mortality and disability. AHigh DALY rate indicates poor communityhealth whereas a low DALY rate reflects150better health.FEMALE DALY RATE100SOURCE: Victorian Dept. Human Services.<strong>Planning</strong> for a <strong>Health</strong>ier Gippsland: Key <strong>Planning</strong>Indicators, www.dhs.vic.gov.au50Bass Coast<strong>Baw</strong> <strong>Baw</strong>EastGippslandLatrobeSouthGippslandWellingtonVictoria13 ILOCATION
YLD RATEYLDYLD stands for Years Lived with a Disabilitywhich includes what is disabling people orcausing ill health. A high YLD indicates poorhealth status of the population whereas alow YLD rate reflects better health.10080MALE YLD RATEFEMALE YLD RATE6040SOURCE: Victorian Dept. Human Services. <strong>Planning</strong>for a <strong>Health</strong>ier Gippsland: Key <strong>Planning</strong> Indicators,www.dhs.vic.gov.au20Bass Coast<strong>Baw</strong> <strong>Baw</strong>EastGippslandLatrobeSouthGippslandWellingtonVictoriaLOCATIONI 14
BULNBULNDisadvantaged AreasWarragul East: Highest 5% quintile for IRSEDWarragul West 5% - 10% quintile for IRSEDDrouin 5% - 10% quintile for IRSEDThorpdale Postcode CAT.ANoojee Postcode CAT.CDROUINWARRAGULSEIFA dataSEIFA is an indexmeasuring relativesocioeconomicdisadvantage of ageographical area, basedon a range of censusvariables considered toreflect disadvantage,including low income,unemployment and lackof educational attainment.The ranking system rates1 = worst and 79 = best.<strong>Baw</strong> <strong>Baw</strong> <strong>Shire</strong> has growingpockets of disadvantageacross the municipality andis rated overall as 47th inthe ranking system.LONGWARRYNEERIMSOUTHJINDIVICKROKEBYBULNBULNSee Inset 1ELLINBANKNILMADARNUMYARRAGONHILL ENDWILLOWGROVETRAFALGARWALHALLARAWSONERICA15 I
Community IndicatorsThe Community Indicators Victoria Framework is based on a set of approximately 80community wellbeing indicators, covering the spectrum of local community life.The indicators are grouped under five major domains which include:• <strong>Health</strong>y, safe and inclusive communities;• Dynamic, resilient local economies;• Sustainable built and natural environments;• Culturally rich and vibrant communities; and• Democratic and engaged communities.Community indicators are intended to assist local councils and communities toidentify the issues and indicators which are most important to them.Community Indicator <strong>Baw</strong> <strong>Baw</strong> <strong>Shire</strong> Gippsland VictoriaFeeling part of the community 75.1 76.0 70.7Social support - % of persons reporting 93.2 93.5 N/Athey can get help from friends, family orneighbours when neededVolunteering - % who volunteer 50.8 53.9 N/APerceptions of Safety - % feeling safe 98.0 98.1 96.0walking alone – dayPerceptions of Safety - % feeling safe 74.4 77.1 66.5walking alone – nightFood security - % persons experiencing 4.9 6.2 6.0food insecurity (Food security refers to theavailability of food and one’s access to it.)Housing Affordability - % households 14.4 14.1 17.7spending 30% or more of gross income onrent or mortgageTransport Limitations - % experienced 19.9 20.6 20.3transport limitations in the previous yearSOURCE: Community Indicators Victoria www.communityindicators.net.auGeneral <strong>Baw</strong> <strong>Baw</strong> <strong>Health</strong> and Wellbeing Statistics• General Practitioners per 1,000 population is 0.94 (Victoria – 1.09, Gippsland 1.06).• Emergency Department presentations per 1,000 population is 352.9 (Victoria –247.3, Gippsland – 205.5)• Registered mental health contacts per 1,000 population is 13.5 (Victoria 11.6,Gippsland – 14.4)• 75% of residents either fully own or are purchasing housing.• <strong>Public</strong> housing in <strong>Baw</strong> <strong>Baw</strong> is 2.8%• 11.2% of people access public transport regularly.• 45.1% of the population has an income below $400 per week (Victoria – 41.8%,Gippsland – 47.9% ) and• 60.6% of residents have an income below $600 per week (Victoria – 55.3%,Gippsland – 63.3%).SOURCE: http://www.dhs.vic.gov.au/__data/assets/pdf_file/0014/243410/Gippsland-Key-<strong>Planning</strong>-Indicators-2008.pdf (accessed 13/02/2009)I 16
6. <strong>Baw</strong> <strong>Baw</strong> Wellbeing Action Plan2009 – 2013 Priority AreasThe <strong>Baw</strong> <strong>Baw</strong> Wellbeing Action Plan 2009 – 2013 accompanies this document andprovides detailed information about four environments for health – Built/Physical,Social, Economic and Natural. Each of these environments contains key priorityareas, strategies, actions, timelines and partners. Outlined below are the priorityareas for each environment. For a detailed breakdown of these priority areas pleaserefer to the <strong>Baw</strong> <strong>Baw</strong> Wellbeing Action Plan 2009 – 2013.Built/PhysicalEnvironmentSocialEnvironmentEconomicEnvironmentNaturalEnvironmentSustainableand ResilientCommunitiesResilientcommunitiesAgricultureBusiness GrowthEnvironmentalManagement PlanIntegrated andDiversifiedTransport Options<strong>Health</strong>y Conditionsand EnvironmentsBusinessDevelopment andEconomic GrowthRecreation<strong>Planning</strong>17 I
Appendix 1 -Further Reading and Resources<strong>Public</strong> <strong>Health</strong> <strong>Planning</strong>“Environments For <strong>Health</strong> Promoting <strong>Health</strong> and Wellbeing: Through Built, SocialEconomic and Natural Environments”, Municipal <strong>Public</strong> <strong>Health</strong> <strong>Planning</strong> Framework,Department of Human Services, 2001 http://www.health.vic.gov.au/localgov/mphpfr/downloads/mphpf.pdf (accessed 08/08/2009)Municipal <strong>Public</strong> <strong>Health</strong> Plans – New requirements:http://www.health.vic.gov.au/phwa/downloads/municipal_health_plan.pdf (accessed 08/08/2009)New requirements factsheets:http://www.health.vic.gov.au/phwa/q_a.htm#7 (accessed 08/08/2009)<strong>Public</strong> <strong>Health</strong> Contacts by region:http://www.health.vic.gov.au/phwa/contacts.htm (accessed 08/08/2009)<strong>Public</strong> <strong>Health</strong> and Wellbeing Act 2008http://www.austlii.edu.au/cgibin/sinosrch.cgi?query=<strong>Public</strong>+<strong>Health</strong>+and+Wellbeing+Act+2008&results=50&submit=Search&mask_world=&mask_path=&callback=on&method=auto&meta=%2Fau (accessed 08/08/2009)http://www.health.vic.gov.au/phwa/downloads/bulletin_0609_gov.pdf (accessed 08/08/2009)http://www.health.vic.gov.au/phwa/downloads/bulletin_0609_pub.pdf (accessed 08/08/2009)Community Profile – <strong>Baw</strong> <strong>Baw</strong>/Gippslandhttp://www.dvc.vic.gov.au/web20/dvclgv.nsf/AllDocs/154770DCD918EFD9CA257161001CD497 (accessed 08/08/2009)http://www.abs.gov.au/ausstats/abs@.nsf/Products/3218.0~2007-08~Main+Features~Victoria?OpenDocument#PARALINK2Community Indicators – <strong>Baw</strong> <strong>Baw</strong>/Gippslandhttp://www.communityindicators.net.au/http://www.communityindicators.net.au/wellbeing_reports/baw_bawhttp://www.communityindicators.net.au/live_reports/yvonne_magyar/baw_baw_health_and_wellbeing_indicators (created 08/08/2009)http://www.communityindicators.net.au/live_reports/yvonne_magyar/baw_baw_social_environment_indicators (created 08/08/2009)<strong>Health</strong> Promotion In Gippslandhttp://www.health.vic.gov.au/healthpromotion/ (accessed 08/08/2009)http://www.dhs.vic.gov.au/operations/regional/gippsland/regional-initiatives/healthpromotion-in-gippsland(accessed 08/08/2009)I 18
<strong>Health</strong> Status – Gippslandwww.health.vic.gov.au/healthstatus/gippsland (accessed 08/08/2009)http://www.health.vic.gov.au/healthstatus/downloads/gippsland-fact-sheet-07-rev1.pdf (accessed 08/08/2009)http://www.health.vic.gov.au/healthstatus/downloads/vic_health_survey_07_findings.pdf (accessed 08/08/2009)<strong>Health</strong> Promotion Catchment <strong>Planning</strong> & Prioritieshttp://www.health.vic.gov.au/localgov/downloads/faq_chpmphp.pdf (accessed 085/08/2009)www.health.vic.gov.au/healthstatus/gippsland (accessed 08/08/2009)http://apps.who.int/gb/ebwha/pdf_files/A62/A62_R14-en.pdf (accessed 08/08/2009)http://www.dhs.vic.gov.au/__data/assets/pdf_file/0004/275845/PhysicalActivity.pdf(accessed 08/08/2009)http://www.nphp.gov.au/publications/documents/nphp_baa_aug_05_no_cover.pdf(accessed 08/08/2009)http://www.nphp.gov.au/publications/phpractice/planfrwk.pdf (accessed 08/08/2009)http://www.dhs.vic.gov.au/__data/assets/pdf_file/0005/276296/<strong>Health</strong>yEating.pdf(accessed 08/08/2009)http://www.nphp.gov.au/publications/signal/eatwell1.pdf (accessed 08/08/2009)http://www.vichealth.vic.gov.au/en/~/media/ResourceCentre/<strong>Public</strong>ationsandResources/General/Strategic_Priorities_06-09.ashx (accessed 08/08/2009)Guides for <strong>Council</strong>s and <strong>Council</strong>lors – Leading the Way – Vic<strong>Health</strong>http://www.vichealth.vic.gov.au/~/media/ProgramsandProjects/<strong>Planning</strong><strong>Health</strong>yEnvironments/Attachments/Leading%20the%20Way%20Resource%20Pack%20Prompting_Questions.ashx (accessed 08/08/2009)http://www.vichealth.vic.gov.au/~/media/ProgramsandProjects/<strong>Planning</strong><strong>Health</strong>yEnvironments/Attachments/Leading%20the%20Way%20Resource%20Pack%20Part%201.ashx (accessed 08/08/2009)http://www.vichealth.vic.gov.au/~/media/ProgramsandProjects/<strong>Planning</strong><strong>Health</strong>yEnvironments/Attachments/Leading%20the%20Way%20Resource%20Pack%20Part%202.ashx (accessed 08/08/2009)19 I
Intervention Guidance Materialshttp://www.vichealth.vic.gov.au/~/media/ProgramsandProjects/<strong>Planning</strong><strong>Health</strong>yEnvironments/Attachments/Leading%20the%20Way%20Resource%20Pack%20Prompting_Questions.ashx (accessed 08/08/2009)http://www.dhs.vic.gov.au/__data/assets/pdf_file/0003/276339/CommunityGardening.pdf (accessed 24/04/2009)http://www.dhs.vic.gov.au/__data/assets/pdf_file/0006/276342/EnvironmentalAndInfrastructureAudit.pdf (accessed 24/04/2009)http://www.dhs.vic.gov.au/__data/assets/pdf_file/0008/276344/ImproveParksAndPlayAreas.pdf (accessed 24/04/2009)http://www.dhs.vic.gov.au/__data/assets/pdf_file/0010/276346/LocationAndAccessToCommunityCivicEducationBuildingsForPhysicalActivityPrograms.pdf (accessed 24/04/2009)http://www.dhs.vic.gov.au/__data/assets/pdf_file/0003/276348/PedestrianPrecincts.pdf (accessed 24/04/2009)Intervention Guidance Materials continued…http://www.dhs.vic.gov.au/__data/assets/pdf_file/0006/276351/PlaygroundEquipmentLayoutAndShade.pdf (accessed 24/04/2009)http://www.dhs.vic.gov.au/__data/assets/pdf_file/0020/276410/SafeRouteToWalkCyclePamphlets.pdf (accessed 24/04/2009)http://www.dhs.vic.gov.au/__data/assets/pdf_file/0004/276412/SafeStoragForBikes.pdf(accessed 24/04/2009)Intervention Guidance Materials continuedhttp://www.dhs.vic.gov.au/__data/assets/pdf_file/0008/276605/TrafficCalming.pdf(accessed 24/04/2009)http://www.dhs.vic.gov.au/__data/assets/pdf_file/0010/276607/WalkingCyclingSchoolBus.pdf(accessed 24/04/2009)I 20
Social Inclusion Resourceshttp://www.socialinclusion.gov.au/AusGov/Board/Documents/Compendium.pdf(accessed 08/08/2009)http://www.socialinclusion.gov.au/Principles/Documents/SIPrincilpes.pdf (accessed08/08/2009)http://www.health.vic.gov.au/healthstatus/downloads/fair_health09.pdf (accessed08/08/2009)http://whqlibdoc.who.int/publications/2004/9241592389.pdf (accessed 08/08/2009)Additional Linkshttp://www.dhs.vic.gov.au/publicationsNational <strong>Public</strong> <strong>Health</strong> Partnershiphttp://www.nphp.gov.au/publications/a_z.htm (accessed 08/08/2009)http://www.vichealth.vic.gov.au/en/Search.aspx?q=publications (accessed08/08/2009)http://www.health.vic.gov.au/healthstatus/downloads/vic_health_survey_07_findings.pdf (accessed 08/08/2009)http://www.abs.gov.au21 I
“Social determinants of health”“The social determinants of health are the conditions in which people are born, grow,live, work and age, including the health system. These circumstances are shaped bythe distribution of money, power and resources at global, national and local levels,which are themselves influenced by policy choices. The social determinants of healthare mostly responsible for health inequities - the unfair and avoidable differences inhealth status seen within and between countries.Responding to increasing concern about these persisting and widening inequities,WHO established the Commission on Social Determinants of <strong>Health</strong> (CSDH) in 2005 toprovide advice on how to reduce them. The Commission’s final report was launched inAugust 2008, and contained three overarching recommendations:1. Improve daily living conditions2. Tackle the inequitable distribution of power, money, and resources3. Measure and understand the problem and assess the impact of action “Social determinants of health, World <strong>Health</strong> Organisation, 2009 @ http://www.who.int/social_determinants/en/ (accessed 08/08/2009)Ottawa Charter 1956http://www.wpro.who.int/NR/rdonlyres/798A711D-DC30-4E27-8DD6-19561EB969CC/0/ottawa_charter.pdf (accessed 08/08/2009)Australian Profile: World <strong>Health</strong> Organisation: http://www.who.int/countries/aus/en/(accessed 08/08/2009)I 22
<strong>Baw</strong> <strong>Baw</strong> <strong>Shire</strong> <strong>Council</strong>PO Box 304Warragul, Victoria 3820DX82014 Warragul 3820Leslie SmithCoordinator Community and Social InclusionPhone: 03 5625 0271Email: bawbaw@bawbawshire.vic.gov.auwww.bawbawshire.vic.gov.au


