Product brochure (PDF) - HBM nCode
Product brochure (PDF) - HBM nCode
Product brochure (PDF) - HBM nCode
- No tags were found...

You also want an ePaper? Increase the reach of your titles
YUMPU automatically turns print PDFs into web optimized ePapers that Google loves.
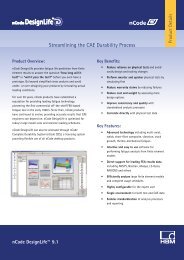
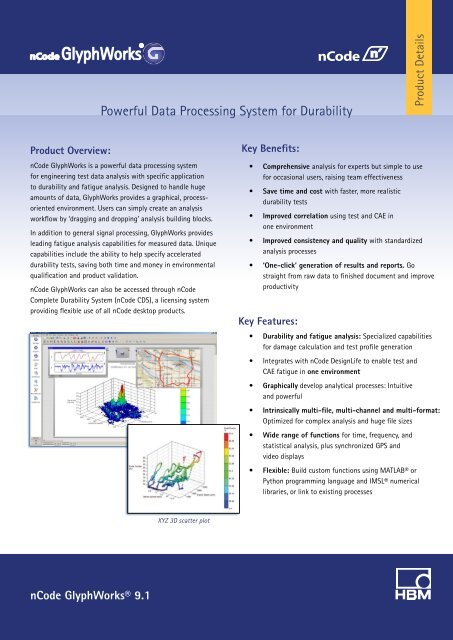
Powerful Data Processing System for Durability<strong>Product</strong> Details<strong>Product</strong> Overview:<strong>nCode</strong> GlyphWorks is a powerful data processing systemfor engineering test data analysis with specific applicationto durability and fatigue analysis. Designed to handle hugeamounts of data, GlyphWorks provides a graphical, processorientedenvironment. Users can simply create an analysisworkflow by ‘dragging and dropping’ analysis building blocks.In addition to general signal processing, GlyphWorks providesleading fatigue analysis capabilities for measured data. Uniquecapabilities include the ability to help specify accelerateddurability tests, saving both time and money in environmentalqualification and product validation.<strong>nCode</strong> GlyphWorks can also be accessed through <strong>nCode</strong>Complete Durability System (<strong>nCode</strong> CDS), a licensing systemproviding flexible use of all <strong>nCode</strong> desktop products.Key Benefits:• Comprehensive analysis for experts but simple to usefor occasional users, raising team effectiveness• Save time and cost with faster, more realisticdurability tests• Improved correlation using test and CAE inone environment• Improved consistency and quality with standardizedanalysis processes• ‘One-click’ generation of results and reports. Gostraight from raw data to finished document and improveproductivityKey Features:• Durability and fatigue analysis: Specialized capabilitiesfor damage calculation and test profile generation• Integrates with <strong>nCode</strong> DesignLife to enable test andCAE fatigue in one environment• Graphically develop analytical processes: Intuitiveand powerful• Intrinsically multi-file, multi-channel and multi-format:Optimized for complex analysis and huge file sizes• Wide range of functions for time, frequency, andstatistical analysis, plus synchronized GPS andvideo displays• Flexible: Build custom functions using MATLAB® orPython programming language and IMSL® numericallibraries, or link to existing processesXYZ 3D scatter plot<strong>nCode</strong> GlyphWorks® 9.1
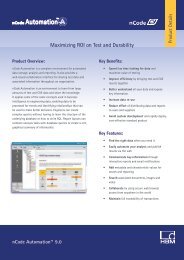
Core Functionality for Durability Analysis<strong>nCode</strong> GlyphWorks provides a wide range of data processing capabilities with specialized options such as fatigue analysis,accelerated testing, and frequency domain tools for ride quality and rotating machinery analysis.GlyphWorks FundamentalsGlyphWorks Fundamentals provides visualization and basic manipulation, frequency spectrum analysis and filtering capability.Report layouts can be interactively designed and these reports automatically generated by including as part of the analysisprocess. Fundamentals is a prerequisite for all other product options.The Fundamentals package includes support for a wide range of data formats and types of displays. The Super glyph capabilityenables multiple analysis functions to be encapsulated as a single glyph that can be saved and re-used.GlyphWorks Fundamentals includes:• Input multiple formats• Channel calculator• Channel reassignment• Filtering• Extraction and concatenation• Statistics and running statistics• Resampling• Unit conversion• Frequency analysis• Time at level analysis• Rainflow counting• Graphical editor• Visualization and reporting• Output multiple formats• Batch and interactive interfaces• Super glyph encapsulation• ScheduleCreate durability duty cycle definitionwww.hbm.com/ncode | info@hbmncode.com2
Fatigue<strong>Product</strong> OptionsGlyphWorks provides the industry-leading fatigue analysis technology you need to calculate fatigue life from measured data.You can correct for mean stress and surface finish effects, even back calculate from each data channel to determine a scale orfatigue concentration factor required to achieve a target life. You can then review damage histograms to determine which loadcycles were most damaging, and even output damage time histories to show exactly when the damage occurred. A database withcommonly used fatigue data is also provided.• Stress-Life method uses a nominal stress approachfor high-cycle conditions or non-metallic applications.A wide range of methods is provided for definingthe SN curves including the ability to interpolatemultiple material data curves for mean stress effects.For ultimate flexibility, Python scripting enables thedefinition of custom fatigue methods and materialmodels.• Strain-Life method is more appropriate for moresevere loading conditions (low-cycle fatigue) – wherelocal elastic-plastic strain controls the fatigue life.Supported methods include the Coffin-Manson-Basquin formula with additional mean stresscorrections such as Morrow and Smith-Watson-Topper.• Crack Growth provides linear elastic fracturemechanics to determine how a crack will propagateafter initiation. Complete fracture mechanics isperformed using industry standard methodologies,an open environment for users to embed their ownalgorithms – and advanced reporting and qualityassurance capabilities. Built-in growth laws includeNASGRO3, Forman, Paris, Walker, and more.• Creep Analysis performs creep calculation for timein hours to rupture at high temperatures. Supportedmethods include Larson-Miller which uses a creepcurve that is either paired points X-Y curve orpolynomial function and Chaboche method using afamily of curves, each for a specific temperature.Fatigue EditingDriving a time domain simulation rig such as a vehicle 4-postrig typically requires large amounts of measured data. FatigueEditing is an option used to perform damage sensitive editingto generate shorter time series data that retain the requireddamage.With Fatigue Editing you can:• Shorten multi-axial durability tests while retainingdamage to save time and money• Assess the trade-off between time saved and damageretained across multiple channelsA highly flexible tool, Fatigue Editing uses the powerfulFatigue glyphs, enabling the user complete control over theparameters used in the damage calculations.Processes can be locked down, capturingcorporate knowledge and improvingconsistency3www.hbm.com/ncode | info@hbmncode.com
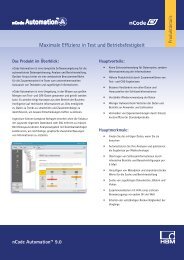
Save time and money withmore efficient durability testsAccelerated TestingVibration qualification for environmental testing can be atime-consuming process. GlyphWorks Accelerated Testingprovides the ability to create a representative PSD or sweptsine shaker vibration test based on measured data. It enablesthe combination of multiple time or frequency domain datasets into representative test spectra that accelerate the testwithout exceeding realistic levels.With Accelerated Testing you can:• Quantify and compare the vibration levels and fatiguedamage for given vibration shaker tests• Accelerate a vibration test using objective, justifiableand quantitative methods• Qualify a component in a new vibration environmentusing read-across evidence from a qualification inanother vibration environmentImage courtesy of MIRA LtdGlyphWorks Accelerated Testing is the only known supportedcommercial software that makes it possible to quantify thefatigue damage of a vibration test. It is based on GAM EG-13/NATO AECTP200 standards and allows users to design testscenarios that take a fraction of the time of a traditional test.Accelerated Testing also enables measured test data tobe compared with the severity of the testing profile, thusenabling assessment of whether components in servicewill likely survive to the target service life. This knownsafety margin may help extend the life of parts in service orconversely avoid unexpected failures.Optimized TestingPhysical durability testing often requires determination of theoptimum, most efficient mix of events required to match anoverall target. In automotive applications for example, thechallenge is to obtain the best value from proving groundusage. Optimized Testing provides a proven approach to findthe optimum solution across many channel locations.A wide range of inputs from measured data such as rainflowcycle counts or relative damage values enables many industryapplications. The optimization methods for best fit leastsquaresregression and constrained minimization routinesemploy robust algorithms from IMSL® Numerical Library.With Optimized Testing you can:• Significantly reduce proving ground track usage• Optimize testing schedules and reduce testing time• Understand how real world usage compares totrack data• Rapidly compare different proving grounds orduty cycleswww.hbm.com/ncode | info@hbmncode.com4
SignalThe Signal option delivers additional signal analysis capability and is particularly well-suited to durability test applications. It alsoprovides a set of glyphs to detect ‘features’ within time series data. These glyphs are powerful tools used to find problems withindata such as spikes, drift, and flat-lines. These features within the data can then be viewed and corrected automatically usingother glyphs such as the Graphical Editing glyph.Signal option includes:<strong>Product</strong> Options• Level crossing counting• Joint distribution analysis• Peak valley slice• PSD to rainflow cycle count• Trend removal• Markov counting• Relative damage calculation• Flat-line detection• Drift and spike detection• Frequency-banded relativedamage spectrum• Rainflow extrapolationFrequencyThe Frequency option provides a powerful, simple-to-use range of noise and vibration analysis capability with particularapplication to rotating machinery, octave analysis and frequency response. Specific functionality is also provided to assess vehicleride quality analysis to ISO 2631 Whole Body Vibration standard and hand-arm vibration assessment to ISO 5349 standard.Frequency option includes:• Frequency response for gain, phase and coherence oflinear systems• Joint time frequency• Octave analysis in accordance with ANSI S1.11-2004• Spectrum weighting• Order tracking filter• Waterfall analysis for rotating machinery• Waterfall display including cursor slicing• Custom Fourier filter for user defined filter definition• Weighting filters including A, B, C noise filters andhuman body vibration in accordance with ISO 2631,ISO 53495www.hbm.com/ncode | info@hbmncode.com
<strong>Product</strong> OptionsIMSL StatisticsIMSL Statistics includes a Curve Fitting glyph for linearregression, polynomial regression up to 9th order and splinefitting and a Weibull Analysis glyph. These glyphs usestatistical routines of the IMSL C Numerical Library. Thesemathematics and statistics functions can also be accessedusing Python programming in the Scripting glyph (seeGlyphBuilder option) using the special Python-enabledPyIMSL, which is also distributed with GlyphWorks.GlyphBuilderThe GlyphBuilder option combines the capabilitiesof the Scripting and Open glyphs to add even morefunctionality to GlyphWorks. Users can add theirown unique or proprietary methods and file formats toGlyphWorks using these glyphs.The Scripting glyph extends functionalityin GlyphWorks by enabling users to writetheir own glyphs using MATLAB or Pythonprogramming language.Open glyph gives direct access to external applicationsfrom within a GlyphWorks process. The Open glyphexecutes a given command line operation and in this wayexternal code or scripts such as Visual Basic®, Java, nCL,C++, etc., can all be called using data from the process.ASAM ODSGain access to search and select data from your ASAM ODSdatabase within GlyphWorks!The interface to the ASAM ODS data enables interactivebrowsing, editing of metadata, and searching based onmetadata, all within GlyphWorks. ASAM ATF and XATF filesare also supported and can be both imported and exported.IMSL is a registered trademark of Visual Numerics, Inc. in theU.S. and other countries. MATLAB and Simulink are registeredtrademarks of The MathWorks, Inc. Other product or brand namesare trademarks or registered trademarks of their respective holders.GPS DisplayGPS Display glyph plots latitude and longitude GPS dataon a map or grid background. Data can be easily exportedfor viewing in Google Maps or Google Earth. Featurelists are also supported, allowing locations of intereston the data lines to be automatically identified andmarked. Regions for editing data can be defined based ongeographical location.Embedded mapping capability in the GPS Display glyph requiresMicrosoft® MapPoint® 2006 or 2009 to be installed. A live internetconnection can access MapQuest® Open for maps and satellite imagery.Media DisplayLocate where speed ortemperature exceed a certainvalue directly on the map usingGPS Display.Media Display glyph enables video and audio signalsto be played using Windows Media® Player embeddedin the glyph. It also enables cursor synchronization withother data displays to gain insight on what was occurringin other signals. The Gauge Display glyph enablessynchronized values to be displayed during playback in avariety of styles such as angular gauges or digitalread-outs.<strong>nCode</strong> Automation Personal Edition<strong>nCode</strong> Automation Personal Edition (PE) is fully integratedwith and is an ideal addition to GlyphWorks. It enables youto search, organize and analyze data that is stored on yourcomputer and helps you to rapidly gain more value fromyour data analyzed in GlyphWorks.For more details, see the <strong>nCode</strong> Automation product detailssheet.www.hbm.com/ncode | info@hbmncode.com6
<strong>nCode</strong> GlyphWorks Technical FeaturesData Import• ASAM ATF/XATFTime Series• ASCII (via ASCIITranslate)• Altair MotionSolve .plt• B&K PULSE .pti• DEWEsoft .d7d• DSPCon DATX• EDASWin EDT• ETAS MDF3• <strong>HBM</strong> catman .bin, MEA format• I-DEAS Pro ATI• imc FAMOS RAW• KAMTranslate for Acra ControlKAM-500 hardware• Kyowa KS2• LDS Nicolet .pnrf• Lexade SIG• MATLAB• Microsoft WAV• MSC Adams .req• MTS RPC3• Moog SmarTEST ACS_DUMP• <strong>nCode</strong> s3t and DAC• NI DIAdem DAT, TDM/TDMS• nVision Signal• OROS OXF• Prosig DATS• Saginomiya RFC• Schenck-Pegasus SPG• SoMat SIF, SIE, 2100 DAT• Sony PC Scan II, III, IV and XMX• TEAC TAFFmat• UFF (Universal File Type 58)• Vector MDFHistograms• <strong>nCode</strong> s3h, XML and DAC• SoMat SIF, SIE, 2100 DAT• LMS XML• CSV with headerMulti-column• ASCII (via ASCIITranslate)• IPETRONIK TESTdrive CAN• Microsoft Excel .xls and .xlsx• Moog AeroTEST .dat, .hdr• <strong>nCode</strong> s3mData Generation• Square wave, Sine wave• Swept sine• White noise• Triangular wave• Schedule and block cycle definition• Sine on randomData ExportTime Series• ASAM ATF/XATF• ASCII• EDASWin EDT• <strong>HBM</strong> catman .bin• MATLAB• Microsoft WAV• MTS RPC3• <strong>nCode</strong> s3t and DAC• NI DIAdem DAT, TDM/TDMS• nVision Signal• Saginomiya RFC• SoMat SIFHistogram• <strong>nCode</strong> s3h and XMLMulti-column• <strong>nCode</strong> s3m• ASCII (comma, tab or space separated)AnalysisData Manipulation• Channel concatenation• Channel number reassignment• Section extraction• Delete sections• Scale/offset section• Ramp or Half sine wave sections• Sample rate adjustment• Units conversion• Append channels to tests• Extract channels from tests• Trend and drift removal• PSD to rainflow cycle count• Turning point extraction – singleor across multi channels• Convert Time to Distanceor Angle domain• Find simultaneous valuesacross multiple channels atmaximums and minimums• Turn a pulse signal into asmooth speed signal• Create/calculate new metadata items• Automated sorting andfiltering of tablesData Classification• Amplitude distribution – Probabilitydensity, point count, time at level• Frequency spectrum – PSD,Amplitude and Energy spectrums• Joint probability distribution function• Level crossing• Rainflow cycle counting – RangeMean, From To, Max Min, Range Only• Markov counting – from-totransition histogram binning• Differentiation• IntegrationCalculus• Automated unit conversionArithmetic Functions• Extensive mathematicaloperations on data• Add, Subtract, Multiply, Divide,Powers of, Square root, Sine, Cosine,Tangent, Secant, Cosecant, Cotangent,Equivalent anti trigonometric,Equivalent, Hyperbolic, Absolute,Log Base E, Log Base 10, AntiLog Base E, Anti Log Base 10Frequency Analysis• Auto spectrum of input• Auto spectrum of response• Cross Spectrum• Gain7www.hbm.com/ncode | ncode@hbmncode.com
<strong>nCode</strong> GlyphWorks Technical Features• Coherence• Short Time Fourier, Gabor• Full, 1/3, 1/6, 1/12, 1/24 Octave bands• Octave analysis with ISO2631 /ISO5349 vibration weighting• dB spectrum weighting• Noise spectrum weighting– dB(A), dB(B), dB(C)• User defined spectrum weighting• Waterfall analysis• Order slice• Waterfall X-slice, Y-slice, Sum to 2DSignal Filtering• Butterworth - low, high, band passand band stop. Up to 8th order,Forwards or Forwards/Backwards• Fourier - low, high, bandpass and band stop• Order tracking filter• ISO2631/UIC 513 – Wk, Wd,Wf, Wc, We, Wj, Wb• ISO 5349 Wh• A,B,C noise weighting• Application of user-specifiedtransfer function as filterAnomaly Detection• Spike detection – Differential,Statistical, Amplitude, Amplitude andDifferentiation, Crest Factor methods• Limit, flat line, drift detection• Channel statistic comparisonsStatisticsAvailable over full signal or on a runningwindow• Min, Max, Mean, Range, RMS• Standard deviation, variance,skewness, kurtosis, crest factor• Mode, median, percentiles• Periodic calculations forrotating machinery• IMSL Statistics option for extendedcapability including polynomialregression analysis, curvefitting and Weibull analysisFatigue Analysis• Stress-life (S-N) curve life and damageprediction – user defined methodsusing Python scripting language• Strain-life (E-N) curve life anddamage prediction - includingGray Iron materials• Kf back calculation• Scale factor back calculation• Time history output for damage• Complete schedules of multiple events• Mean stress corrections – FKM, Gerber,Goodman, Interpolation, Smith-Watson-Topper and Morrow methods• Surface treatment corrections• Surface finish corrections• Large pre-defined material database• Relative Damage comparison• Potential Damage Intensity comparisonCrack Growth• Linear elastic fracture mechanicswith editable architecture to enablecustom models to be builtCreep Analysis• Creep damage calculation for hightemperature applications usingLarson-Miller or Chaboche methods.Optimized Testing• Find the best mix of histogram or multicolumndata to match an overall target• Log and linear optimization usingbest fit least squares regression• Log and linear optimization usingconstrained minimizationAccelerated Testing• Definition of spectra for PSD, sweptsine, sine dwell and sine on random• Fatigue damage spectra (Timeseries and PSD inputs)• Shock response spectra (Timeseries and PSD inputs)• Calculate representative PSD orswept sine signals from FDSFatigue Editing• Time correlated removal ofnon-damaging cyclesStrain Rosette Calculations• For both strain and stress• Max/min, Abs Max principal• Max shear• Von Mises• Strain/stress at angle• Biaxiality ratio• AngleDisplays• Chart display, tabular charts• XY data plotting• XYZ 3D scatter plots• 3D dynamic histograms• GPS mapping (optionally usingMicrosoft MapPoint) - direct export toGoogle KML file for use in Google Earth• Waterfall plots• Video and audio playbackand synchronization• Gauge displayReporting• Report template creation touse in <strong>nCode</strong> Automation• Output to Microsoft Word,PowerPoint®, HTML, Adobe® <strong>PDF</strong>and image formats jpg, bmp, png• Displays and workspace havecopy to clipboard functionCustomization• GlyphBuilder capability enables directuse of MATLAB or Python programminglanguage to create new functions• Call any command line executableprocess/script such as VisualBasic, Visual Basic Script, Java,nCL, MathCAD, Fortran, C++Platform Support• 32-bit: Windows XP®, WindowsVista®, Windows® 7• 64-bit: Windows XP, Windows Vista,Windows 7 & 8, Red Hat® Enterprise6 Linux®, SUSE® Linux® 11.1S2984-5.0 enwww.hbm.com/ncode | info@hbmncode.com