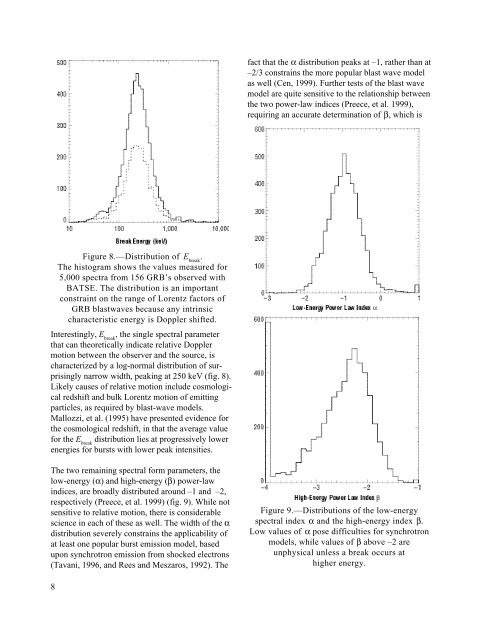
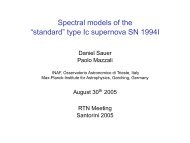
fact that the α distribution peaks at –1, rather than at–2/3 constrains the more popular blast wave modelas well (Cen, 1999). Further tests of the blast wavemodel are quite sensitive to the relationship betweenthe two power-law indices (Preece, et al. 1999),requiring an accurate determination of , which isFigure 8.—Distribution of E break.<strong>The</strong> histogram shows the values measured for5,000 spectra from 156 GRB’s observed withBATSE. <strong>The</strong> distribution is an importantconstraint on the range of Lorentz factors ofGRB blastwaves because any intrinsiccharacteristic energy is Doppler shifted.Interestingly, E break, the single spectral parameterthat can theoretically indicate relative Dopplermotion between the observer and the source, ischaracterized by a log-normal distribution of surprisinglynarrow width, peaking at 250 keV (fig. 8).Likely causes of relative motion include cosmologicalredshift and bulk Lorentz motion of emittingparticles, as required by blast-wave models.Mallozzi, et al. (1995) have presented evidence forthe cosmological redshift, in that the average valuefor the E breakdistribution lies at progressively lowerenergies for bursts with lower peak intensities.<strong>The</strong> two remaining spectral form parameters, thelow-energy ( ) and high-energy ( ) power-lawindices, are broadly distributed around –1 and –2,respectively (Preece, et al. 1999) (fig. 9). While notsensitive to relative motion, there is considerablescience in each of these as well. <strong>The</strong> width of thedistribution severely constrains the applicability ofat least one popular burst emission model, basedupon synchrotron emission from shocked electrons(Tavani, 1996, and Rees and Meszaros, 1992). <strong>The</strong>Figure 9.—Distributions of the low-energyspectral index and the high-energy index .Low values of pose difficulties for synchrotronmodels, while values of above –2 areunphysical unless a break occurs athigher energy.8
the most difficult to do with the current instrumentation.While the LAT will measure , only a broadbandburst monitor will be able to connect thisobservation with the other two spectral parameters.Those spectra with >–2 are especially interesting,in that the power per unit decade increases withincreasing energy, implying an unphysical infiniteenergy output. Where there were enough counts tobe statistically significant, the high-energy powerlaw component has been observed to extend throughthe bandpasses of all the CGRO instruments, includingEGRET (e.g. fig. 6). It is currently unknownat what typical energies this component cutsoff, yet arguments based on estimates of the efficiencyfor hard photon production, or theenergization of the particles that emit such photons,clearly predict some limiting energy for burstemission that the LAT should be able to determine.It is essential to know how this cut off, should it beobserved, behaves in relation to the evolution ofother spectral parameters, so that a unified pictureof the emission can be assembled.This picture should extend into the hard x-ray band,where a hint of extra spectral structure has beenobserved in 15 percent of all bursts. Figure 6 alsoshows an example of this, where the photon rate atthe lowest energy point is significantly differentthan the model rate. Here again, the correlationbetween the high and low regimes of energy shouldbe determined, with the LAT determining thepresence or absence of high-energy photons andthe GBM covering the lowest energies at a betterresolution and sensitivity than is possible withBATSE.1.1.2.4 Discovery of Burst Afterglowand <strong>Co</strong>unterpartsAlthough bursts’ output typically peak in the50–300 keV energy range, localization usinggamma-ray data simply cannot produce the accuracyrequired for telescope-based observations ofthe source. In the end, it took roughly 30 yearsfrom the discovery of GRB’s to determine thedistance to a sufficient number of candidate GRBcounterparts, emitting at other wavelengths, for thecosmological distance scale for bursts to be provenand for counterparts to be discovered. <strong>The</strong> firstobservation of counterparts came quite late in theprocess, requiring pointed x-ray observations byDutch–Italian instruments on board the BeppoSAXorbiting x-ray observatory, launched in April 1996.Several bursts were observed to fade in the x-rayband accessible to the Wide Field Camera (WFC)on BeppoSAX at long enough time scales for theextremely sensitive Narrow Field Instruments (NFI)to be pointed at the source. Finally, a fading pointsource was found by optical telescopes with alocation consistent with that provided by the SAXinstruments. Imaged much later by very powerfultelescopes, such as Keck and Hubble, these firstsource identifications emerged as distant galaxies,after the point source had faded away. It should benoted that the time scales for fading in GRB aftergloware not the same as the light curves establishedfor typical type II supernovae, so any associationbetween these two would involve unusual examplesof both. In several cases, the underlying galaxieswere bright enough for optical line emission spectroscopy,which gave a typical red shift for bursthost galaxies of z=1.<strong>The</strong> fading remnants of bursts, when they areobserved, cool rapidly with the peak in emissionpassing through x-ray, optical, and down to radiowavelengths. This behavior is reminiscent of anadiabatically cooling shocked fireball, which isthe standard picture for the observed afterglows ofbursts. Shocked acceleration of electrons is alsoconsistent with the detection of very high-energyphotons at times much later than the beginning ofthe event, as the time scale for accelerating electronsgrows increasingly longer with energy. <strong>The</strong>detection of very high-energy photons emitted bythese electrons, is one of the science goals of theLAT. However, there should be a context into whichthese higher-energy observations are placed. Interestingly,SAX has been unable to find an afterglowto any burst from the short duration class, thus nocounterparts for these bursts has been discovered.EGRET also was unable to investigate the shortclass bursts, with a dead time per photon that islonger than many of the bursts’ durations, eventhough they are harder, on the average, than thelonger class. Since the high-energy behavior thatthe LAT will explore for these events is completelyunknown, the GBM is required for their proper9