Co-Investigator - The Gamma-Ray Astronomy Team - NASA
Co-Investigator - The Gamma-Ray Astronomy Team - NASA
Co-Investigator - The Gamma-Ray Astronomy Team - NASA
- No tags were found...

Create successful ePaper yourself
Turn your PDF publications into a flip-book with our unique Google optimized e-Paper software.
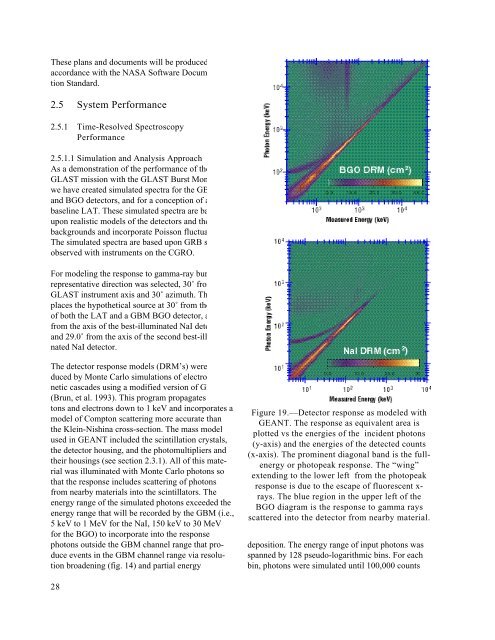
<strong>The</strong>se plans and documents will be produced inaccordance with the <strong>NASA</strong> Software DocumentationStandard.2.5 System Performance2.5.1 Time-Resolved SpectroscopyPerformance2.5.1.1 Simulation and Analysis ApproachAs a demonstration of the performance of theGLAST mission with the GLAST Burst Monitor,we have created simulated spectra for the GBM NaIand BGO detectors, and for a conception of abaseline LAT. <strong>The</strong>se simulated spectra are basedupon realistic models of the detectors and thebackgrounds and incorporate Poisson fluctuations.<strong>The</strong> simulated spectra are based upon GRB spectraobserved with instruments on the CGRO.For modeling the response to gamma-ray bursts, arepresentative direction was selected, 30˚ from theGLAST instrument axis and 30˚ azimuth. Thisplaces the hypothetical source at 30˚ from the axesof both the LAT and a GBM BGO detector, at 14.9˚from the axis of the best-illuminated NaI detector,and 29.0˚ from the axis of the second best-illuminatedNaI detector.<strong>The</strong> detector response models (DRM’s) were producedby Monte Carlo simulations of electromagneticcascades using a modified version of GEANT(Brun, et al. 1993). This program propagates photonsand electrons down to 1 keV and incorporates amodel of <strong>Co</strong>mpton scattering more accurate thanthe Klein-Nishina cross-section. <strong>The</strong> mass modelused in GEANT included the scintillation crystals,the detector housing, and the photomultipliers andtheir housings (see section 2.3.1). All of this materialwas illuminated with Monte Carlo photons sothat the response includes scattering of photonsfrom nearby materials into the scintillators. <strong>The</strong>energy range of the simulated photons exceeded theenergy range that will be recorded by the GBM (i.e.,5 keV to 1 MeV for the NaI, 150 keV to 30 MeVfor the BGO) to incorporate into the responsephotons outside the GBM channel range that produceevents in the GBM channel range via resolutionbroadening (fig. 14) and partial energyFigure 19.—Detector response as modeled withGEANT. <strong>The</strong> response as equivalent area isplotted vs the energies of the incident photons(y-axis) and the energies of the detected counts(x-axis). <strong>The</strong> prominent diagonal band is the fullenergyor photopeak response. <strong>The</strong> “wing”extending to the lower left from the photopeakresponse is due to the escape of fluorescent x-rays. <strong>The</strong> blue region in the upper left of theBGO diagram is the response to gamma raysscattered into the detector from nearby material.deposition. <strong>The</strong> energy range of input photons wasspanned by 128 pseudo-logarithmic bins. For eachbin, photons were simulated until 100,000 counts28