Co-Investigator - The Gamma-Ray Astronomy Team - NASA
Co-Investigator - The Gamma-Ray Astronomy Team - NASA
Co-Investigator - The Gamma-Ray Astronomy Team - NASA
- No tags were found...

You also want an ePaper? Increase the reach of your titles
YUMPU automatically turns print PDFs into web optimized ePapers that Google loves.
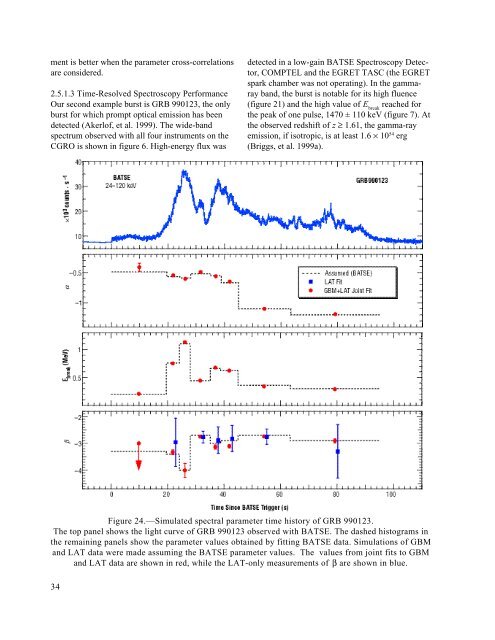
ment is better when the parameter cross-correlationsare considered.2.5.1.3 Time-Resolved Spectroscopy PerformanceOur second example burst is GRB 990123, the onlyburst for which prompt optical emission has beendetected (Akerlof, et al. 1999). <strong>The</strong> wide-bandspectrum observed with all four instruments on theCGRO is shown in figure 6. High-energy flux wasdetected in a low-gain BATSE Spectroscopy Detector,COMPTEL and the EGRET TASC (the EGRETspark chamber was not operating). In the gammarayband, the burst is notable for its high fluence(figure 21) and the high value of E breakreached forthe peak of one pulse, 1470 ± 110 keV (figure 7). Atthe observed redshift of z ≥ 1.61, the gamma-rayemission, if isotropic, is at least 1.6 × 10 54 erg(Briggs, et al. 1999a).Figure 24.—Simulated spectral parameter time history of GRB 990123.<strong>The</strong> top panel shows the light curve of GRB 990123 observed with BATSE. <strong>The</strong> dashed histograms inthe remaining panels show the parameter values obtained by fitting BATSE data. Simulations of GBMand LAT data were made assuming the BATSE parameter values. <strong>The</strong> values from joint fits to GBMand LAT data are shown in red, while the LAT-only measurements of β are shown in blue.34