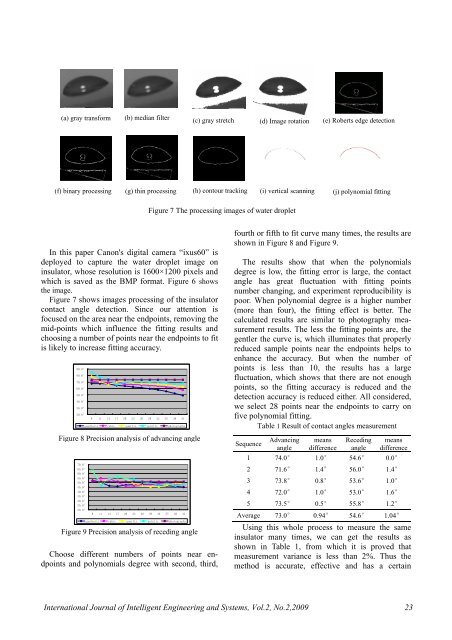
(a) gray transform (b) median filter (c) gray stretch (d) Image rotati<strong>on</strong>(e) Roberts edge detecti<strong>on</strong>(f) binary processing (g) thin processing (h) c<strong>on</strong>tour tracking (i) vertical scanning (j) polynomial fittingFigure 7 The processing images of water dropletIn this paper Can<strong>on</strong>'s digital camera “ixus60” isdeployed to capture the water droplet image <strong>on</strong>insulator, whose resoluti<strong>on</strong> is 1600×1200 pixels andwhich is saved as the BMP format. Figure 6 showsthe image.Figure 7 shows images processing of the insulatorc<strong>on</strong>tact angle detecti<strong>on</strong>. Since our attenti<strong>on</strong> isfocused <strong>on</strong> the area near the endpoints, removing themid-points which influence the fitting results andchoosing a number of points near the endpoints to fitis likely to increase fitting accuracy.90.0°80.0°70.0°60.0°50.0°40.0°30.0°20.0°70.0°65.0°60.0°55.0°50.0°45.0°40.0°35.0°30.0°25.0°20.0°8 11 14 17 20 23 26 29 32 35 38 41quadratic cubic quartic quintic photographyFigure 8 Precisi<strong>on</strong> analysis of advancing angle8 11 14 17 20 23 26 29 32 35 38 41quadratic cubic quartic quintic photographyFigure 9 Precisi<strong>on</strong> analysis of receding angleChoose different numbers of points near endpointsand polynomials degree <strong>with</strong> sec<strong>on</strong>d, third,fourth or fifth to fit curve many times, the results areshown in Figure 8 and Figure 9.The results show that when the polynomialsdegree is low, the fitting error is large, the c<strong>on</strong>tactangle has great fluctuati<strong>on</strong> <strong>with</strong> fitting pointsnumber changing, and experiment reproducibility ispoor. When polynomial degree is a higher number(more than four), the fitting effect is better. Thecalculated results are similar to photography measurementresults. The less the fitting points are, thegentler the curve is, which illuminates that properlyreduced sample points near the endpoints helps toenhance the accuracy. But when the number ofpoints is less than 10, the results has a largefluctuati<strong>on</strong>, which shows that there are not enoughpoints, so the fitting accuracy is reduced and thedetecti<strong>on</strong> accuracy is reduced either. All c<strong>on</strong>sidered,we select 28 points near the endpoints to carry <strong>on</strong>five polynomial fitting.Table 1 Result of c<strong>on</strong>tact angles measurementSequenceAdvancinganglemeansdifferenceRecedinganglemeansdifference1 74.0° 1.0° 54.6° 0.0°2 71.6° 1.4° 56.0° 1.4°3 73.8° 0.8° 53.6° 1.0°4 72.0° 1.0° 53.0° 1.6°5 73.5° 0.5° 55.8° 1.2°Average 73.0° 0.94° 54.6° 1.04°Using this whole process to measure the sameinsulator many times, we can get the results asshown in Table 1, from which it is proved thatmeasurement variance is less than 2%. Thus themethod is accurate, effective and has a certainInternati<strong>on</strong>al Journal of Intelligent Engineering and Systems, Vol.2, No.2,2009 23
perspective of practice.5. C<strong>on</strong>clusi<strong>on</strong>In this paper, the detecti<strong>on</strong> method of hydrophobicity<strong>on</strong> insulator surface based <strong>on</strong> imageprocessing could detect the c<strong>on</strong>tact angle <strong>with</strong>digital image processing techniques automatically.But further work should be d<strong>on</strong>e to make thismethod realized, such as how the image are gottenand how the image processing are taken in anembedded system. In additi<strong>on</strong>, how the partialhydrophobicity is synthesized to evaluate the performanceof an insulator and how the estimati<strong>on</strong> ofc<strong>on</strong>tact angles are affected when many water droplets<strong>with</strong> different sizes are present should bec<strong>on</strong>sidered. Now this method provides the theorybasic for the development of the insulator hydrophobicity<strong>on</strong>line detecti<strong>on</strong> equipment.References[ 1 ] Cigré Working Group 22.03 (c<strong>on</strong>vener C. deTourreil), “Worldwide service experience <strong>with</strong> HVcomposite insulators”, In: Electra, Vol.191, pp.27-43, 2000.[2] SHEN Xiaojun, JIANG Xiuchen, ZENG Yi, et al,“Harm<strong>on</strong>ic electric field method for live detectingDC insulator”, In: Automati<strong>on</strong> of Electric PowerSystems, Vol.29(15), pp.63-67, 2005.[3] Zhao Hanbiao, Lin Hui, Xie Lili, et al, “On-linem<strong>on</strong>itoring system <strong>on</strong> measuring leakage currentnear HV side for electrical transmissi<strong>on</strong> lineinsulators”, In: Automati<strong>on</strong> of Electric Power Systems,Vol. 28(22), pp. 78-82, 2004.[4] YANG Fan, LI Jiaxiang, YAO Degui, et al, “Chargesimulati<strong>on</strong> method base insulator n<strong>on</strong>-touchingelectric field mapping method”, In: Automati<strong>on</strong> ofElectric Power Systems, Vol.28(15), pp.95-99, 2004.[5] GAO Qiang, ZENG Chang’an, LI Heming, “A studyof c<strong>on</strong>taminati<strong>on</strong> detecting of insulators using thecomplex dielectric c<strong>on</strong>stant”, In: Automati<strong>on</strong> ofElectric Power Systems, Vol.31(18), pp.72-76, 2007.[ 6 ] G. H. Vaillancourt, S. Carignan, and C. Jean,“Experience <strong>with</strong> the detecti<strong>on</strong> of faulty compositeinsulators <strong>on</strong> high-voltage power lines by the electricfield measurement method”, In: IEEE Trans. OnPower Delivery, Vol.13 (2), pp.661-666, 1998.[7] C. de Tourreil, “Status of inspecti<strong>on</strong> techniques toassess the c<strong>on</strong>diti<strong>on</strong> of n<strong>on</strong>-ceramic insulators inservice”, In: Proc. Insulator 2000 World C<strong>on</strong>gress,pp. 222-230, Barcel<strong>on</strong>a, Spain, 1999.[8] HE Wei, CHEN Tao, LIU Xiaoming, et al, “On-linem<strong>on</strong>itoring system of faulty insulator based <strong>on</strong>n<strong>on</strong>-touching UV pulse method” , In: Automati<strong>on</strong> ofElectric Power Systems, Vol.30(10), pp.69-74, 2006.[9] E. Spangenberg and G. Riquel, “In service diagnosticof composite insulators EDF's test results”, In: Proc.10th Int. Symp. <strong>on</strong> HV Eng., Vol.4, pp.139-142,M<strong>on</strong>tréal, Québec, Canada, 1997.[10] HE H<strong>on</strong>gyin, YAO Jiangang, JIANG Zhengl<strong>on</strong>g, etal, “Infrared thermal image detecting of high voltageinsulator c<strong>on</strong>taminati<strong>on</strong> grades based <strong>on</strong> supportvector machine”. In: Automati<strong>on</strong> of Electric PowerSystems, Vol.29(24), pp.70-74, 2005.[11] HE H<strong>on</strong>gying, YAO Jiangang, LUO Diansheng, etal,“Characteristic extracti<strong>on</strong> method of c<strong>on</strong>taminatedinsulator infrared image based <strong>on</strong> K-L transform”. In:Automati<strong>on</strong> of Electric Power Systems, Vol.30(17),pp.76-80, 2006.[12] L. E. Lundgaard and W. Hansen, “Acoustic methodfor quality c<strong>on</strong>trol and in-service periodicm<strong>on</strong>itoring of medium voltage cable terminati<strong>on</strong>s”,In: Proc. 1998 IEEE Int. Symp. <strong>on</strong> Electrical Insulati<strong>on</strong>,Vol.1, Arlingt<strong>on</strong>, Virgina, USA, pp.130-133,1998.[13] A. J. McGrail, D. W. Auckland, and B. R. Varlow,“Detecting and classifying flaws <strong>with</strong>in insulatingmaterials using ultrasound”, In: Proc. 1994 IEEE Int.Symp. <strong>on</strong> Electrical Insulati<strong>on</strong>, pp.22-24, Pittsburgh,PA, USA, 1994.[14] Y. C. Chen, C. R. Li, X. Liang, and S. Wang, “Theinfluence of water and polluti<strong>on</strong> <strong>on</strong> diagnosingdefective composite insulator by electric fieldmapping”, In: Proc. 11th Int. Symp. <strong>on</strong> HV Eng.,Vol.4, L<strong>on</strong>d<strong>on</strong>, UK, pp.345-348, 1999.[15] “STRI Hydrophobicity Classificati<strong>on</strong> Guide”. In:Swedish Transmissi<strong>on</strong> Research Institute, 1992.[16] A. Erikss<strong>on</strong> and D. Wikström, “Influence of thehydrophobicity of outdoor insulators <strong>on</strong> the flashovervoltage”, In: Proc. Nordic Insulati<strong>on</strong> Symp.(Nord-IS '94), pp.39-51, Vaasa, Finland, 1994.[17] T. Tokoro, Y. Omoto, and M. Kosaki, “Imageanalysis of hydrophobicity of polymer insulatorsusing PVM”, In: Proc. IEEE C<strong>on</strong>f. <strong>on</strong> ElectricalInsulati<strong>on</strong> and Dielectric Phenomena, pp.581-584,Kitchener, Ont., Canada, 2001.[18] PENG Kexue, WANG Quande, WANG Xianpei,“Spray image analysis based measurement ofhydrophobic of insulator surfaces”. In: InsulatingMaterials, Vol.1, pp.47-51, 2005.[19] Gubanski, S.M. Dernfalk, A. Anderss<strong>on</strong>, and J.Hillborg, H, “Diagnostic <str<strong>on</strong>g>Method</str<strong>on</strong>g>s for OutdoorPolymeric <strong>Insulators</strong>”, In: Dielectrics and ElectricalInsulati<strong>on</strong>, IEEE Transacti<strong>on</strong>s <strong>on</strong>, Vol.14(5),pp.1065-1080, 2007.[20] ZHU H<strong>on</strong>g, MA Tiehua. “Utilizati<strong>on</strong> computersoftware dealing <strong>with</strong> and calculating the c<strong>on</strong>tactangle of solid-liquid gas interface”. In: Metrologyand Measurement Technique, pp.39-41, 2004.Internati<strong>on</strong>al Journal of Intelligent Engineering and Systems, Vol.2, No.2,2009 24